Kalyani Steels: To keep its growth story in coming quarters, buy
•
0 likes•681 views

At CMP of Rs.101.00, the stock P/E ratio is at 5.97 x FY15E and 5.04 x FY16E. The company surplus scenario is likely to continue for the next three years and will keep its growth story in the coming quarters also. Buy the stock for a price target of Rs.123.00.

Recommended
Recommended
More Related Content
What's hot
What's hot (7)
Viewers also liked
Similar to Kalyani Steels: To keep its growth story in coming quarters, buy
Similar to Kalyani Steels: To keep its growth story in coming quarters, buy (20)
More from IndiaNotes.com
More from IndiaNotes.com (20)
Recently uploaded
Recently uploaded (20)
Kalyani Steels: To keep its growth story in coming quarters, buy
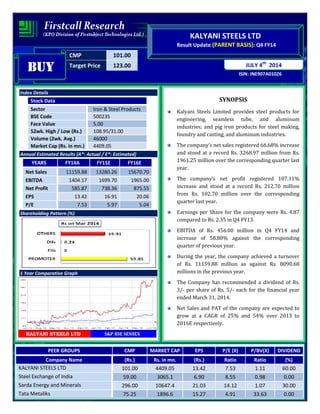
- 1. CMP 101.00 Target Price 123.00 ISIN: INE907A01026 JULY 4th 2014 KALYANI STEELS LTD Result Update (PARENT BASIS): Q4 FY14 BUYBUYBUYBUY Index Details Stock Data Sector Iron & Steel Products BSE Code 500235 Face Value 5.00 52wk. High / Low (Rs.) 108.95/31.00 Volume (2wk. Avg.) 46000 Market Cap (Rs. in mn.) 4409.05 Annual Estimated Results (A*: Actual / E*: Estimated) YEARS FY14A FY15E FY16E Net Sales 11159.88 13280.26 15670.70 EBITDA 1404.17 1699.70 1965.00 Net Profit 585.87 738.36 875.55 EPS 13.42 16.91 20.06 P/E 7.53 5.97 5.04 Shareholding Pattern (%) 1 Year Comparative Graph KALYANI STEELS LTD S&P BSE SENSEX SYNOPSIS Kalyani Steels Limited provides steel products for engineering, seamless tube, and aluminum industries; and pig iron products for steel making, foundry and casting, and aluminum industries. The company’s net sales registered 66.68% increase and stood at a record Rs. 3268.97 million from Rs. 1961.25 million over the corresponding quarter last year. The company’s net profit registered 107.11% increase and stood at a record Rs. 212.70 million from Rs. 102.70 million over the corresponding quarter last year. Earnings per Share for the company were Rs. 4.87 compared to Rs. 2.35 in Q4 FY13. EBITDA of Rs. 456.00 million in Q4 FY14 and increase of 58.80% against the corresponding quarter of previous year. During the year, the company achieved a turnover of Rs. 11159.88 million as against Rs. 8090.68 millions in the previous year. The Company has recommended a dividend of Rs. 3/- per share of Rs. 5/- each for the financial year ended March 31, 2014. Net Sales and PAT of the company are expected to grow at a CAGR of 25% and 54% over 2013 to 2016E respectively. PEER GROUPS CMP MARKET CAP EPS P/E (X) P/BV(X) DIVIDEND Company Name (Rs.) Rs. in mn. (Rs.) Ratio Ratio (%) KALYANI STEELS LTD 101.00 4409.05 13.42 7.53 1.11 60.00 Steel Exchange of India 59.00 3065.1 6.90 8.55 0.98 0.00 Sarda Energy and Minerals 296.00 10647.4 21.03 14.12 1.07 30.00 Tata Metaliks 75.25 1896.6 15.27 4.91 33.63 0.00
- 2. QUARTERLY HIGHLIGHTS (PARENT BASIS) Results updates- Q4 FY14, Months Mar-14 Mar-13 % Change Net Sales 3268.97 1961.25 66.68 PAT 212.70 102.70 107.11 EPS 4.87 2.35 107.11 EBITDA 456.00 287.16 58.80 The company net profit jumps to Rs. 212.70 million against Rs. 102.70 million in the corresponding quarter ending of previous year, an increase of 107.11%. The company achieved a turnover of Rs. 3268.97 million registering an increase of 66.68% for the 4th quarter of the current year 2013-14 as against Rs. 1961.25 millions in the corresponding quarter of the previous year. Reported earnings per share of the company stood at Rs. 4.87 a share during the quarter as against Rs. 2.35 over previous year period. Profit before interest, depreciation and tax is Rs. 456.00 million as against Rs. 287.16 million in the corresponding period of the previous year. Break up of Expenditure Particulars Rs. Million Q4 FY14 Q4 FY13 Cost of Material Consumed 1724.89 927.87 Employee Benefit Expenses 148.99 105.30 Depreciation & Amortization 85.15 64.43 Other Expenditure 689.94 398.30 Conversion in cost 360.28 228.10
- 3. COMPANY PROFILE Kalyani Steels Limited was established in 1973 and is engaged in the manufacture and sale of forging and engineering carbon and alloy steel in India. The company provides steel products for engineering, seamless tube, and aluminum industries; and pig iron products for steel making, foundry and casting, and aluminum industries. It also markets various components for commercial vehicles, two wheelers, diesel engines, bearings, tractors, turbines, and rail. The company also exports its products. In addition, the company is involved in power generation business. Over the years, Kalyani Steels has been continuously and extensively upgrading its technology and infrastructure. Today the integrated steel complex has hot metal capacity of 650000 Tpa of carbon and alloy steels, a with three Mini Blast Furnaces, two Rolling Mills, Sinter plant, Power plant, BFG fired re-heating furnaces, state-of –the-art testing facilities and many such modern equipment, in a sprawling green 375 acre campus. The company has earned the status of preferred steel supplier for engineering, seamless tube and aluminium-smelting industry. Products Application • Rolled Bars for Automative Application • Rolled Bars for Engineering Application • Round Cast for Seamless Tube Industry • Machined Bars for Aluminium Smelting Industry
- 4. FINANCIAL HIGHLIGHT (PARENT BASIS) (A*- Actual, E* -Estimations & Rs. In Millions) Balance sheet as at March 31, 2013A-2016E FY13A FY14A FY15E FY16E EQUITY AND LIABILITIES: Shareholders’ Funds: Share Capital 218.64 218.64 218.64 218.64 Reserves and Surplus 3327.34 3759.99 4286.39 4843.62 1) Sub Total Net worth 3545.98 3978.63 4505.03 5062.26 Non-Current Liabilities: Long-term borrowings 1251.57 1266.80 1285.80 1302.52 Deferred Tax Liabilities [Net] 382.75 436.15 479.77 518.15 Other Long Term Liabilities 795.02 918.70 1028.94 1131.84 Long Term Provisions 5.79 2.38 2.48 2.55 2) Non-Current Liabilities 2435.13 2624.03 2796.99 2955.05 Current Liabilities: Short-term borrowings 266.22 584.10 788.54 946.24 Trade Payables 1513.39 2445.80 3277.37 4195.04 Other Current Liabilities 516.78 550.90 583.95 613.15 Short Term Provisions 82.80 161.64 213.36 260.31 3) Current Liabilities 2379.19 3742.44 4863.23 6014.73 Total Liabilities (1+2+3) 8360.30 10345.10 12165.24 14032.05 ASSETS: Non-Current Assets: a)Fixed Assets 3514.78 3491.16 3560.98 3614.40 b) Non Current Investments 487.30 311.56 324.02 333.74 c) Long Term Loans and Advances 575.90 921.04 1132.88 1336.80 4) Non-Current Assets 4577.98 4723.76 5017.88 5284.94 Current Assets: Inventories 1282.63 1709.31 2029.64 2390.22 Trade Receivables 1794.71 3316.25 4510.10 5682.73 Cash and Bank Balances 89.58 167.96 218.35 257.65 Short Term Loans and Advances 522.07 363.91 320.24 342.66 Other Current Assets 93.33 63.91 69.02 73.85 5) Current Assets 3782.32 5621.34 7147.35 8747.11 Total Assets (4+5) 8360.30 10345.10 12165.24 14032.05
- 5. Annual Profit & Loss Statement for the period of 2013 to 2016E Value(Rs. mn) FY13A FY14A FY15E FY16E Description 12m 12m 12m 12m Net Sales 8090.68 11159.88 13280.26 15670.70 Other Income 71.55 117.92 159.19 194.21 Total Income 8162.23 11277.80 13439.45 15864.92 Expenditure -7324.43 -9873.63 -11739.75 -13899.91 Operating Profit 837.80 1404.17 1699.70 1965.00 Interest -224.84 -170.02 -195.52 -215.08 Gross profit 612.96 1234.15 1504.18 1749.93 Depreciation -235.63 -339.56 -376.91 -407.06 Profit Before Tax 377.33 894.59 1127.27 1342.86 Tax -138.73 -309.40 -388.91 -467.32 Profit After Tax 238.60 585.19 738.36 875.55 Extraordinary Items 0.08 0.68 0.00 0.00 Net Profit 238.68 585.87 738.36 875.55 Equity capital 218.27 218.27 218.27 218.27 Reserves 3327.34 3759.99 4286.39 4843.62 Face value 5.00 5.00 5.00 5.00 EPS 5.47 13.42 16.91 20.06 Quarterly Profit & Loss Statement for the period of 30 SEP, 2013 to 30 JUNE, 2014E Value(Rs. mn) 30-Sep-13 31-Dec-13 31-Mar-14 30-Jun-14E Description 3m 3m 3m 3m Net Sales 2475.61 2968.00 3268.97 3563.18 Other income 9.76 14.23 82.52 59.41 Total Income 2485.37 2982.23 3351.49 3622.59 Expenditure -2177.38 -2617.08 -2895.49 -3167.66 Operating profit 307.99 365.15 456.00 454.93 Interest -38.30 -43.28 -49.51 -54.46 Gross profit 269.69 321.87 406.49 400.47 Depreciation -86.10 -87.50 -85.15 -97.07 Profit Before Tax 183.59 234.37 321.34 303.40 Tax -65.21 -81.03 -109.32 -104.06 Profit After Tax 118.38 153.34 212.02 199.33 Extraordinary Items 0.00 0.00 0.68 0.69 Net Profit 118.38 153.34 212.70 200.02 Equity capital 218.27 218.27 218.27 218.27 Face value 5.00 5.00 5.00 5.00 EPS 2.71 3.51 4.87 4.58
- 6. Ratio Analysis Particulars FY13A FY14A FY15E FY16E EPS (Rs.) 5.47 13.42 16.91 20.06 EBITDA Margin (%) 10.36 12.58 12.80 12.54 PBT Margin (%) 4.66 8.02 8.49 8.57 PAT Margin (%) 2.95 5.24 5.56 5.59 P/E Ratio (x) 18.47 7.53 5.97 5.04 ROE (%) 6.73 14.71 16.39 17.30 ROCE (%) 21.20 29.91 31.56 32.45 Debt Equity Ratio 0.43 0.47 0.46 0.44 EV/EBITDA (x) 6.97 4.34 3.69 3.26 Book Value (Rs.) 81.22 91.13 103.19 115.95 P/BV 1.24 1.11 0.98 0.87 Charts
- 7. OUTLOOK AND CONCLUSION At the current market price of Rs.101.00, the stock P/E ratio is at 5.97 x FY15E and 5.04 x FY16E respectively. Earnings per share (EPS) of the company for the earnings for FY15E and FY16E are seen at Rs. 16.91 and Rs. 20.06 respectively. Net Sales and PAT of the company are expected to grow at a CAGR of 25% and 54% over 2013 to 2016E respectively. On the basis of EV/EBITDA, the stock trades at 3.69 x for FY15E and 3.26 x for FY16E. Price to Book Value of the stock is expected to be at 0.98 x and 0.87 x respectively for FY15E and FY16E. We expect that the company surplus scenario is likely to continue for the next three years, will keep its growth story in the coming quarters also. We recommend ‘BUY’ in this particular scrip with a target price of Rs. 123.00 for Medium to Long term investment.
- 8. INDUSTRY OVERVIEW India has become the second best in terms of growth amongst the top ten steel producing countries in the world and a net exporter of steel during 2013–14. Steel production in India recorded a growth rate of 4.8 per cent in February 2014 over February 2013. The cumulative growth during April–February, 2013–14 stood at 4.2 per cent over the corresponding period of the previous year. Steel contributes to nearly two per cent of the gross domestic product (GDP) and employs over 500,000 people. The total market value of the Indian steel sector stood at US$ 57.8 billion in 2011 and is expected to touch US$ 95.3 billion by 2016. The infrastructure sector is India’s largest steel consumer, thereby attracting investments from several global players. Owing to this connection with core infrastructure segments of the economy, the steel industry is of high priority right now. Also, steel demand is derived from other sectors like automobiles, consumer durables and infrastructure; therefore, its fortune is dependent on the growth of these user industries. The liberalisation of the industrial policy and other government initiatives has given a definite impetus for entry, participation and growth of the private sector in the steel industry. Allowing foreign direct investment (FDI) has been a positive step since India is heavily dependent on foreign technologies. These foreign technologies generally add life to the plant and production units, which ultimately lead to the country’s economic growth. Market Size India’s real consumption of total finished steel grew by 0.6 per cent year-on-year in April–March 2013-14 to 73.93 million tonnes (MT), according to Joint Plant Committee (JPC), Ministry of Steel. Construction sector accounts for around 60 per cent of the country's total steel demand while the automobile industry consumes 15 per cent. India became net steel exporter in 2013–14 and is likely to maintain the momentum in 2014-15 as producers are looking to dock more overseas shipment to tide over subdued domestic consumption. Total steel exports by India during 2013–14 stood at 5.59 MT, as against imports of 5.44 MT. During the period, Steel Authority of India (SAIL) clocked a 30 per cent growth in exports and aims to more than double the shipments to 1 MT in 2014–15. Rashtriya Ispat Nigam Ltd (RINL), which exported 1 lakh tonne steel last fiscal, aims to treble that in the current fiscal. Iron ore export from India has showed a 253 per cent increase during the period October–December 2013, at 3.75 MT as against 1.06 MT in the corresponding period of the previous year, on the back of the opening of new mines in Chhattisgarh, Madhya Pradesh and Rajasthan, as per the Federation of Indian Mineral Industries (FIMI). Investments India needs investment of US$ 210 billion over the next decade to achieve the steel production capacity of 300 million tonnes per annum (MTPA) by 2025 from the current 90 MT.
- 9. Some of the major investments in the sector are as follows: India's third-largest steel maker, JSW Steel, plans to purchase Welspun Maxsteel for about Rs 1,000 crore (US$ 165.32 million). The acquisition will help JSW secure continuous supply of cheaper raw material as it plans to expand its capacity at Dolvi, Maharashtra, to 5 MT to supply in the western and northern markets. Prize Petroleum, a wholly-owned subsidiary of Hindustan Petroleum Corporation Ltd (HPCL), has acquired stakes in two Australian hydrocarbon fields for A$ 85 million (US$ 79.27 million). The company has entered into an agreement with Sydney-based AWE Ltd to acquire 11.25 per cent stake in T/L1 area and 9.75 per cent interest in T/18P area. McNally Bharat Engineering Co Ltd has entered Russia for the first time through a subsidiary, MBE Coal & Minerals Technologies GMBH. It received an order worth €5.95 million (US$ 8.21 million) from Eurochem Group of Russia for an iron ore mining project. Canada has invited Coal India Ltd (CIL) to explore mining opportunities in British Columbia, Canada. Mr Stewart Beck, Canadian High Commissioner met with Mr N Kumar, Director (Technical) of Coal India Ltd, to seek investments for coal assets in the Canadian province. CIL currently holds interests in two assets in Mozambique acquired through a concession agreement between the African and Indian governments. Government Initiatives The Government of India has allowed 100 per cent FDI through the automatic route in the Indian steel sector. It has significantly reduced the duty payable on finished steel products and has streamlined the associated approval process. In order to provide thrust on research and development (R&D), the Ministry of Steel is encouraging R&D activities both in public and private steel sectors, by providing financial assistance from Steel Development Fund (SDF) and Plan Scheme of the Central Government. Under the SDF scheme, 82 R&D projects have been approved with total project cost of Rs 677 crore (US$ 111.92 million) wherein SDF assistance is Rs 370 crore (US$ 61.17 million). Under the Plan Scheme, eight projects were approved with a total cost of Rs 123.27 crore (US$ 20.38 million) wherein Government assistance is Rs 87.28 crore (US$ 14.43 million). To encourage beneficiation and pelletisation of iron ore fines in the country, basic customs duty on the plants and equipment required for initial setting up or substantial expansion of iron ore pellets plants and iron ore beneficiation plants has been reduced from 7.5 per cent to 2.5 per cent. Import of critical raw materials for steel industry, such as coking coal, non-coking coal and scrap are subject to zero or very low levels of custom duty.
- 10. Road Ahead The future of the Indian steel industry is bright. The government plans to increase infrastructure spending from the current 5 per cent GDP to 10 per cent by 2017, and the country is committed to investing US$ 1 trillion in infrastructure during the 12th Five-Year plan. Taking 15 per cent as steel component in the total investment, then it can generate additional demand worth US$ 75 billion of steel in the next few years or US$ 15 billion worth of additional demand a year or in terms of quantity, an additional demand of 18.75 MT per annum. With urban population increasing globally, there is a greater need for steel to build public-transport infrastructure. Emerging economies will also continue to be a major driver of demand as these necessitate a huge amount of steel for urbanisation and industrialisation. The sector is expected to see an investment to the tune of about Rs 2 trillion (US$ 33.06 billion) in the coming years, as per domestic giant, Tata Steel. Disclaimer: This document prepared by our research analysts does not constitute an offer or solicitation for the purchase or sale of any financial instrument or as an official confirmation of any transaction. The information contained herein is from publicly available data or other sources believed to be reliable but do not represent that it is accurate or complete and it should not be relied on as such. Firstcall India Equity Advisors Pvt. Ltd. or any of it’s affiliates shall not be in any way responsible for any loss or damage that may arise to any person from any inadvertent error in the information contained in this report. This document is provide for assistance only and is not intended to be and must not alone be taken as the basis for an investment decision.
- 11. Firstcall India Equity Research: Email – info@firstcallindia.com C.V.S.L.Kameswari Pharma U. Janaki Rao Capital Goods B. Anil Kumar Auto, IT & FMCG M. Vinayak Rao Diversified C. Bhagya Lakshmi Diversified B. Vasanthi Diversified Firstcall India also provides Firstcall India Equity Advisors Pvt.Ltd focuses on, IPO’s, QIP’s, F.P.O’s,Takeover Offers, Offer for Sale and Buy Back Offerings. Corporate Finance Offerings include Foreign Currency Loan Syndications, Placement of Equity / Debt with multilateral organizations, Short Term Funds Management Debt & Equity, Working Capital Limits, Equity & Debt Syndications and Structured Deals. Corporate Advisory Offerings include Mergers & Acquisitions(domestic and cross-border), divestitures, spin-offs, valuation of business, corporate restructuring-Capital and Debt, Turnkey Corporate Revival – Planning & Execution, Project Financing, Venture capital, Private Equity and Financial Joint Ventures Firstcall India also provides Financial Advisory services with respect to raising of capital through FCCBs, GDRs, ADRs and listing of the same on International Stock Exchanges namely AIMs, Luxembourg, Singapore Stock Exchanges and other international stock exchanges. For Further Details Contact: 3rd Floor,Sankalp,The Bureau,Dr.R.C.Marg,Chembur,Mumbai 400 071 Tel. : 022-2527 2510/2527 6077/25276089 Telefax : 022-25276089 E-mail: info@firstcallindiaequity.com www.firstcallindiaequity.com