ABB Q1CY15: Buy for a medium to long term investment
•
1 like•216 views

Firstcall recommends ABB for mid- to long-term for target of RS1,480 after Q1CY15 net profit hits Rs542.9m

Recommended
Recommended
More Related Content
What's hot
What's hot (10)
Similar to ABB Q1CY15: Buy for a medium to long term investment
Similar to ABB Q1CY15: Buy for a medium to long term investment (20)
More from IndiaNotes.com
More from IndiaNotes.com (20)
Recently uploaded
Recently uploaded (20)
ABB Q1CY15: Buy for a medium to long term investment
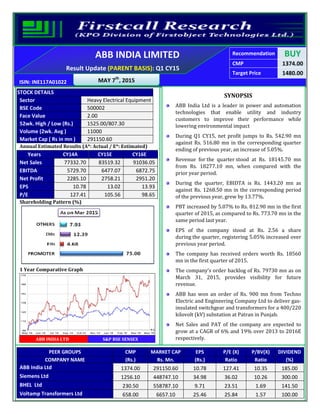
- 1. Recommendation BUY CMP 1374.00 Target Price 1480.00 ISIN: INE117A01022 MAY 7th , 2015 ABB INDIA LIMITED Result Update (PARENT BASIS): Q1 CY15 STOCK DETAILS Sector Heavy Electrical Equipment BSE Code 500002 Face Value 2.00 52wk. High / Low (Rs.) 1525.00/807.30 Volume (2wk. Avg ) 11000 Market Cap ( Rs in mn ) 291150.60 Annual Estimated Results (A*: Actual / E*: Estimated) Years CY14A CY15E CY16E Net Sales 77332.70 83519.32 91036.05 EBITDA 5729.70 6477.07 6872.75 Net Profit 2285.10 2758.21 2951.20 EPS 10.78 13.02 13.93 P/E 127.41 105.56 98.65 Shareholding Pattern (%) 1 Year Comparative Graph ABB INDIA LTD S&P BSE SENSEX SYNOPSIS ABB India Ltd is a leader in power and automation technologies that enable utility and industry customers to improve their performance while lowering environmental impact During Q1 CY15, net profit jumps to Rs. 542.90 mn against Rs. 516.80 mn in the corresponding quarter ending of previous year, an increase of 5.05%. Revenue for the quarter stood at Rs. 18145.70 mn from Rs. 18277.10 mn, when compared with the prior year period. During the quarter, EBIDTA is Rs. 1443.20 mn as against Rs. 1268.50 mn in the corresponding period of the previous year, grew by 13.77%. PBT increased by 5.07% to Rs. 812.90 mn in the first quarter of 2015, as compared to Rs. 773.70 mn in the same period last year. EPS of the company stood at Rs. 2.56 a share during the quarter, registering 5.05% increased over previous year period. The company has received orders worth Rs. 18560 mn in the first quarter of 2015. The company’s order backlog of Rs. 79730 mn as on March 31, 2015, provides visibility for future revenue. ABB has won an order of Rs. 900 mn from Techno Electric and Engineering Company Ltd to deliver gas- insulated switchgear and transformers for a 400/220 kilovolt (kV) substation at Patran in Punjab. Net Sales and PAT of the company are expected to grow at a CAGR of 6% and 19% over 2013 to 2016E respectively. PEER GROUPS CMP MARKET CAP EPS P/E (X) P/BV(X) DIVIDEND COMPANY NAME (Rs.) Rs. Mn. (Rs.) Ratio Ratio (%) ABB India Ltd 1374.00 291150.60 10.78 127.41 10.35 185.00 Siemens Ltd 1256.10 448747.10 34.98 36.02 10.26 300.00 BHEL Ltd 230.50 558787.10 9.71 23.51 1.69 141.50 Voltamp Transformers Ltd 658.00 6657.10 25.46 25.84 1.57 100.00
- 2. FINANCIAL HIGHLIGHTS (PARENT BASIS) Results updates- Q1 CY15, ABB is the leading power & automation engineering companies and its portfolio ranges from light switches to robots, and from huge electrical transformers to control systems that manage entire power networks & factories in the world and the largest in India, reported its financial results for the quarter ended 31st Mar, 2015. Months Mar-15 Mar-14 % Change Net Sales 18145.70 18277.10 -0.72% Net Profit 542.90 516.80 5.05% EPS 2.56 2.44 5.05% EBITDA 1443.20 1268.50 13.77% The company net profit jumps to Rs. 542.90 million against Rs. 516.80 million in the corresponding quarter ending of previous year, an increase of 5.05%. Revenue for the quarter fell by 0.72% to Rs. 18145.70 million from Rs. 18277.10 million, when compared with the prior year period. Reported earnings per share of the company stood at Rs. 2.56 a share during the quarter, registering 5.05% increased over previous year period. Profit before interest, depreciation and tax is Rs. 1443.20 million as against Rs. 1268.50 million in the corresponding period of the previous year. Expenditure: Break up of Expenditure Rs. million Q1 CY15 Q1 CY14 % Change Cost of materials consumed & Purchases of project items 10100.60 10333.50 -2% Purchase of Stock in Trade 763.20 823.30 -7% Subcontracting Expenses 1090.00 1076.00 1% Employee Benefit Expenses 1827.70 1681.40 9% Depreciation & Amortization Expense 422.30 274.10 54% Other Expenditure 2956.30 3001.80 -2%
- 3. Segment Revenue Orders • The company received orders worth Rs. 18560 mn in the first quarter of 2015. A double digit growth in short cycle orders helped sustain business momentum. A consistent order backlog of Rs. 79730 mn as on March 31, 2015, provides visibility for future revenue. • ABB has won an order of Rs. 900 mn from Techno Electric and Engineering Company Ltd. (Techno), an Indian EPC player, to deliver gas-insulated switchgear (GIS) and transformers for a 400/220 kilovolt (kV) substation at Patran in Punjab. The project is due for completion in 2016. Company Profile ABB Group Company was incorporated in India in 1949; it is leader in power automation technologies. These technologies enable industrial customers to improve performance along with lower environment impact. The ABB Group has 14 manufacturing units in India. It operates in 100 countries and has employed 140,000 people. In India it has presence across 30 marketing offices, 8 service centers, 3 logistics warehouses and network of 750 channel partners. ABB is a global leader in power and automation technologies that enable utility and industry customers to improve performance while lowering environmental impact. For more than 100 years, ABB and its predecessor companies have set the pace for innovation in technologies to harvest energy, improve productivity, safeguard the environment, increase profits, and more. The company modern-day power and automation technologies are derived from the efforts of dozens of leading companies and thousands of talented individuals worldwide.
- 4. Financial Highlight (PARENT BASIS) (A*- Actual, E* -Estimations & Rs. In Millions) Balance sheet as at December 31st, 2013-2016E ABB INDIA LTD CY13A CY14A CY15E CY16E SOURCES OF FUNDS Shareholder's Funds Share Capital 423.80 423.80 423.80 423.80 Reserves and Surplus 26351.80 27696.00 30454.21 33405.41 1. Sub Total - Net worth 26775.60 28119.80 30878.01 33829.21 Non Current Liabilities Other Long term Liabilities 41.70 45.10 47.36 49.72 Long Term Provisions 57.10 374.40 434.30 490.76 2. Sub Total - Non Current Liabilities 98.80 419.50 481.66 540.49 Current Liabilities Short-term borrowings 6201.10 3710.70 2894.35 2460.19 Trade Payables 20825.80 19840.20 20733.01 21562.33 Other Current Liabilities 13959.50 12977.00 13755.62 14250.82 Short Term Provisions 2634.50 3149.30 3621.70 4020.08 3. Sub Total - Current Liabilities 43620.90 39677.20 41004.67 42293.43 Total Liabilities (1+2+3) 70495.30 68216.50 72364.34 76663.12 APPLICATION OF FUNDS Non-Current Assets Fixed Assets Tangible Assets 12680.20 12840.20 13482.21 14021.50 Intangible Assets 1234.90 1155.20 1212.96 1261.48 Capital work-in-progress 474.90 319.30 341.65 358.73 a) Sub Total - Fixed Assets 14390.00 14314.70 15036.82 15641.71 b) Non-current investments 164.70 163.90 180.29 194.71 c) Deferred tax assets 279.30 152.30 137.07 126.10 d) Long Term loans and advances 3508.90 4015.30 4497.14 4946.85 e) Other non-current assets 83.00 74.80 80.04 84.84 1. Sub Total – Non Current Assets 18425.90 18721.00 19931.35 20994.22 Current Assets Current Investments 0.80 0.80 0.84 0.92 Inventories 9888.50 8938.20 9653.26 10328.98 Trade receivables 32357.20 31575.20 33153.96 35129.10 Cash and Bank Balances 3165.80 2259.60 2485.56 2684.40 Short-terms loans & advances 2567.70 2774.50 2915.86 3090.82 Other current assets 4089.40 3947.20 4223.50 4434.68 2. Sub Total - Current Assets 52069.40 49495.50 52432.98 55668.91 Total Assets (1+2) 70495.30 68216.50 72364.34 76663.12
- 5. Annual Profit & Loss Statement for the period of 2013 to 2016E Value(Rs.in.mn) CY13A CY14A CY15E CY16E Description 12m 12m 12m 12m Net Sales 77219.90 77332.70 83519.32 91036.05 Other Income 69.90 172.80 129.60 136.08 Total Income 77289.80 77505.50 83648.92 91172.13 Expenditure -72520.70 -71775.80 -77171.85 -84299.39 Operating Profit 4769.10 5729.70 6477.07 6872.75 Interest -1011.30 -1049.50 -997.03 -1036.91 Gross profit 3757.80 4680.20 5480.04 5835.84 Depreciation -1033.10 -1128.10 -1207.07 -1267.42 Profit Before Tax 2724.70 3552.10 4272.98 4568.42 Tax -955.80 -1267.00 -1514.77 -1617.22 Profit After Tax 1768.90 2285.10 2758.21 2951.20 Extraordinary Items 24.20 0.00 0.00 0.00 Net Profit 1793.10 2285.10 2758.21 2951.20 Equity capital 423.80 423.80 423.80 423.80 Reserves 26351.80 27696.00 30454.21 33405.41 Face value 2.00 2.00 2.00 2.00 EPS 8.46 10.78 13.02 13.93 Quarterly Profit & Loss Statement for the period of 30th Sep, 2014 to 30th June, 2015E Value(Rs.in.mn) 30-Sep-14 31-Dec-14 31-Mar-15 30-Jun-15E Description 3m 3m 3m 3m Net sales 18449.70 22384.10 18145.70 19052.99 Other income 10.50 146.90 7.20 8.06 Total Income 18460.20 22531.00 18152.90 19061.05 Expenditure -17208.40 -20583.80 -16709.70 -17604.96 Operating profit 1251.80 1947.20 1443.20 1456.09 Interest -275.40 -299.80 -208.00 -232.96 Gross profit 976.40 1647.40 1235.20 1223.13 Depreciation -283.40 -292.00 -422.30 -447.64 Profit Before Tax 693.00 1355.40 812.90 775.49 Tax -243.20 -513.80 -270.00 -272.97 Net Profit 449.80 841.60 542.90 502.52 Equity capital 423.80 423.80 423.80 423.80 Face value 2.00 2.00 2.00 2.00 EPS 2.12 3.97 2.56 2.37
- 6. Ratio Analysis Particulars CY13A CY14A CY15E CY16E EPS (Rs.) 8.46 10.78 13.02 13.93 EBITDA Margin (%) 6.18% 7.41% 7.76% 7.55% PBT Margin (%) 3.53% 4.59% 5.12% 5.02% PAT Margin (%) 2.29% 2.95% 3.30% 3.24% P/E Ratio (x) 162.37 127.41 105.56 98.65 ROE (%) 6.61% 8.13% 8.93% 8.72% ROCE (%) 17.59% 21.54% 22.75% 22.43% Debt Equity Ratio 0.23 0.13 0.09 0.07 EV/EBITDA (x) 61.69 51.07 45.01 42.33 Book Value (Rs.) 126.36 132.70 145.72 159.65 P/BV 10.87 10.35 9.43 8.61 Charts
- 7. Outlook and Conclusion At the current market price of Rs.1374.00, the stock P/E ratio is at 105.56 x CY15E and 98.65 x CY16E respectively. Earning per share (EPS) of the company for the earnings for CY15E and CY16E is seen at Rs.13.02 and Rs.13.93 respectively. Net Sales and PAT of the company are expected to grow at a CAGR of 6% and 19% over 2013 to 2016E respectively. On the basis of EV/EBITDA, the stock trades at 45.01 x for CY15E and 42.33 x for CY16E. Price to Book Value of the stock is expected to be at 9.43 x and 8.61 x for CY15E and CY16E respectively. We recommend ‘BUY’ in this particular scrip with a target price of Rs.1480.00 for Medium to Long term investment. Industry Overview Capital goods and engineering turnover in India is expected to reach US$ 125.4 billion by 2017 from US$ 57.6 billion in 2012, while the electrical equipment market size is forecasted to touch US$ 105 billion by 2022 from US$ 24.2 billion in 2011. Also, the Indian telecom equipment market is expected to reach US$ 37 billion by 2020 from US$ 16 billion in 2011. The Indian engineering sector is divided into two major segments - heavy engineering and light engineering. Indian engineering exports stood at US$ 62.3 billion in FY14, registering a compound annual growth rate (CAGR) of 10.8 per cent over FY08-14. The Government of India has de-licensed the engineering industry and 100 per cent foreign direct investment (FDI) has been permitted in the sector. The government has also eliminated tariff protection on capital goods and reduced custom duties on a range of engineering equipment. It launched the National Manufacturing Policy with the aim of enhancing the sector's share in gross domestic product (GDP) to 25 per cent within a decade and creating 100 million jobs by 2022. Demand for machine tools from the capital goods sector (especially automobile and textile industries) is projected to remain high. Considering the industry's demand for higher productivity, superior precision and accuracy, as well as low-cost manufacturing solutions, computer numerically controlled (CNC) machine tools are set to be in greater demand.
- 8. Disclaimer: This document is prepared by our research analysts and it does not constitute an offer or solicitation for the purchase or sale of any financial instrument or as an official confirmation of any transaction. The information contained herein is from publicly available data or other sources believed to be reliable but we do not represent that it is accurate or complete and it should not be relied on as such. Firstcall Research or any of its affiliates shall not be in any way responsible for any loss or damage that may arise to any person from any inadvertent error in the
- 9. information contained in this report. Firstcall Research and/ or its affiliates and/or employees will not be liable for the recipients’ investment decision based on this document. Firstcall India Equity Research: Email – info@firstobjectindia.com C.V.S.L.Kameswari Pharma & Diversified U. Janaki Rao Capital Goods B. Anil Kumar Auto, IT & FMCG M. Vinayak Rao Diversified G. Amarender Diversified Firstcall Research Provides Industry Research on all the Sectors and Equity Research on Major Companies forming part of Listed and Unlisted Segments For Further Details Contact: Tel.: 022-2527 2510/2527 6077 / 25276089 Telefax: 022-25276089 040-20000235 /20000233 E-mail: info@firstobjectindia.com www.firstcallresearch.com