Firstcall recommend Surya Roshni, Q4FY15 net profits up 61.69% y/y
1. CMP 108.60
Target Price 130.00
ISIN: INE335A01012
JUNE 22nd
2015
SURYA ROSHNI LIMITED
Result Update (PARENT BASIS): Q4 FY15
BUYBUYBUYBUY
Index Details
Stock Data
Sector Iron & Steel Products
BSE Code 500336
Face Value 10.00
52wk. High / Low (Rs.) 143.00/83.10
Volume (2wk. Avg. Q.) 43000
Market Cap (Rs. in mn.) 4759.94
Annual Estimated Results (A*: Actual / E*: Estimated)
YEARS FY15A FY16E FY17E
Net Sales 28571.00 30856.68 33633.78
EBITDA 2268.20 2416.99 2650.52
Net Profit 540.90 597.05 711.92
EPS 12.34 13.62 16.24
P/E 8.80 7.97 6.69
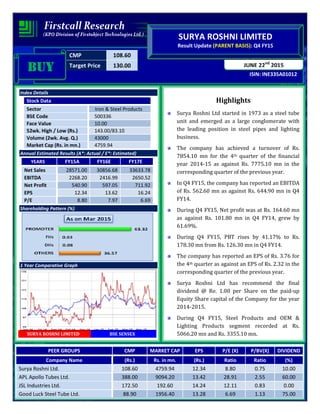
Shareholding Pattern (%)
1 Year Comparative Graph
SURYA ROSHNI LIMITED BSE SENSEX
Highlights
Surya Roshni Ltd started in 1973 as a steel tube
unit and emerged as a large conglomerate with
the leading position in steel pipes and lighting
business.
The company has achieved a turnover of Rs.
7854.10 mn for the 4th quarter of the financial
year 2014-15 as against Rs. 7775.10 mn in the
corresponding quarter of the previous year.
In Q4 FY15, the company has reported an EBITDA
of Rs. 562.60 mn as against Rs. 644.90 mn in Q4
FY14.
During Q4 FY15, Net profit was at Rs. 164.60 mn
as against Rs. 101.80 mn in Q4 FY14, grew by
61.69%.
During Q4 FY15, PBT rises by 41.17% to Rs.
178.30 mn from Rs. 126.30 mn in Q4 FY14.
The company has reported an EPS of Rs. 3.76 for
the 4th quarter as against an EPS of Rs. 2.32 in the
corresponding quarter of the previous year.
Surya Roshni Ltd has recommend the final
dividend @ Re. 1.00 per Share on the paid-up
Equity Share capital of the Company for the year
2014-2015.
During Q4 FY15, Steel Products and OEM &
Lighting Products segment recorded at Rs.
5066.20 mn and Rs. 3355.10 mn.
PEER GROUPS CMP MARKET CAP EPS P/E (X) P/BV(X) DIVIDEND
Company Name (Rs.) Rs. in mn. (Rs.) Ratio Ratio (%)
Surya Roshni Ltd. 108.60 4759.94 12.34 8.80 0.75 10.00
APL Apollo Tubes Ltd. 388.00 9094.20 13.42 28.91 2.55 60.00
JSL Industries Ltd. 172.50 192.60 14.24 12.11 0.83 0.00
Good Luck Steel Tube Ltd. 88.90 1956.40 13.28 6.69 1.13 75.00
2. QUARTERLY HIGHLIGHTS (PARENT BASIS)
Results updates- Q4 FY15
Surya Roshni Limited has a widespread marketing
network with separate teams focusing on the steel
and lighting divisions, reported its financial results
for the quarter ended 31st Mar, 2015.
The company has achieved a turnover of Rs. 7854.10 million for the 4th quarter of the financial year 2014-15 as
against Rs. 7775.10 millions in the corresponding quarter of the previous year. The company has reported an
EBITDA of Rs. 562.60 million as against Rs. 644.90 million in Q4 FY14. Net profit was at Rs. 164.60 million
against Rs. 101.80 million in the corresponding quarter of the previous year. The company has reported an EPS
of Rs. 3.76 for the 4th quarter as against an EPS of Rs. 2.32 in the corresponding quarter of the previous year.
Break up of Expenditure:
RS. In Million Q4 FY15 Q4 FY14
%
Change
Cost of Material 4719.20 5359.60 -12%
Stock in Trade 665.30 347.00 92%
Emply Benefit Exp 406.30 453.30 -10%
Dep & AmortzExp 142.20 141.10 1%
Other Expenses 1262.00 968.80 30%
Months Mar-15 Mar-14 % Change
Net Sales 7854.10 7775.10 1.02%
PAT 164.60 101.80 61.69%
EPS 3.76 2.32 61.69%
EBITDA 562.60 644.90 -12.76%
3. Segment Revenue
Latest Updates
• Surya Roshni Ltd has recommend the final dividend @ Re. 1.00 per Share on the paid-up Equity Share capital
of the Company for the year 2014-2015.
COMPANY PROFILE
Surya Roshni Limited (SRL), incorporated in 1973 is into the business of manufacturing electric resistance
welded (ERW) steel pipes & lighting products, with facilities at Bahadurgarh (Haryana), Kashipur (Uttarakhand)
and Malanpur (Madhya Pradesh). Products in steel division include ERW pipes, cold rolled (CR) sheets, whereas
lighting division includes compact fluorescent lights (CFLs), fluorescent tubular lights (FTLs), general lighting
system (GLS) & luminaries (lights for industrial and commercial applications).
The company holds 53.37% stake in Surya Global Steel Tubes Ltd. (SGL), incorporated in 2009, a company into
manufacturing of ERW and spiral pipes at Bhuj (Gujarat). Under its steel division SRL (including SGL) has a
manufacturing capacity of around 5,82,000 Metric Tonnes Per Annum (MTPA) of ERW pipes, 2,00,000 MTPA of
spiral pipes and 1,15,000 MTPA of CR sheets. Under the lighting division SRL has a manufacturing capacity of 66
Million Per Annum (MPA) of CFLs, 187 MPA of GLS and 63MPA of FTL.
Distribution network & Certifications
The company has a strong marketing network of around 1,500 dealers and 200,000 retailers spread across the
country for its lighting portfolio while it has a dealer network of around 150 dealers and 20,000 retailers for
selling its steel products. SRL exports its lighting products and American Petroleum Institute (API) certified ERW
pipes to more than 45 countries across the world including the United Arab Emirates (UAE), Canada, Netherland,
United Kingdom (UK), USA, Australia, etc. The company is a pioneer in this industry to have implemented the
4. concept of total quality management. Both the plants have deservedly won the ISO 9001:2000, ISO 14001:1996
and OHSAS18001:1999 certifications. Surya GLS also conforms to prestigious European safety standards - "CE" &
TUV Bauart.
Diversified product
The company has a diversified product portfolio which covers a range of steel products viz. ERW pipes, Spiral
Pipes, Cold Rolled (CR) strips, and lighting products. Among the lighting products, the company produces
General Lighting System (GLS), Fluoroscent Tubular Lamps (FTLs), Compact Fluoroscent Lamps (CFLs), high
mast luminaries (lights for commercial and industrial applications), etc.
Products
• General Lighting Service Lamps
• Fluorescent Tube Lamps
• Compact Fluorescent Lamps
• HID Lamps
• Luminaires
• Lighting Poles
• High Masts
• Accessories
• Components
5. FINANCIAL HIGHLIGHT (PARENT BASIS) (A*- Actual, E* -Estimations & Rs. In Millions)
Balance Sheet as at March 31st, 2014 -2017E
SURYA ROSHNI LIMITED FY14A FY15A FY16E FY17E
I EQUITY AND LIABILITIES
A) Shareholder's Funds:
a) Share Capital 438.30 438.30 438.30 438.30
b) Reserves and Surplus 7300.80 7671.90 8316.34 8981.65
Sub -Total Net worth 7739.10 8110.20 8754.64 9419.95
B) Non Current Liabilities:
a) Long term borrowing 4009.70 3642.70 3424.14 3287.17
b) Deferred Tax Liabilities 483.50 513.00 538.65 560.20
c) Other Long term liabilities 58.00 70.30 81.55 92.15
d) Long term Provisions 171.10 192.10 213.23 232.42
Sub-Total Non Current Liabilities 4722.30 4418.10 4257.57 4171.94
C) Current Liabilities:
a) Short term borrowings 5501.50 5155.20 5000.54 4800.52
b) Trade payables 1158.30 1721.30 2151.63 2581.95
c) Other Current Liabilities 1161.50 1206.80 1279.21 1368.75
d) Short term Provisions 424.60 177.20 217.96 257.19
Sub-Total Current Liabilities 8245.90 8260.50 8649.33 9008.41
TOTAL EQUITY AND LIABILITIES (A + B + C) 20707.30 20788.80 21661.54 22600.30
II ASSETS
D) Non-Current Assets:
a) Fixed Assets 9655.69 9628.50 9917.36 10214.88
b) Non- Current Investments 500.00 500.00 517.50 538.20
Sub-Total Non-Current Assets 10155.69 10128.50 10434.86 10753.08
E) Current Assets:
a) Inventories 4331.30 3895.20 4089.96 4253.56
b) Trade receivables 4965.80 5242.30 5451.99 5724.59
c) Cash and Bank Balances 246.91 263.50 279.31 293.28
d) Short-terms loans & advances 940.30 1176.90 1311.49 1470.59
e) Other current assets 67.30 82.40 93.94 105.21
Sub-Total Current Assets 10551.61 10660.30 11226.69 11847.22
TOTAL ASSETS (D + E) 20707.30 20788.80 21661.54 22600.30
6. Annual Profit & Loss Statement for the period of 2014 to 2017E
Value(Rs.in.mn) FY14A FY15A FY16E FY17E
Description 12m 12m 12m 12m
Net Sales 30309.70 28571.00 30856.68 33633.78
Other Income 35.90 37.30 41.03 43.90
Total Income 30345.60 28608.30 30897.71 33677.68
Expenditure -27973.20 -26340.10 -28480.72 -31027.16
Operating Profit 2372.40 2268.20 2416.99 2650.52
Interest -1144.70 -1090.00 -1144.50 -1213.17
Gross profit 1227.70 1178.20 1272.49 1437.35
Depreciation -556.40 -560.40 -594.02 -623.73
Profit Before Tax 671.30 617.80 678.47 813.62
Tax -137.70 -76.90 -81.42 -101.70
Net Profit 533.60 540.90 597.05 711.92
Equity capital 438.30 438.30 438.30 438.30
Reserves 5506.70 5878.30 6475.35 7187.28
Face value 10.00 10.00 10.00 10.00
EPS 12.17 12.34 13.62 16.24
Quarterly Profit & Loss Statement for the period of 30th Sep, 2014 to 30th June, 2015E
Value(Rs.in.mn) 30-Sep-14 31-Dec-14 31-Mar-15 30-Jun-15E
Description 3m 3m 3m 3m
Net sales 6917.10 7078.70 7854.10 7068.69
Other income 5.30 2.20 27.80 22.80
Total Income 6922.40 7080.90 7881.90 7091.49
Expenditure -6349.50 -6507.10 -7319.30 -6524.40
Operating profit 572.90 573.80 562.60 567.09
Interest -289.50 -269.50 -242.10 -227.57
Gross profit 283.40 304.30 320.50 339.51
Depreciation -139.70 -141.90 -142.20 -147.89
Profit Before Tax 143.70 162.40 178.30 191.62
Tax -20.70 -21.10 -13.70 -24.53
Net Profit 123.00 141.30 164.60 167.10
Equity capital 438.30 438.30 438.30 438.30
Face value 10.00 10.00 10.00 10.00
EPS 2.81 3.22 3.76 3.81
8. OUTLOOK AND CONCLUSION
At the current market price of Rs. 108.60, the stock P/E ratio is at 7.97 x FY16E and 6.69 x FY17E
respectively.
Earning per share (EPS) of the company for the earnings for FY16E and FY17E is seen at Rs.13.62 and
Rs.16.24 respectively.
On the basis of EV/EBITDA, the stock trades at 5.34 x for FY16E and 4.74 x for FY17E.
Price to Book Value of the stock is expected to be at 0.69 x and 0.62 x for FY16E and FY17E respectively.
We recommend ‘BUY’ in this particular scrip with a target price of Rs.130.00 for Medium to Long term
investment.
INDUSTRY OVERVIEW
Steel industry
India is the fourth-largest producer of crude steel (up from eighth in 2003) and is slated to become the second-
largest steel producer by 2016, as large public and private sector players strengthen steel production capacity in
view of rising demand. The market value of the Indian steel sector is expected to reach US$ 95.3 billion by FY16.
Driven by rising infrastructure development and growing demand for automotives; steel consumption is
expected to reach 104 million tonnes (MT) by 2017. Infrastructure is India’s largest steel consumer, accounting
for 63 per cent of total consumption in FY12.
Steel production in India has increased at a compound annual growth rate (CAGR) of 7.9 per cent over FY09–14
to record 81.54 mtpa. The industry capacity is expected to increase to 112.5 MT by FY16. Total domestic demand
9. for steel estimated at 113.3 million tonnes per annum (MTPA) by 2016-17. Moreover, 301 memorandums of
understanding (MoUs) have been signed with various states for planned capacity of about 486.7 MT.
The Government of India has also allowed 100 per cent foreign direct investment (FDI) under the automatic
route in the steel sector. National Steel Policy (NSP) has been implemented to encourage the industry to reach
global benchmarks. In addition, the government has also stepped up infrastructure spending from the current 5
per cent of gross domestic product (GDP) to 10 per cent by 2017. India is committed to investing US$ 1 trillion in
infrastructure during the 12th Five Year Plan (2012–17), from US$ 428 billion in the 11th Five-Year Plan.
Lighting industry
Lighting is always a prime necessity in the modern world. It is an important component in the industrial growth
of a country and vital at the domestic front for a good living. With the increase in residential houses, the demand
for lighting and consequently the lighting industries are growing at tremendous pace. With a general Lighting is
always a prime necessity in the modern world. It is an important component in the industrial growth of a country
and vital at the domestic front for a good living. With the increase in residential houses, the demand for lighting
and consequently the lighting industries are growing at tremendous pace.
Disclaimer:
This document is prepared by our research analysts and it does not constitute an offer or solicitation for the
purchase or sale of any financial instrument or as an official confirmation of any transaction. The information
contained herein is from publicly available data or other sources believed to be reliable but we do not represent that
it is accurate or complete and it should not be relied on as such. Firstcall Research or any of its affiliates shall not be
in any way responsible for any loss or damage that may arise to any person from any inadvertent error in the
information contained in this report. Firstcall Research and/ or its affiliates and/or employees will not be liable for
the recipients’ investment decision based on this document.
10. Firstcall India Equity Research: Email – info@firstobjectindia.com
C.V.S.L.Kameswari Pharma & Diversified
U. Janaki Rao Capital Goods
B. Anil Kumar Auto, IT & FMCG
M. Vinayak Rao Diversified
G. Amarender Diversified
Firstcall Research Provides
Industry Research on all the Sectors and Equity Research on Major Companies
forming part of Listed and Unlisted Segments
For Further Details Contact:
Tel.: 022-2527 2510/2527 6077 / 25276089 Telefax: 022-25276089
040-20000235 /20000233
E-mail: info@firstobjectindia.com
www.firstcallresearch.com