Download as PDF, PPTX


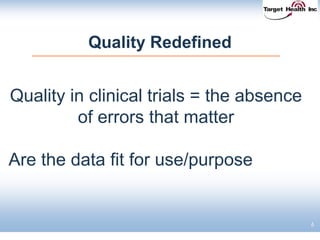
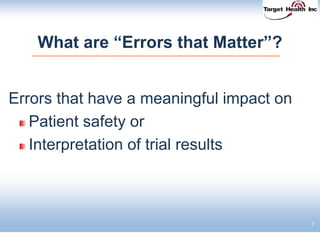
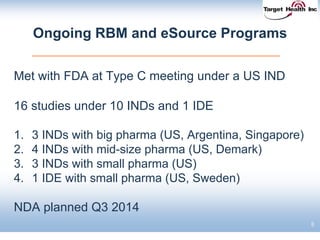


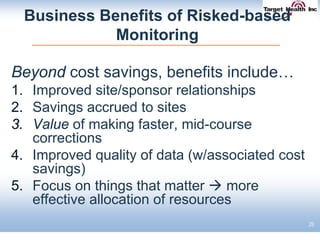


The document discusses the integration of risk-based monitoring and eSource methodologies in clinical trials, emphasizing the balance between central monitoring and on-site monitoring to ensure data quality and patient safety. It highlights the importance of data accuracy with a focus on meaningful errors and their impact on trial results, showcasing metrics from a Phase 3 study. Key benefits of the approach include improved relationships with sites, cost savings, and enhanced data quality through more effective resource allocation.


