This document discusses alternative approaches to 100% source data verification (SDV) in clinical trials, specifically risk-based SDV. It evaluates the pros and cons of different SDV approaches, including the FDA-supported risk-based approach. The document proposes modifying the SDV process using a risk-based approach to focus monitoring on critical data elements rather than all data, which could reduce costs without undermining data integrity. Literature on SDV approaches and extent of monitoring is reviewed, and factors to consider in a risk-based approach are discussed.
![R E G U L A T O R Y A F F A I R S 745
Vadim Tantsyrra, MS, MA,
DrPH (c)
Director, Data Management,
Infinity Pharmaceuticals
Imogene Grimes, PhD
Vice President. Statistics
and Data Management,
Infinity Pharmaceuticals
Jrlrs Mitchel, PhD, MBA
President. Target Health Inc
Kayo Fendt, MSPH
Director, Regulatory and
Quality. Duke Clinical
Research Institute
Sorgiy Sirichenko, MS
Data Strategist, PAREXEL
International
Joel Waters, MBA
Associate Director, PDG
Technical Support.
PAREXEL International
Jim Crowe, MS
Director, Clinical and
Nonclinical Statistics,
PAREXEL International
Barbara Tardiff, MD, MBA
Corporate VicePresident,
Data Sciences, PAREXEL
lnternational
Key Words
Source data verification;
Data quality; Site
monitoring; Risk-based
approach; Key variables
Carrespondonce Address
Vadim Tantsyura. MS. MA,
DrPH (c), 68 JudithDrive,
Danbury. CT 068I I (email:
vadim.tantsyura@gmail
.corn).
Risk-basedSource Data Verification
Approaches: Pros and Cons
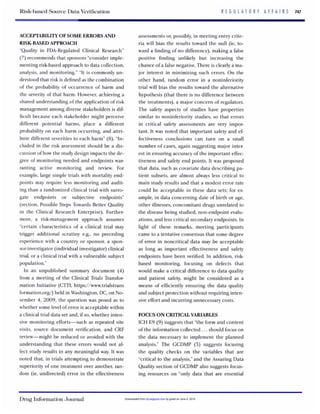
Thehighcostof sourcedata vmjication (SDV),
particulariyin large trials, has made it a target
of scrutiny over the last decade. In addition,
the positive impact (ie, cost-benefit ratio of
SDV)on overall data quality is often ques-
tioned. As a result, regulators and industry
groupshave started looking at alternativeSDV
approaches. This article evaluates the FDA-
supported risk-based approach to SDV and
provides a proposal on how to modifvthe SDV
process without undermining the validity and
integrity of the trial data. It summarizes alter-
native approaches to 100%SDV and evalu-
atesthe advantages and disadvantages of risk-
based SDV (rSDV). The regulatory, data
quality, andcostimplications of each approach
areconsidered. Theeconomicsof rSDVaredis-
cussed and the cost implications of rSDV are
presented based on the results of exploratory
analysesfor four hypothetical trials in cardiol-
ogy and oncology.
INTRODUCTION
Source data verification (SDV)is one of many
quality steps employed by sponsors and CROs
to ensure clinical trial data validity. Other steps
include training of clinical investigators and
study personnel on the protocol and case re-
port forms (CRFs), data validation procedures
using programmed and manual data reviews,
and, finally, audits of clinical sites. SDV,in par-
ticular, allows for the evaluation of the confor-
mity of clinical trial data presented in the CRF
with data collected in the study subject source
record at the clinical trial research site. SDV
also ensures that "the reported trial data are ac-
curate, complete, and verifiable from source
documents" (1). As a component of study qual-
ity management, SDV adds to the scientific and
ethical integrity of the clinical trial. The extent
of the SDV is often debated, as the GCP (ICH
E6, 5.18.3 Extent and Nature of Monitoring)
language leaves much room for interpretation:
The sponsor should ensure that the trials are ad-
equately monitored. The sponsor should deter-
mine the appropriate extent and nature of moni-
toring. The determination of the extent and na-
ture of monitoring should be based on
considerationssuch as the objective,purpose,de-
sign, complexity, blinding, size, and endpoints of
the trial. In general there is a need for on-site
monitoring, before, during, and after the trial;
however in exceptional circumstances the spon-
sor may determine that central monitoring in
conjunction with procedures such as investiga-
tors training and meetings,and extensivewritten
guidance can assure appropriate conduct of the
trial in accordance with GCF! Statistically con-
trolled sampling may be an acceptable method
for selecting the data to be veri$ed. [Authors'
emphasis]
Clinical site monitoring can consume up to
30% of overall trial costs (2). This high cost,
particularly in large trials, has made it a target
of criticism over the last decade. In addition,
the positive impact (ie. cost-benefit ratio of
SDV)on overall data quality is often questioned.
For instance, significant resources are dedicat-
ed to SDV of data that have no or minimal im-
pact on study conclusions (eg, physical exami-
nation, medical history, or vital signs, especially
when they are not analysis variables). Second,
SDV is a manual review process, and it has been
well documented that the human review pro-
cess is only 85%accurate (3). Third, while SDV
is an effective way to capture certain types of
errors such as protocol violations, transcription
errors, and human errors in reading equipment
or printouts, it is not as effective and efficient
in dealing with other factors, such as transcrip-
tion errors within the source document, infor-
Drug InformationJournnl. Vd.44,pp. 745-756.2010. 0092-8615/2010
Printed in the USA.All rights reserved.Copyright 02010 Drug InformationAssociation. Inc.
Submittedforpublication:March 25,2010
Accepted forpublication:July 19,2010by guest on June 4, 2015dij.sagepub.comDownloaded from](https://image.slidesharecdn.com/ab9812f8-eaeb-4a8c-997e-a740ad487550-150605004359-lva1-app6892/85/Risk-based-SDV-Approaches-Pros-Cons-2010-1-320.jpg)
![R E G U L A T O R Y A F F A I R S 745
Vadim Tantsyrra, MS, MA,
DrPH (c)
Director, Data Management,
Infinity Pharmaceuticals
Imogene Grimes, PhD
Vice President. Statistics
and Data Management,
Infinity Pharmaceuticals
Jrlrs Mitchel, PhD, MBA
President. Target Health Inc
Kayo Fendt, MSPH
Director, Regulatory and
Quality. Duke Clinical
Research Institute
Sorgiy Sirichenko, MS
Data Strategist, PAREXEL
International
Joel Waters, MBA
Associate Director, PDG
Technical Support.
PAREXEL International
Jim Crowe, MS
Director, Clinical and
Nonclinical Statistics,
PAREXEL International
Barbara Tardiff, MD, MBA
Corporate VicePresident,
Data Sciences, PAREXEL
lnternational
Key Words
Source data verification;
Data quality; Site
monitoring; Risk-based
approach; Key variables
Carrespondonce Address
Vadim Tantsyura. MS. MA,
DrPH (c), 68 JudithDrive,
Danbury. CT 068I I (email:
vadim.tantsyura@gmail
.corn).
Risk-basedSource Data Verification
Approaches: Pros and Cons
Thehighcostof sourcedata vmjication (SDV),
particulariyin large trials, has made it a target
of scrutiny over the last decade. In addition,
the positive impact (ie, cost-benefit ratio of
SDV)on overall data quality is often ques-
tioned. As a result, regulators and industry
groupshave started looking at alternativeSDV
approaches. This article evaluates the FDA-
supported risk-based approach to SDV and
provides a proposal on how to modifvthe SDV
process without undermining the validity and
integrity of the trial data. It summarizes alter-
native approaches to 100%SDV and evalu-
atesthe advantages and disadvantages of risk-
based SDV (rSDV). The regulatory, data
quality, andcostimplications of each approach
areconsidered. Theeconomicsof rSDVaredis-
cussed and the cost implications of rSDV are
presented based on the results of exploratory
analysesfor four hypothetical trials in cardiol-
ogy and oncology.
INTRODUCTION
Source data verification (SDV)is one of many
quality steps employed by sponsors and CROs
to ensure clinical trial data validity. Other steps
include training of clinical investigators and
study personnel on the protocol and case re-
port forms (CRFs), data validation procedures
using programmed and manual data reviews,
and, finally, audits of clinical sites. SDV,in par-
ticular, allows for the evaluation of the confor-
mity of clinical trial data presented in the CRF
with data collected in the study subject source
record at the clinical trial research site. SDV
also ensures that "the reported trial data are ac-
curate, complete, and verifiable from source
documents" (1). As a component of study qual-
ity management, SDV adds to the scientific and
ethical integrity of the clinical trial. The extent
of the SDV is often debated, as the GCP (ICH
E6, 5.18.3 Extent and Nature of Monitoring)
language leaves much room for interpretation:
The sponsor should ensure that the trials are ad-
equately monitored. The sponsor should deter-
mine the appropriate extent and nature of moni-
toring. The determination of the extent and na-
ture of monitoring should be based on
considerationssuch as the objective,purpose,de-
sign, complexity, blinding, size, and endpoints of
the trial. In general there is a need for on-site
monitoring, before, during, and after the trial;
however in exceptional circumstances the spon-
sor may determine that central monitoring in
conjunction with procedures such as investiga-
tors training and meetings,and extensivewritten
guidance can assure appropriate conduct of the
trial in accordance with GCF! Statistically con-
trolled sampling may be an acceptable method
for selecting the data to be veri$ed. [Authors'
emphasis]
Clinical site monitoring can consume up to
30% of overall trial costs (2). This high cost,
particularly in large trials, has made it a target
of criticism over the last decade. In addition,
the positive impact (ie. cost-benefit ratio of
SDV)on overall data quality is often questioned.
For instance, significant resources are dedicat-
ed to SDV of data that have no or minimal im-
pact on study conclusions (eg, physical exami-
nation, medical history, or vital signs, especially
when they are not analysis variables). Second,
SDV is a manual review process, and it has been
well documented that the human review pro-
cess is only 85%accurate (3). Third, while SDV
is an effective way to capture certain types of
errors such as protocol violations, transcription
errors, and human errors in reading equipment
or printouts, it is not as effective and efficient
in dealing with other factors, such as transcrip-
tion errors within the source document, infor-
Drug InformationJournnl. Vd.44,pp. 745-756.2010. 0092-8615/2010
Printed in the USA.All rights reserved.Copyright 02010 Drug InformationAssociation. Inc.
Submittedforpublication:March 25,2010
Accepted forpublication:July 19,2010by guest on June 4, 2015dij.sagepub.comDownloaded from](https://image.slidesharecdn.com/ab9812f8-eaeb-4a8c-997e-a740ad487550-150605004359-lva1-app6892/75/Risk-based-SDV-Approaches-Pros-Cons-2010-1-2048.jpg)
![Tantsyura et al.746 R E G U L A T O R Y A F F A I R S
mation the study subject did not report or mis-
reported, data the subject reported but site
staff considered of no consequence, errors in
the data that the monitor did not review, and
fraud. Furthermore, "it [is] also observed that
current monitoring processes often involve
time- and labor-intensive techniques that are
not actuallyrequired by regulations"(4). There-
fore,it is not unreasonable to assumethat when
a focused SDV approach is used, there will be
an increase in data quality since the site moni-
tors will be able to focustheir attention on criti-
cal data elements that are vital for the analysis
of the study data rather than being box check-
ers. As a result, regulatorsand the industry alike
have started looking at alternative SDV ap-
proaches. This article summarizescurrent alter-
native approaches to SDV and:
1.Critically evaluates the relative value of verifica-
tion against source documents and records by
data category,and evaluatesthe risksof not source
verifying.
2. Evaluates the FDA-supported risk-based approach
3.Identifies alternative approaches to 100%SDV
and evaluates the advantages, disadvantages, and
risks associated with each approach.
4. Providesa proposal on how to modify the SDVpro-
cess without undermining the validityand integri-
ty of the clinical trial data.
to SDV.
LITERATURE REVIEW
A recent literature review found only 21 print
sources in which monitoring objectivesfor clin-
ical trials were mentioned (4). None of these
publications provided a standard for reduced
SDV.However, reduction in SDV is encouraged
where it is solidly grounded on a risk-basedap-
proach and other scientificprinciples.
EXTENTOFMONITORING
Khosla et al. (5)cite "Britishstandard specifica-
tions for SDV,"which are based on a random
sampleof 65 data points from 100CRFs for 100
patients. If fewer than three errors are identi-
fied,the data are accepted. If three or more er-
rors are identified, then the batch is rejected
and the data are verified in greater detail.
FDA (6)providesthe followingguidance:
From a scientific standpoint ... it is recognized
that the extent of documentation necessary de-
pends on the particular study, the types of data
involved, and the other evidence available to sup-
port the claim.Therefore,the Agency is able to ac-
cept different levels of documentation of data
quality, as long as the adequacy of the scientific
evidence can be assured.. ..
Industry-sponsored studies typically use exten-
sive on-site and central monitoring and auditing
procedures to assure data quality. Studies sup-
ported by other sponsors may employ less strin-
gent procedures and may use no on-site monitor-
ing at all. An International Conference on
Harmonization guideline on good clinical prac-
tices, recently accepted internationally, empha-
sizesthat the extent of monitoring in a trial should
be based on trial-specific factors (eg, design,
complexity,size, and type of study outcome mea-
sures) and that different degrees of on-site moni-
toring can be appropriate. In recent years, many
credible and valuable studies conducted by gov-
ernment or independent study groups, often with
important mortality outcomes, had very little on-
site monitoring. These studies have addressed
quality control in other ways, such as by close
control and review of documentation and exten-
sive guidance and planning efforts with investiga-
tors.
The FDA concept paper "Quality in FDA-Regu-
lated Clinical Research"(7)suggestslookingfor
alternative models for on-site monitoring:
For commercial studies done to develop pharma-
ceutical products, on site monitoring of perfor-
mance has become the rule, with sponsors visiting
essentially all sites every 4 to 8 weeks to assure
performance. This is costly,of course, and while it
contributesto aspects of study quality,it is not re-
ally practicable for large outcome trials, and has
failed to detect real fraud.As interest in largetrials
grows, it is becoming apparent that the industry
model is not feasible, without modification, for
those trials.
by guest on June 4, 2015dij.sagepub.comDownloaded from](https://image.slidesharecdn.com/ab9812f8-eaeb-4a8c-997e-a740ad487550-150605004359-lva1-app6892/85/Risk-based-SDV-Approaches-Pros-Cons-2010-2-320.jpg)

![752 R E G U L A T O R Y A F F A I R S
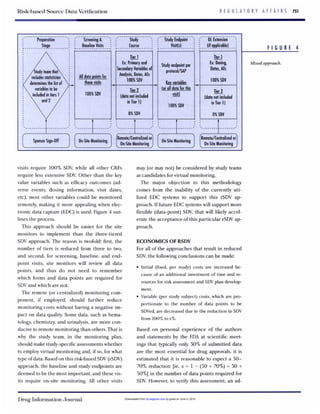
F I G U R E 5
Break-evenanalysis.
Tantsy~uaet al.
1,200
3 1
r E 800
B E
n B
zcs=P
> > 400
852
200
>
-A- Total Cost (100%SDVI
-x- Total Cost (reducedSDVI
600
- =
gg
-e
s
Unitsof quantity
(eg, # of subiectsper study x 10)
ditional analysis is needed. For example, a sam-
ple of studies can be analyzed to determine the
potential time and resource savings using the
approaches described above.
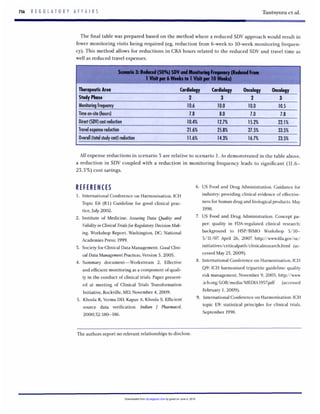
Figure 5 represents a hypothetical scenario
when the fixed costs (associated with the pre-
planning of the site monitoring) are doubled
and the variable costs are 30%(ie. reduction by
x = 70%)of the original level as a result of the
reduction of the amount of SDV. The triangles
represent the costs associated with classic
(100%)SDV and the stars represent the costs
associated with the reduced (to 30%)SDV for
the same clinical trial (ie, the slope of the high-
er line is 30%of the slope of the lower line). The
distance between the two lines represents the
cost savings associated with risk-based SDV.
Figure 5 shows that cost efficiencies associat-
ed with reduced SDV are unlikely in small
(phase 1/2a) studies due to the additional
(fixed) costs that offset the reduction in the
variable costs. There may be value in the plan-
ning and setup for some small studies if the
planning and setup can be applied to a whole
class of studies that has the same design and
collects the same kinds of data (eg,bioavailabil-
ity or bioequivalence studies). The most signifi-
cant savings can be gained in large phase 2b/3
studies when the additional (fixed) cost in-
crease is insignificant relative to the reduction
ofthe variable component of the costs.
A number of exploratory analyses were con-
duced to estimate the potential cost savings of-
fered by risk-based SDV approaches based on
estimating time and costs associated with dif-
ferent clinical study activities (see the appendix
for more details). The hypothetical examples
below summarize the cost savings based on the
assumption of 50%SDV and associated reduc-
tion in monitoring frequency from 6- to 10-
week periods. The examples provided were de-
veloped based on average project parameters
gathered from a sample of studies (eg, number
of patients, sites, serious adverse event [SAE]
rate, enrollment period, etc) in the cardiology
and oncology therapeutic areas. Baselinevalues
utilizing standard SDV were developed to allow
for comparison for the phase 2 and phase 3
studies. A second set of data was prepared based
on the proposed method where a reduced SDV
method would result in fewer monitoring visits
being required (eg, reduction from 6-week
monitoring frequency to 10-week).This method
allows for reductions in clinical research associ-
ate (CRA)hours related to the reduced SDV and
travel time as well as reduced travel expenses. In
addition, the followingassumptions were used
EDCstudy.
USsites only.
100%SDV assumed approximately 6 minutes per
page review time (for cardiology) and 11 minutes
per page for oncology.
by guest on June 4, 2015dij.sagepub.comDownloaded from](https://image.slidesharecdn.com/ab9812f8-eaeb-4a8c-997e-a740ad487550-150605004359-lva1-app6892/85/Risk-based-SDV-Approaches-Pros-Cons-2010-8-320.jpg)