The document discusses Pearson's product-moment correlation coefficient (r) and how it is used to examine the relationship between two variables measured at the interval or ratio level. It provides information on how to interpret the strength (weak, moderate, strong) and direction (positive, negative) of relationships based on the r value. It also describes how to calculate the percentage of variance explained from the r value to understand the practical significance of relationships.
EXERCISE 24 UNDERSTANDING PEARSONS r, EFFECT SIZE, AND PERCEN.docxSANSKAR20
EXERCISE 24 UNDERSTANDING PEARSON'S r, EFFECT SIZE, AND PERCENTAGE OF VARIANCE EXPLAINED
STATISTICAL TECHNIQUE IN REVIEW
Review the statistical information regarding Pearson's Product-Moment Correlation Coefficient presented in Exercise 23. In this exercise, you
will need to apply that information to gain an understanding of interpreting Pearson r results presented in a mirror-image table. A mirror-image
table, as the name implies, has the same labels in the same order for both the x- and y-axes. Frequently, letters or numbers are assigned to each
label, and only the letter or number designator is used to label one of the axes. To find the r value for a pair of variables, look both along the
labeled or y-axis in the table below and then along the x-axis, using the letter designator assigned to the variable you want to know the
relationship for, and find the cell in the table with the r value. Below is an example of a mirror-image table that compares hours of class attended,
hours studying, and final grade as a percentage. The results in the table are intended as an example of a mirror-image table and are not based on
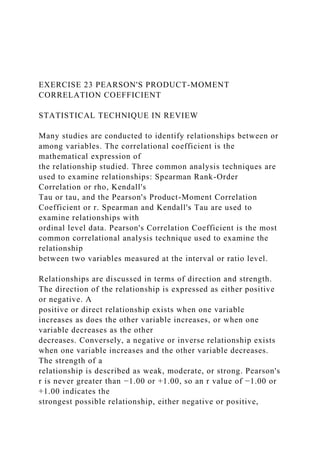
research. If you were asked to identify the r value for the relationship between hours of class attended and the final grade as a percentage, the
answer would be r = 0.72, and between hours studying and final grade as a percentage, the answer would be r = 0.78. The dash (–) marks located
on the diagonal line of the table represent the variable's correlation with itself, which is always a perfect positive correlation or r = +1.00.
VARIABLES A B C
A. Hours of class attended – 0.44 0.72
B. Hours studying 0.44 – 0.78
C. Final grade as a percentage 0.72 0.78 –
Effect Size of an r Value
In determining the strength of a relationship, remember that a weak relationship is r < 0.3 or r < −0.3, a moderate relationship is r = 0.3 to 0.5 or
−0.3 to −0.5, and a strong relationship is r > 0.5 or > −0.5. The r value is equal to the effect size or the strength of a relationship. In the table
above, the relationship between hours of class attended and hours of studying is r = 0.44 and the effect size = 0.44. The effect size is used in
power analysis to determine sample size for future studies. The strength of the effect size is the same as that for the r values, with a weak effect
size < 0.3 or < −0.3, a moderate effect size 0.3 to 0.5 or −0.3 to −0.5, and a strong effect size > 0.5 or > −0.5. The smaller the effect size, the
greater the sample size needed to detect significant relationships in future studies. Thus the larger the effect size, the smaller the sample size that
is needed to determine significant relationships. The determination of study sample sizes with power analysis is presented in Exercise 12.
173
174
Percentage of Variance Explained in a Relationship
Percentage of variance explained is a calculation based on a Pearson's r value. The purpose for calculating the percentage of variance expla ...
EXERCISE 24 UNDERSTANDING PEARSONS r, EFFECT SIZE, AND PERCEN.docxSANSKAR20
EXERCISE 24 UNDERSTANDING PEARSON'S r, EFFECT SIZE, AND PERCENTAGE OF VARIANCE EXPLAINED
STATISTICAL TECHNIQUE IN REVIEW
Review the statistical information regarding Pearson's Product-Moment Correlation Coefficient presented in Exercise 23. In this exercise, you
will need to apply that information to gain an understanding of interpreting Pearson r results presented in a mirror-image table. A mirror-image
table, as the name implies, has the same labels in the same order for both the x- and y-axes. Frequently, letters or numbers are assigned to each
label, and only the letter or number designator is used to label one of the axes. To find the r value for a pair of variables, look both along the
labeled or y-axis in the table below and then along the x-axis, using the letter designator assigned to the variable you want to know the
relationship for, and find the cell in the table with the r value. Below is an example of a mirror-image table that compares hours of class attended,
hours studying, and final grade as a percentage. The results in the table are intended as an example of a mirror-image table and are not based on
research. If you were asked to identify the r value for the relationship between hours of class attended and the final grade as a percentage, the
answer would be r = 0.72, and between hours studying and final grade as a percentage, the answer would be r = 0.78. The dash (–) marks located
on the diagonal line of the table represent the variable's correlation with itself, which is always a perfect positive correlation or r = +1.00.
VARIABLES A B C
A. Hours of class attended – 0.44 0.72
B. Hours studying 0.44 – 0.78
C. Final grade as a percentage 0.72 0.78 –
Effect Size of an r Value
In determining the strength of a relationship, remember that a weak relationship is r < 0.3 or r < −0.3, a moderate relationship is r = 0.3 to 0.5 or
−0.3 to −0.5, and a strong relationship is r > 0.5 or > −0.5. The r value is equal to the effect size or the strength of a relationship. In the table
above, the relationship between hours of class attended and hours of studying is r = 0.44 and the effect size = 0.44. The effect size is used in
power analysis to determine sample size for future studies. The strength of the effect size is the same as that for the r values, with a weak effect
size < 0.3 or < −0.3, a moderate effect size 0.3 to 0.5 or −0.3 to −0.5, and a strong effect size > 0.5 or > −0.5. The smaller the effect size, the
greater the sample size needed to detect significant relationships in future studies. Thus the larger the effect size, the smaller the sample size that
is needed to determine significant relationships. The determination of study sample sizes with power analysis is presented in Exercise 12.
173
174
Percentage of Variance Explained in a Relationship
Percentage of variance explained is a calculation based on a Pearson's r value. The purpose for calculating the percentage of variance expla ...
Data Processing and Statistical Treatment: Spreads and CorrelationJanet Penilla
A hyperlinked presentation. The objectives of the topic were written. The presentation was started with the variance and then the standard deviation provided with examples. It also answers on when to use the sample standard deviation and the population standard deviation or what type of data should we use when we calculate a standard deviation. The presentation also includes Correlations and other correlation techniques(Pearson-product moment correlation; Spearman - rank order correlation coefficient; t-test for correlation).
This presentation covered the following topics:
1. Definition of Correlation and Regression
2. Meaning of Correlation and Regression
3. Types of Correlation and Regression
4. Karl Pearson's methods of correlation
5. Bivariate Grouped data method
6. Spearman's Rank correlation Method
7. Scattered diagram method
8. Interpretation of correlation coefficient
9. Lines of Regression
10. regression Equations
11. Difference between correlation and regression
12. Related examples
Assessment 2 ContextIn many data analyses, it is desirable.docxfestockton
Assessment 2 Context
In many data analyses, it is desirable to compute a coefficient of association. Coefficients of association are quantitative measures of the amount of relationship between two variables. Ultimately, most techniques can be reduced to a coefficient of association and expressed as the amount of relationship between the variables in the analysis. There are many types of coefficients of association. They express the mathematical association in different ways, usually based on assumptions about the data. The most common coefficient of association you will encounter is the Pearson product-moment correlation coefficient (symbolized as the italicized r), and it is the only coefficient of association that can safely be referred to as simply the "correlation coefficient". It is common enough so that if no other information is provided, it is reasonable to assume that is what is meant.
Correlation coefficients are numbers that give information about the strength of relationship between two variables, such as two different test scores from a sample of participants. The coefficient ranges from -1 through +1. Coefficients between 0 and +1 indicate a positive relationship between the two scores, such as high scores on one test tending to come from people with high scores on the second. The other possible relationship, which is every bit as useful, is a negative correlation between -1 and 0. A negative correlation possesses no less predictive power between the two scores. The difference is that high scores on one measure are associated with low scores on the other.
An example of the kinds of measures that might correlate negatively is absences and grades. People with higher absences will be expected to have lower grades. When a correlation is said to be significant, it can be shown that the correlation is significantly different form zero in the population. A correlation of zero means no relationship between variables. A correlation other than zero means the variables are related. As the coefficient gets further from zero (toward +1 or -1), the relationship becomes stronger.Interpreting Correlation: Magnitude and Sign
Interpreting a Pearson's correlation coefficient (rXY) requires an understanding of two concepts:
· Magnitude.
· Sign (+/-).
The magnitude refers to the strength of the linear relationship between Variable X and Variable
The rXY ranges in values from -1.00 to +1.00. To determine magnitude, ignore the sign of the correlation, and the absolute value of rXY indicates the extent to which Variable X and Variable Y are linearly related. For correlations close to 0, there is no linear relationship. As the correlation approaches either -1.00 or +1.00, the magnitude of the correlation increases. Therefore, for example, the magnitude of r = -.65 is greater than the magnitude of r = +.25 (|.65| > |.25|).
In contrast to magnitude, the sign of a non-zero correlation is either negative or positive.
These labels are not interpreted ...
Assessment 2 ContextIn many data analyses, it is desirable.docxgalerussel59292
Assessment 2 Context
In many data analyses, it is desirable to compute a coefficient of association. Coefficients of association are quantitative measures of the amount of relationship between two variables. Ultimately, most techniques can be reduced to a coefficient of association and expressed as the amount of relationship between the variables in the analysis. There are many types of coefficients of association. They express the mathematical association in different ways, usually based on assumptions about the data. The most common coefficient of association you will encounter is the Pearson product-moment correlation coefficient (symbolized as the italicized r), and it is the only coefficient of association that can safely be referred to as simply the "correlation coefficient". It is common enough so that if no other information is provided, it is reasonable to assume that is what is meant.
Correlation coefficients are numbers that give information about the strength of relationship between two variables, such as two different test scores from a sample of participants. The coefficient ranges from -1 through +1. Coefficients between 0 and +1 indicate a positive relationship between the two scores, such as high scores on one test tending to come from people with high scores on the second. The other possible relationship, which is every bit as useful, is a negative correlation between -1 and 0. A negative correlation possesses no less predictive power between the two scores. The difference is that high scores on one measure are associated with low scores on the other.
An example of the kinds of measures that might correlate negatively is absences and grades. People with higher absences will be expected to have lower grades. When a correlation is said to be significant, it can be shown that the correlation is significantly different form zero in the population. A correlation of zero means no relationship between variables. A correlation other than zero means the variables are related. As the coefficient gets further from zero (toward +1 or -1), the relationship becomes stronger.Interpreting Correlation: Magnitude and Sign
Interpreting a Pearson's correlation coefficient (rXY) requires an understanding of two concepts:
· Magnitude.
· Sign (+/-).
The magnitude refers to the strength of the linear relationship between Variable X and Variable
The rXY ranges in values from -1.00 to +1.00. To determine magnitude, ignore the sign of the correlation, and the absolute value of rXY indicates the extent to which Variable X and Variable Y are linearly related. For correlations close to 0, there is no linear relationship. As the correlation approaches either -1.00 or +1.00, the magnitude of the correlation increases. Therefore, for example, the magnitude of r = -.65 is greater than the magnitude of r = +.25 (|.65| > |.25|).
In contrast to magnitude, the sign of a non-zero correlation is either negative or positive.
These labels are not interpreted .
Exploring Online Consumer Behaviors
John A. Smith and Jane L. Doe
Liberty University
References
Janda, S. (2008). Does gender moderate the effect of online concerns on purchase likelihood? Journal of Internet Commerce, 7(3), 339-358. doi:10.1080/15332860802250401
Jeon, S., Crutsinger, C., & Kim, H. (2008). Exploring online auction behaviors and motivations. Journal of Family and Consumer Sciences, 100(2), 31-40. Retrieved by http://search.proquest.com.ezproxy.liberty.edu:2048/docview/218160218
Koyuncu, C., & Lien, D. (2003). E-commerce and consumer's purchasing behaviour. Applied Economics, 35(6), 721. Retrieved from http://go.galegroup.com.ezproxy.liberty.edu:2048/ps/i.do?id=GALE%7CA102272684&v=2.1&u=vic_liberty&it=r&p=AONE&sw=w
Kukar-Kinney,M.,Monroe, K.B.,Ridgway,N.M. (2008). The relationship between consumers’ tendencies to buy compulsively and their motivations to shop and buy on the internet. Journal of Retailing: Consumer Behavior and Retailing, 85(3), 298-307. Retrieved from http://dx.doi.org. ezproxy.liberty.edu: 2048/10.1016/j.jretai.2009.05.002
Stibel, J. (2005). Mental models and online consumer behaviour. Behaviour & Information Technology, 24(2), 147-150. doi:10.1080/01449290512331321901
Vazquez,D., & Xu,X.(2009). Investigation linkages between online purchase behavior variables. International Journal of Retail & Distribution Management, 37(5), 408-419. doi:10.1108/09590550910954900
Abstract Comment by user: Double space between all lines of the manuscript. This includes the elimination of any extra spacing before or after the paragraph (APA Manual 5.03). The default setting in Microsoft Word is to add extra spacing after paragraphs. You can change this setting under the page layout tab in Microsoft Word.
Internet usage has skyrocketed in the past few decades, along with this increase comes the increase in internet shopping by consumers. This research examines the behaviors, motivations, and attitudes of this new form of consumer entity. Online consumer behavior has been studied for over 20 years and will undoubtedly be the source of many future researches as internet consumerism expands. This paper will examine the following research questions: (1) How do factors previously researched affect the online purchasing behavior of consumers and (2) what are the significant consumer behaviors both positive and negative that affect internet consumerism? By identifying these factors and variables, new strategies can be formulated and both consumer and supplier can gain knowledge and understanding of behaviors which exist. The purpose of this research paper is to integrate the varied research information together and draw coherent linkages to how consumer thoughts, attitudes and motivational behavior affect online buying, thus building a broader framework of analysis in which to build upon. Comment by user:
APA style uses one inch margins. Paragraphs should be indented five to seven spaces (about 1/2 inch ...
More Related Content
Similar to EXERCISE 23 PEARSONS PRODUCT-MOMENT CORRELATION COEFFICIENT .docx
Data Processing and Statistical Treatment: Spreads and CorrelationJanet Penilla
A hyperlinked presentation. The objectives of the topic were written. The presentation was started with the variance and then the standard deviation provided with examples. It also answers on when to use the sample standard deviation and the population standard deviation or what type of data should we use when we calculate a standard deviation. The presentation also includes Correlations and other correlation techniques(Pearson-product moment correlation; Spearman - rank order correlation coefficient; t-test for correlation).
This presentation covered the following topics:
1. Definition of Correlation and Regression
2. Meaning of Correlation and Regression
3. Types of Correlation and Regression
4. Karl Pearson's methods of correlation
5. Bivariate Grouped data method
6. Spearman's Rank correlation Method
7. Scattered diagram method
8. Interpretation of correlation coefficient
9. Lines of Regression
10. regression Equations
11. Difference between correlation and regression
12. Related examples
Assessment 2 ContextIn many data analyses, it is desirable.docxfestockton
Assessment 2 Context
In many data analyses, it is desirable to compute a coefficient of association. Coefficients of association are quantitative measures of the amount of relationship between two variables. Ultimately, most techniques can be reduced to a coefficient of association and expressed as the amount of relationship between the variables in the analysis. There are many types of coefficients of association. They express the mathematical association in different ways, usually based on assumptions about the data. The most common coefficient of association you will encounter is the Pearson product-moment correlation coefficient (symbolized as the italicized r), and it is the only coefficient of association that can safely be referred to as simply the "correlation coefficient". It is common enough so that if no other information is provided, it is reasonable to assume that is what is meant.
Correlation coefficients are numbers that give information about the strength of relationship between two variables, such as two different test scores from a sample of participants. The coefficient ranges from -1 through +1. Coefficients between 0 and +1 indicate a positive relationship between the two scores, such as high scores on one test tending to come from people with high scores on the second. The other possible relationship, which is every bit as useful, is a negative correlation between -1 and 0. A negative correlation possesses no less predictive power between the two scores. The difference is that high scores on one measure are associated with low scores on the other.
An example of the kinds of measures that might correlate negatively is absences and grades. People with higher absences will be expected to have lower grades. When a correlation is said to be significant, it can be shown that the correlation is significantly different form zero in the population. A correlation of zero means no relationship between variables. A correlation other than zero means the variables are related. As the coefficient gets further from zero (toward +1 or -1), the relationship becomes stronger.Interpreting Correlation: Magnitude and Sign
Interpreting a Pearson's correlation coefficient (rXY) requires an understanding of two concepts:
· Magnitude.
· Sign (+/-).
The magnitude refers to the strength of the linear relationship between Variable X and Variable
The rXY ranges in values from -1.00 to +1.00. To determine magnitude, ignore the sign of the correlation, and the absolute value of rXY indicates the extent to which Variable X and Variable Y are linearly related. For correlations close to 0, there is no linear relationship. As the correlation approaches either -1.00 or +1.00, the magnitude of the correlation increases. Therefore, for example, the magnitude of r = -.65 is greater than the magnitude of r = +.25 (|.65| > |.25|).
In contrast to magnitude, the sign of a non-zero correlation is either negative or positive.
These labels are not interpreted ...
Assessment 2 ContextIn many data analyses, it is desirable.docxgalerussel59292
Assessment 2 Context
In many data analyses, it is desirable to compute a coefficient of association. Coefficients of association are quantitative measures of the amount of relationship between two variables. Ultimately, most techniques can be reduced to a coefficient of association and expressed as the amount of relationship between the variables in the analysis. There are many types of coefficients of association. They express the mathematical association in different ways, usually based on assumptions about the data. The most common coefficient of association you will encounter is the Pearson product-moment correlation coefficient (symbolized as the italicized r), and it is the only coefficient of association that can safely be referred to as simply the "correlation coefficient". It is common enough so that if no other information is provided, it is reasonable to assume that is what is meant.
Correlation coefficients are numbers that give information about the strength of relationship between two variables, such as two different test scores from a sample of participants. The coefficient ranges from -1 through +1. Coefficients between 0 and +1 indicate a positive relationship between the two scores, such as high scores on one test tending to come from people with high scores on the second. The other possible relationship, which is every bit as useful, is a negative correlation between -1 and 0. A negative correlation possesses no less predictive power between the two scores. The difference is that high scores on one measure are associated with low scores on the other.
An example of the kinds of measures that might correlate negatively is absences and grades. People with higher absences will be expected to have lower grades. When a correlation is said to be significant, it can be shown that the correlation is significantly different form zero in the population. A correlation of zero means no relationship between variables. A correlation other than zero means the variables are related. As the coefficient gets further from zero (toward +1 or -1), the relationship becomes stronger.Interpreting Correlation: Magnitude and Sign
Interpreting a Pearson's correlation coefficient (rXY) requires an understanding of two concepts:
· Magnitude.
· Sign (+/-).
The magnitude refers to the strength of the linear relationship between Variable X and Variable
The rXY ranges in values from -1.00 to +1.00. To determine magnitude, ignore the sign of the correlation, and the absolute value of rXY indicates the extent to which Variable X and Variable Y are linearly related. For correlations close to 0, there is no linear relationship. As the correlation approaches either -1.00 or +1.00, the magnitude of the correlation increases. Therefore, for example, the magnitude of r = -.65 is greater than the magnitude of r = +.25 (|.65| > |.25|).
In contrast to magnitude, the sign of a non-zero correlation is either negative or positive.
These labels are not interpreted .
Similar to EXERCISE 23 PEARSONS PRODUCT-MOMENT CORRELATION COEFFICIENT .docx (20)
Exploring Online Consumer Behaviors
John A. Smith and Jane L. Doe
Liberty University
References
Janda, S. (2008). Does gender moderate the effect of online concerns on purchase likelihood? Journal of Internet Commerce, 7(3), 339-358. doi:10.1080/15332860802250401
Jeon, S., Crutsinger, C., & Kim, H. (2008). Exploring online auction behaviors and motivations. Journal of Family and Consumer Sciences, 100(2), 31-40. Retrieved by http://search.proquest.com.ezproxy.liberty.edu:2048/docview/218160218
Koyuncu, C., & Lien, D. (2003). E-commerce and consumer's purchasing behaviour. Applied Economics, 35(6), 721. Retrieved from http://go.galegroup.com.ezproxy.liberty.edu:2048/ps/i.do?id=GALE%7CA102272684&v=2.1&u=vic_liberty&it=r&p=AONE&sw=w
Kukar-Kinney,M.,Monroe, K.B.,Ridgway,N.M. (2008). The relationship between consumers’ tendencies to buy compulsively and their motivations to shop and buy on the internet. Journal of Retailing: Consumer Behavior and Retailing, 85(3), 298-307. Retrieved from http://dx.doi.org. ezproxy.liberty.edu: 2048/10.1016/j.jretai.2009.05.002
Stibel, J. (2005). Mental models and online consumer behaviour. Behaviour & Information Technology, 24(2), 147-150. doi:10.1080/01449290512331321901
Vazquez,D., & Xu,X.(2009). Investigation linkages between online purchase behavior variables. International Journal of Retail & Distribution Management, 37(5), 408-419. doi:10.1108/09590550910954900
Abstract Comment by user: Double space between all lines of the manuscript. This includes the elimination of any extra spacing before or after the paragraph (APA Manual 5.03). The default setting in Microsoft Word is to add extra spacing after paragraphs. You can change this setting under the page layout tab in Microsoft Word.
Internet usage has skyrocketed in the past few decades, along with this increase comes the increase in internet shopping by consumers. This research examines the behaviors, motivations, and attitudes of this new form of consumer entity. Online consumer behavior has been studied for over 20 years and will undoubtedly be the source of many future researches as internet consumerism expands. This paper will examine the following research questions: (1) How do factors previously researched affect the online purchasing behavior of consumers and (2) what are the significant consumer behaviors both positive and negative that affect internet consumerism? By identifying these factors and variables, new strategies can be formulated and both consumer and supplier can gain knowledge and understanding of behaviors which exist. The purpose of this research paper is to integrate the varied research information together and draw coherent linkages to how consumer thoughts, attitudes and motivational behavior affect online buying, thus building a broader framework of analysis in which to build upon. Comment by user:
APA style uses one inch margins. Paragraphs should be indented five to seven spaces (about 1/2 inch ...
External and Internal Analysis 8Extern.docxgitagrimston
External and Internal Analysis 8
External and Internal Environmental Analysis
STR/581
Professor Alfonso Rodriguez
July 30, 2014
Sheila Medina
Introduction
Coffee has become an integral part of the lives of numerous people. In 1971, Starbucks coffee opened its first coffee shop in the Pike Place Market in Seattle, Washington. Now, according to research “Starbucks Corporation is the leading retailer, roaster and brand of specialty coffee in the world, with more than 6,000 retail locations in North America, Latin America, Europe, the Middle East and the Pacific Rim” (www.investor.starbucks.com). Starbucks aims to be the consumer’s favorite coffee shop and to achieve this the company focused on customer satisfaction as well as company advancement. Therefore, it is important to act based on what is written in Starbucks mission, value and vision statement, “To inspire and nurture the human spirit-one person, one cup, and one neighborhood at a time” (www.starbucks.com).
A review of Starbucks financial reports has identified an increase in revenue over the past few years. However, this increase in revenue doesn’t account for the increase in profits. The profit increase is not as high as it could be due to external factors such as other coffee shops and the increase in amount of competition. This report aims to identify the different internal and external environment factors attributing to the changes in Starbucks external environment by utilizing several different analyses.
SWOT Analysis
Strengths
Starbucks possesses several main strengths including their high visibility being located in high traffic areas, quality of service and products and their established brand loyalty. Starbucks remains an established leader being the number one known coffee house in the world while possessing a competent workforce, providing quality service, and continuing financial soundness. They also are known for their strong internal and external relationships with their suppliers.
Weakness
Weaknesses that Starbucks must address include: Product affordability and pricing, coffee beans price is the major influence over the firms profits, maintaining the positive public opinion of their products, avoiding any negative publicity, and remaining connected to their customers. Starbucks must also consider the fact they have expanded domestically and internationally resulting in saturation of the markets. They are also a non-smoking facility alienating some customers from purchasing coffee or other products from their store.
Opportunities
Opportunities include the ability for Starbucks to enter into different and new markets,
partnership opportunities with businesses, growing acceptance and customer satisfaction, and increase different product offerings. Starbucks must strive to continue expanding their products and food service to remain competitive and reach other consumers. Another option would be for Starbucks to allow consumers to order t ...
Exploring Music Concert Paper Guidelines Instructions.docxgitagrimston
Exploring Music
Concert Paper Guidelines
Instructions
1) Choose. Pick a classical music concert from the list provided on Blackboard. Sign up and buy tickets.
2) Research. Using reputable sources, learn about the composers and music featured at the concert. I
recommend searching Google for program notes from major orchestras.
3) Write. Write a typed, double-spaced, 2 -3 page research paper, including properly formatted citations
using APA, MLA, or Chicago style. This must be done before you attend the concert.
4) Cite. Cite your sources using in-text citations. Include a works cited list with full citations using MLA,
APA, or Chicago. If you don’t know how to do this, read this.
5) Submit. Turn in your research paper under the “concerts” tab in Blackboard 2 days before the concert
date. It will be checked for plagiarism.
6) Go. Plan ahead. Dress appropriately. Get to your concert on time. If you’re late, you might not get in.
7) Listen. Use active listening during the concert. (See “at the concert” below.)
8) Smile. Take a selfie or have someone take a picture of you that clearly shows that you were at the
concert. In the lobby during intermission is a good time for this! Save your ticket and program.
9) Interview. Talk to someone at the concert. Ask them why they came and what they thought.
10) Write. Add a “part two” to your research paper. This second part should be a typed, double-spaced, 2-3
page reaction paper to your concert. Talk about what you thought, show off your active listening skills,
and include the results of your interview.
11) Add. Add your concert picture to the last page of your paper. If you don’t have this, I can’t accept the
paper for credit. Staple your ticket to your paper.
12) Submit. Turn in a hard copy of your complete paper (research part AND reaction part with picture and
ticket) in class on or before the due dates indicated.
At The Concert: Active Listening
Choose one piece from your concert to analyze. Identify the meter, texture, and two other musical elements.
Reflect on the music. What emotions do you get from that piece? Does it spark anything in your imagination?
Does it remind you of anything? What is it about the music that creates those feelings and ideas?
Interview a fellow attendee after the show or during intermission. Ask why they came and what they thought.
WARNING
DO NOT OVER-USE DIRECT QUOTATIONS. If your paper has more than 50 words that are directly quoted, I will
return the paper to you, ungraded. Quotes can be useful, but you have to know when and how to use them!
Blend your quotes within your narrative. Paraphrase when appropriate. Read this.
DO NOT PLAGIARIZE. All sources, even if they are only alluded to or paraphrased, must be cited.
http://guides.temple.edu/c.php?g=77953&p=528593
http://www.temple.edu/writingctr/support-for-writers/documents/BecominganEffectiveWriterinCollege.pdf
http://www.bibme. ...
Expo 12 Discussion QuestionsThink about the cooperative learni.docxgitagrimston
Expo 12 Discussion Questions
Think about the cooperative learning lesson plan you have developed for studying Crystal Growing and the Rock Cycle. What problems do you envision occurring? Select the most problematic issue and elaborate on it on the discussion board.
Module 5 Activity
Consider the lab you have just completed, Experiment 12, and the processes you went through. Now, assume this experiment were to be conducted in your classroom in groups of four. Create an age appropriate lesson plan in which you conduct this experiment using cooperative learning, while still maintaining the integrity of the 5E Model. Submit your lesson plan as a word document.
Hands-On Labs SM-1 Lab Manual
91
EXPERIMENT 12:
Crystal Growing and the Rock Cycle
Note: Part One of this lab should be performed at least 10 days before your report due date.
Read the entire experiment and organize time, materials, and work space before beginning.
Remember to review the safety sections and wear goggles when appropriate.
Objectives: To grow synthetic crystals from a supersaturated solution by evaporation,
To measure the interfacial angles of minerals,
To make sugar “glass,”
To understand the role of evaporation in mineral growth, and
To determine the dissolution point of certain crystals.
Materials: Student Provides: Pan, small
Spoon or blunt knife
Cup saucer
Stovetop burner
Refrigerator
50 g sugar
From LabPaq: Tweezers
Protractor
Ruler
Magnifying hand lens
Digital scale
100-mL Beaker
3 Petri dishes, large
Thermometer
Set of 18 numbered minerals
Igneous rock sample #19
Sedimentary rock sample #36
Metamorphic rock sample #47
Epsom salt: Magnesium Sulfate Heptahydrate,
MgSO4 · 7H2O
Alum: Aluminum Potassium Sulfate Dodecahydrate,
KAI(SO4) 2 · 12 H2O
Discussion and Review: The textbook definition of a mineral is “a homogeneous,
naturally occurring, solid substance with a definable chemical composition and an
internal structure characterized by an orderly arrangement of atoms in a crystalline
structure” (from Earth; Portrait of a Planet; Stephen Marshak (Norton, 2005).
A crystal grown in a lab is not a true mineral since it did not form by geologic processes.
However, crystals grown in a lab are virtually identical to true minerals in many other
Hands-On Labs SM-1 Lab Manual
92
aspects: they are solid, inorganic, homogeneous, and have a definite chemical
composition and an ordered structure.
By growing crystals in a laboratory setting you will be able to investigate the different
properties that define a mineral. In addition, growing synthetic minerals can offer insight
into the factors that affect the crystal growing process in a true geologic setting. By
“watching” your crystals grow, you’ll be able to better understand how crystal faces
develop in rocks and what influences them, plus you won’t ...
ExplanationMaster Honey is a franchise-style company that sel.docxgitagrimston
Explanation:
Master Honey is a franchise-style company that sells a variety of products derived from raw honey harvested from both local and international bee-farms, called apiaries. Our company was established in 1988 by its founder, Sergio Saladrigas, back when honey was a booming industry, and its business was conducted based on quality rather than quantity. With this philosophy in mind, Master Honey has created a culture of good quality work with competitive pricing. Since its creation, Master Honey has had a successful expansion throughout most of Central and South-Florida in the form of two different types of establishments for retail selling that have made the brand differentiate itself from the competition:
For rather big retail space, Master Honey developed a trademarked concept for a retail-store called “Honey Caves”. Usually placed in malls and around touristic areas, Honey Caves are stores of 1,000-1,500 squared feet that offer the whole catalog of Mater Honey’s products. The product catalog includes:
Products
Types
Large size
Medium size
Small size
Artisanal honey:
Local Honey:
Tupelo
9$
5$
3$
Orange blossom
8$
4$
2$
Red Pepper
7$
4$
2$
Golden Berry
7$
4$
2$
Wildflower
6$
3$
2$
International Honey:
Blue Gum
11$
6$
4$
Beech Wood
10$
5$
3$
Acai
12$
8$
5$
Acacia
12$
8$
5$
Manuka
11$
6$
4$
Honey Blends for:
Tea, Chees or BBQ
12$
8$
5$
Soaps for:
Face (anti-acne)
-
10$
6$
Body
9$
5$
-
Hands
-
9$
5$
Lotions:
Face (anti-age)
-
15$
10$
Body
-
10$
7$
Other Products:
Shampoo
15$
11$
7$
Conditioner
15$
11$
7$
The honey caves have a specific and trademarked design that makes customers feel “like a bee in a hive”. The temperature is set at a low 72 degrees Fahrenheit with low light, and with a constant and subtle bee sound. In addition, the shelves are designed to look like a hive, with a series of hexagonally shaped boxes that designed to be piled together. This gives the shop managers freedom to change the setting of the store with ease and freedom of choice. Furthermore, the stores offer samples from all of our different products so the customers can see, feel, smell and taste the quality that differentiates our product. Also, every single one of our franchised Honey Caves has a large table in the middle of the store in a hexagonal shape displaying many large and artisanal-looking bottles that carry all of the honey types that we offer (that way, if a certain type of honey is not in store, it can still be shipped). The first bottle on each line contains a pump from which the customer can serve previously measured quantities in a small sample cup, and taste the differences in flavor and texture among all honeys from different flowers. The same technique is used with our soaps by providing 3 to 7 sinks for our customers to try the soaps, and realize its unique smell and smoothness. This type of store look like:
For the smaller stores, of about 600-800 squared feet, Master Honey has created another trademarked store des ...
Explain where industry profits are maximized in the figure below.docxgitagrimston
Explain where industry profits are maximized in the figure below:
Problem 13. What real-world evidence would lead you to believe that firms were acting as Cournot oligopolists? Stackelberg oligopolists? Bertrand oligopolists?
...
Exploratory EssayResearch - 1The ability to Wallow in complex.docxgitagrimston
Exploratory Essay/Research - 1
The ability to Wallow in complexity
On a separate paper:
1. Write your Exploratory question.
Your Introduction
Your goal in the Introduction is to hook your reader’s interest in your chosen problem. Often the best way to do so is to show why you yourself became interested in it.
Write about any or all of the following:
· Why do you think you have chosen this particular subject? What interested you?
· Personal connection?
· Specific experiences?
· What do you think are the origins of your feelings?
· What are your first responses/answers to the question?
· Why do you think you feel the way you do now?
· Can you imagine yourself ever changing your mind? Why?
· Can you list (or imagine) different or alternative answers to this question? List some of them.
· How do you feel about these?
· Why?
· At this point, what is the most perplexing, confusing, or puzzling thing about this question?
...
Exploring MusicExtra Credit #2 Due November 6 in classIn G.docxgitagrimston
Exploring Music
Extra Credit #2
Due November 6 in class
In Germany, the 19th century was known as the “Age of Song”. For romantic composers, fusing literature with music represented artistic perfection. The Lied (pronounced “leet”) blended German poetry with piano collaboration. Lieder represent an intimate genre of music utilizing a solo singer partnered with piano. In most cases, the piano acts as more than mere accompaniment as it is able to musically enhance the text, depict moods and atmospheres, and in some cases represent a character in the poem.
For this assignment you will choose any threeLieder and write a 2-3 page paper (double spaced, 12 point font with 1 inch margins) based on the following guidelines to include in your paper:
1. Read the translation of the poetry and establish your own interpretation. Are there any words or phrases that lend themselves to musical depiction? If you were the composer how might you musically depict words or phrases or the mood/ atmosphere of the piece using only one singer and a piano?
2. Listen to the Lied and follow along with the translation. How does you analysis from Question 1 differ or parallel the composer’s interpretation?
3. Pay particular attention to the relationship between the voice, text, and piano keeping in mind the piano offers more than just harmonic support. Provide examples of how the piano enhances the text, creates a mood or atmosphere, or depicts a character from the poem.
4. Does the musical and vocal setting suit the poetry? Explain.
5. Is the setting strophic or through-composed? How does this affect the Lied?
Below are YouTube links to each Lied. Translations of the text are available in the Extra Credit no. 2 folder; print them out for your convenience if you wish.
1. Robert Schumann, “Die alten, bösen Lieder” from Dichterliebe
http://www.youtube.com/watch?v=sGx1zyOPZfM
2. Ludwig van Beethoven, “Der Kuß,” opus 128
http://www.youtube.com/watch?v=NTgcwny1PnU
3. Franz Schubert, “Ganymed”
http://www.youtube.com/watch?v=DMLiVQMDLEs
4. Robert Schumann, “Ich grolle nicht” from Dichterliebe
http://www.youtube.com/watch?v=XDbESDdZmfY
5. Franz Schubert, “Nähe des Geliebten”
http://www.youtube.com/watch?v=t47lxQCvJ5k
6. Clara Schumann, “Liebst du um Schönheit”
http://www.youtube.com/watch?v=kvHPxGfONYY
7. Franz Schubert, “Der Lindenbaum” from Wintereise
http://www.youtube.com/watch?v=zC7gEVSgf9k
8. Franz Schubert, “Rastlose Liebe”
http://www.youtube.com/watch?v=XOBNOB9Oxyc
Type the Boolean operator (AND, OR, or NOT) that best fits in the search statement to satisfy the search criterion stated.
Question 1 (1 point)
Question 1 options:
Find information on pollution in the Chesapeake Bay. "Chesapeake Bay"
pollut*
Question 2 (1 point)
Question 2 options:
Find information on the effect of plastics recycling on the environment. (recycle
reuse)
plastics
environment
Question 3 (1 point)
Question 3 options:
Find information on obedience tr ...
Explain why Franz Boas did not accept Morgan’s view about evol.docxgitagrimston
Explain why Franz Boas did not accept Morgan’s view about evolution ?
What sciences contributed to anthropology ?
How have teens used fashion and music to communicate their identity ?
What styles and attitudes today might seem rebellious to parents ?
What contributions did Pavlov, skinner and Chomsky bring to the comprehension of how language is attained ?
How does language indicate a society's values and priorities?
How has language evolved in some north American communities?
Why is language seen as a significant part of a people’s culture ?
Do advertisers give a false impression of their products ? it this legitimate communication ? why or why not
How can an environmental factors, such as living in a large city or a small rural town, influence individual and cultural evolution
Compare the approaches taken by anthropologist and psychologists in the study of human development ?
What are the various components of all rites of passage ?
How have coming of age rite of passage changed along with modern society
Some rites are experienced alone and some are experienced in groups. explain, with example, why this is the case
How is the body adornment connected to rites of passages
How do films and television programs portray sexual relationship between teens and adults ?
What rites of passage surrounding death have you experienced ?how did you feel about them ?
How do social scientists help people face the haunting prospect of death and the sadness of the loss of a loved one
...
Explanations 6.1 Qualities of Explanations Questions 0 of 3 com.docxgitagrimston
Explanations / 6.1 Qualities of Explanations Questions: 0 of 3 complete (0%) | 0 of 2 correct (0%)
Qualities of Explanations
An explanation is a statement that provides a reason for why or how something became the way it is. Arguments present a conclusion that's presumably new to you and then support this conclusion with evidence that you're likely to believe. Explanations work the other way around: they start with a conclusion that you likely believe (e.g., the sky is blue) and then offer an explanation for why that is so (e.g., because God is a UNC fan).
We will be looking specifically at causal explanations—that is, explanations in which you suggest that a particular physical or behavioral phenomenon is the result of another event.
Situation
Explanation
Traffic on a Saturday
There must be a football game today.
Most explanations start as theories. It can be challenging to fight the human impulse to pick the first theory that comes to mind and stop there, but what are the odds that the first thing you conceive of is in fact the best possible explanation?
Situation
Explanation
Traffic on a Saturday
Perhaps there's a concert today?
Maybe an art festival?
Or possibly an accident up ahead?
With a little imagination, you can come up with a seemingly unlimited number of theories, but at some point you've likely exhausted all the plausible explanations.
Situation
Explanation
Traffic on a Saturday
Perhaps a new IKEA has been built without my hearing anything about it, and all these people are headed to the grand opening.
As with all critical thinking, you'll need some judgment here. Discard the implausible theories (at least initially) and give fair consideration to all the reasonable ones:
· State your theory clearly (make a hypothesis).
· Consider possible alternatives.
· Look at the evidence.
· Evaluate the theory.
Sometimes the facts make the explanation quite clear:
I can see a train moving through an intersection several hundred yards ahead. That explains why traffic isn't moving.
Other times, you'll need to employ inductive reasoning to establish the most likely cause:
I can't see the tracks from here, but I drive through here every Saturday morning and usually a train was responsible for traffic being stalled. So it's probably a train.
We are presented with many such explanations on a daily basis.
Why is this webpage not loading?Why are sales down for last quarter?Why is my spouse not speaking to me?
As you consider potential explanations, keep the following standards in mind.
Consistency
First, is it internally consistent or does it contradict itself?
Second, is it externally consistent? Could this explanation effectively and fully account for whatever it's supposed to explain?
A good theory should be compatible with what we already know about how the world works. This is a problem with many paranormal theories—they go against accepted scientific fact. If the theory contradicts established knowledge, the burden of proof is on the new t ...
Experts Presentation
Student
PSY 496
Instructor
Overview of professionals
Maria Theresa Redaniel, Ph.D.
Suicide prevention specialist who’s main focus is finding ways to prevent suicide cases within local communities.
She is looking to branch out from the community sector to further her expertise on a federal and state vocation.
Received her master’s from the University of Nebraska in Community Development.
Michael Bauer, M.D., Ph.D.
Mental health profession with interest in suicide risk assessments, homicide and product liability especially in relation to psychotropic drugs.
He has extensive background in the field and wishes to further his resume by succeeding as a mentor to upcoming peers in the field.
Graduated top of his class from the University of Illinois 1965.
Suicide and prevention
Effective protective care is essential to suicide prevention.
If you are in crisis, call 1-800-273-TALK (8255) National Suicide Prevention Lifeline
Suicide is the 10th leading cause of death in the united states (AFSP, 2014). And the third leading cause among youth and young adults (Wharff, Ross, & Lambert, 2014)
Research shows 90% of those who have died by suicide had a potentially treatable mental illness (AFSP, 2014).
Prevention starts with awareness and education.
Risk Factors may include mental disorder, previous attempts, family history, serious medical condition or pain. These factors combined with environmental stimuli increase chances of suicide and suicide attempts (Carlborg, Winnerback, Jonsson, Jokinen & Nordstrom, (2010).
Research
Maria’s focus has been in the community prevention. The barriers of suicide documentation in the Philippines has encouraged her research in using psychological autopsy’s to evaluate a course of intervention (AFSP, 2014). Psychological autopsies have been used to present evidence of mental disorders present in those who died from suicide based on a collection of interviews and reports to dictate what they may have thought (Hjelmeland, Dieserud, Dyregrov, Knizek & Leenaars, 2012).
Michael has focused his research in the use of pharmacology in suicide prevention. Giving participants a prescribed amount of lithium has shown great strides in lowering future suicide attempts and depressive behaviors (ASFP, 2014).
Comparison
Maria has strong views in behavior aspect of study. She has culminated research of behaviors related to mental disorders and compared them to suicide reports made from informant interviews and medical documents. She uses such information to hopefully reduce the suicide rates in the community by early diagnosis and treatment prevention.
Michael uses his successful career in clinical psychology to establish the benefits of treating mental disorders to prevent suicides and suicidal behaviors. He focuses his research to provide evidence of pharmacology on disorders. His goal it to use such evidence to reduce thoughts of suicide and attempts.
References
American Foun ...
Explain whether Okonkwo was remaining truthful to himself by killi.docxgitagrimston
Explain whether Okonkwo was remaining truthful to himself by killing himself
Please make sure that you answer this question with 4 pages in length, it has to be MLA format, double space.
LDR/531 – WEEK 2
*
WDWLLW?DISC AssessmentLeadershipPersonality
*
ObjectivesTheories of Leadership Compare and contrast leadership theories.Evaluate the strengths and weaknesses of established leadership styles.
*
Leadership is:
Are leader’s born or made?
Leader traits – the trait approach is the oldest leadership perspective and was dominant for several decades. The perspective is that some personality characteristics – many of which a person need not be born with but can strive to acquire distinguish effective leaders from other people.
Drive, which refers to a set of characteristics that reflect a high level of effort. It includes high need for achievement, constant striving for improvement, ambition, energy, tenacity (persistence in the face of obstacles), and initiative.
Leadership motivation – great leaders not only have drive, they want to lead.
Integrity is the correspondence between actions and words. Honesty and credibility are especially important.
Self-confidence is important because the leadership role is challenging, and setbacks are inevitable.
Knowledge of the business, industry, company, and technical matters.
The most important personal skill, according to the text, the ability to perceive the needs and goals of others and to adjust one’s personal leadership approaches accordingly.
B. Leader Behaviors
1. Leadership behaviors – the behavioral approach attempts to identify what good leaders do. Three general categories of leadership behavior are: (Figure 12.2)
a. Task performance behaviors are the leader’s efforts to insure that the work unit or organization reaches its goals.
i. This dimension is sometimes referred to as:
concern for production
directive leadership
initiating structure or closeness of supervision.
ii. It includes a focus on:
work speed
quality and accuracy
quantity of output
following the rules.
b. Group maintenance behaviors is where leaders take action to ensure the satisfaction of group members, develop and maintain harmonious work relationships, and preserve the social stability of the group.
i. This dimension is sometimes referred to as:
(1) concern for people
(2) supportive leadership
(3) consideration.
ii. Leader-Member Exchange (LMX) theory highlights the importance of leader behaviors not just toward the group as a whole but also toward individuals
The ability to influence a group toward the achievement of a vision or set of goals.
OR
The process of influencing others to understand and agree what needs to be done and how to do it, and the process of facilitating individual and collective efforts to accomplish shared objectives
*
Types of leadershipLeadership involves influencing others (who influences? What type of influence?)to collaborate and agree (purpose of influence?) ...
Explain How these Aspects Work Together to Perform the Primary Fun.docxgitagrimston
Explain How these Aspects Work Together to Perform the Primary Function of HRM
Total: 5.00
Distinguished - Thoroughly and methodically explains how each of the aspects work together to perform the primary function of HRM. The explanation is professional and provides detailed examples that clearly demonstrate that new learning has occurred.
Proficient - Explains how each of the aspects work together to perform the primary function of HRM. The explanation is well constructed and provides several examples that demonstrate that new learning has occurred; however, a few minor details are missing.
Basic - Briefly explains how each of the aspects work together to perform the primary function of HRM. The explanation is somewhat complete, but provides few examples that demonstrate that new learning has occurred. Several key details are missing.
Below Expectations - Attempts to explain how each of the aspects work together to perform the primary function of HRM, but the explanation is too underdeveloped to be considered complete and does not demonstrate that new learning has occurred.
Non-Performance - The assignment is either nonexistent or fails to explain how these aspects work together to perform the primary function of HRM.
Are Any Aspects More Important than the Others? Why or Why Not?
Total: 4.00
Distinguished - Comprehensively explains whether or not any aspects are more important than others, including a detailed reasoning as to why. The explanation is professional and provides detailed examples that clearly demonstrate that new learning has occurred.
Proficient - Explains whether or not any aspects are more important than others, including reasoning as to why. The explanation well-written and provides a few examples that demonstrate that new learning has occurred. One or more minor details may be missing.
Basic - Briefly explains whether or not any aspects are more important than others, including a short reasoning as to why. The explanation is slightly underdeveloped and somewhat demonstrates that new learning has occurred. Several key details may be missing.
Below Expectations - Attempts to explain whether or not any aspects are more important than others, but the explanation is too underdeveloped to be considered complete and does not demonstrate that new learning has occurred.
Non-Performance - The assignment is either nonexistent or fails to determine whether or not and aspects are more important than others.
Optimizing the HRM Role for Shaping Organizational and Employee Behavior
Total: 4.00
Distinguished - Provides a comprehensive and thorough discussion addressing how the HRM role can be optimized for shaping organizational and employee behavior. The discussion is thought-provoking, creative, and utilizes vocabulary and concepts from the text.
Proficient - Provides a discussion addressing how the HRM role can be optimized for shaping organizational and employee behavior. The discussion is mostly complete and attempts to utilize voca ...
Explain the 3 elements of every negotiation. Why is WinWin used m.docxgitagrimston
Explain the 3 elements of every negotiation. Why is Win/Win used more than Win/Lose in life? When is the efficiency of a negotiation determined? Give an example of in the world today of a good and a bad negotiator
Lockeport Medical Center
Mission and Vision
As the regional leader in advanced medical care, we take our responsibilities seriously. Our vision and core values help guide us as we work to help and heal each patient in our care. We provide the community quality health care services through the compassionate hands of well-trained staff, in a technologically advanced, cost-effective manner.
Our Mission: To improve the health of the people of the state and surrounding region.
· Serve people as a not-for-profit health system governed by a voluntary community board.
· Ensure sustainability through stewardship of the community's assets.
· Provide quality services in a compassionate and cost-effective manner.
· Collaborate in order to improve access across the entire continuum of care.
· Promote wellness and health to benefit the community.
2020 Vision
A regional diversified health system providing superior care and service to patients and their families through a full continuum of integrated services, education, and research.
Major Strategies: "DEEDS"
Develop people
Excel in patient quality and safety
Enhance operational and financial performance
Develop the health system
Strengthen key relationships
Our MERIT Values
Five core values: Mercy, Excellence, Respect, Integrity and Trust/Teamwork. These values form the foundation for our culture at Lockeport Medical Center.
Mercy
We work to create a caring and compassionate environment responsive to the emotional, spiritual, and physical needs of all persons.
Excellence
We strive to meet or exceed patient/customer needs and expectations and work as a team to improve every aspect of care and service in our organization.
Respect
We value the innate dignity of all persons, respect their uniqueness and diversity, and enable the development of each one's full potential.
Integrity
We are consistently open, honest, and ethical, as the ideal means to protect overall safety and ensure confidentiality and privacy.
Trust/Teamwork
We say what we mean and do what we say. There is open and honest communication with patients and among staff. We recognize everyone’s contributions for the benefit of the patient. We strive to enhance the health of the communities we serve, and work in cooperation with other organizations to protect our vulnerable populations throughout the region.
Job Description
Position Title: Surgery Schedule Coordinator
Department: Operating Room
FLSA Status: Non-Exempt
Position Summary
Uses clinical and management processes to plan, organize, staff, direct, and evaluate patient care services; uses available resources to meet MD/customer needs. The surgery schedule coordinator uses knowledge of interactive management and humanistic values in creating an environment ...
Exploration 8 – Shifting and Stretching Rational Functions .docxgitagrimston
Exploration 8 – Shifting and Stretching Rational Functions
1. Sketch the graph of each function.
3( )f x
x
3
( ) 1
2
f x
x
Domain: Range: Domain: Range:
vertical horizontal vertical horizontal
asymptote: asymptote: asymptote: asymptote:
x-intercept: y-intercept: x-intercept: y-intercept:
How do you find the domain and vertical asymptote of a rational function?
How did you find the range and horizontal asymptote of THIS rational function?
How do you find the x-intercept of a function?
How do you find the y-intercept of a function?
Graphing
3
( ) 1
2
f x
x
is relatively easy.
Re-write the function rule as a single fraction by
subtracting the 1. Then find each of the following
for the newly written function.
Domain: Range: x-intercept: y-intercept:
vertical horizontal
asymptote: asymptote:
How do you find the equation of the horizontal asymptote for THIS type of function?
WebAssign Problem:
Graph the function,
2 4
( )
1
x
f x
x
, by shifting and stretching the function, 1( )f x
x
.
The horizontal shift is ______________________ because ________________________________.
The vertical shift is ______________________ because ___________________________________.
To find the stretch, you must re-write the function,
2 4
( )
1
x
f x
x
, in 1( )f x
x
form, by setting the
two rules equal and solving for c. Then sketch the graph below.
For the group submission:
Graph the function,
2 2
( )
1
x
f x
x
, by shifting and stretching the function, 1( )f x
x
.
Horizontal Shift:
Vertical Shift:
Stretch:
vertical horizontal x-intercept: y-intercept:
asymptote: asymptote:
Domain: Range:
Group Submission for Investigation #8
Write group member names legibly here:
Graph the function,
2 2
( )
1
x
f x
x
, by shifting and stretching the function, 1( )f x
x
.
Horizontal Shift:
Vertical Shift:
Stretch:
vertical horizontal x-intercept: y-intercept:
asymptote: asymptote:
Domain: Range:
...
Exploring Innovation in Action Power to the People – Lifeline Ene.docxgitagrimston
Exploring Innovation in Action: Power to the People – Lifeline Energy
Trevor Baylis was quite a swimmer in his youth, representing Britain at the age of 15. So it wasn’t entirely surprising that he ended up working for a swimming pool firm in Surrey before setting up his own company. He continued his swimming passion – working as a part-time TV stuntman doing underwater feats – but also followed an interest in inventing things. One of the projects he began work on in 1991 was to have widespread impact despite – or rather because of – being a ‘low-tech’ solution to a massive problem.
Having seen a documentary about AIDS in Africa he began to see the underlying need for something which could help communication. Much of the AIDS problem lies in the lack of awareness and knowledge across often isolated rural communities – people don’t know about causes or prevention of this devastating disease. And this reflects a deeper problem – of communication. Experts estimate that less than 20% of the world’s population have access to a telephone, while even fewer have a regular supply of electricity, much less television or Internet access. Very low literacy levels exclude most people from reading newspapers and other print media.
Radio is an obvious solution to the problem – but how can radio work when the receivers need power and in many places mains electricity is simply non-existent. An alternative is battery power – but batteries are equally problematic – even if they were of good quality and freely available via village stores people couldn’t afford to buy them regularly. In countries where $1 a day is the standard wage, batteries can cost from a day’s to a week’s salary. The HIV/AIDS pandemic also means that household incomes are under increased pressure as earners become too ill to work while greater expenditure goes towards healthcare, leaving nothing for batteries.
What was needed was a radio which ran on some different source of electricity. In thinking about the problem Baylis remembered the old-fashioned telephones of pre-war days which had wind-up handles to generate power. He began experimenting, linking together odd items such as a hand brace, an electric motor and a small radio. He found that the brace turning the motor would act as a generator that would supply sufficient electricity to power the radio. By adding a clockwork mechanism he found that a spring could be wound up – and as it unwound the radio would play. This first working prototype ran for 14 minutes on a two minute wind. Trevor had invented a clockwork (wind-up) radio! As a potential solution to the communication problem the idea had real merit. The trouble was that, like thousands of entrepreneurs before him, Trevor couldn’t convince others of this. He spent nearly four years approaching major radio manufacturers like Philips and Marconi but to no avail. But luck often plays a significant part in the innovation story – and this was no exception. The idea came to the attenti ...
Experiment 8 - Resistance and Ohm’s Law 8.1 Introduction .docxgitagrimston
Experiment 8 - Resistance and Ohm’s Law
8.1 Introduction
In previous experiments, we have investigated electric charges largely under stationary conditions. These
studies were useful in order to illustrate concepts such as the electric potential and the electric field, and
forms the foundation needed to further our understanding of electricity and electrical circuits. In contrast
to electrostatics (charges confined to be stationary), the field of electricity deals with the flow (induced
movement) of electrical charges. Due to its many uses, most individuals knowingly or unknowingly have
a daily reliance on electricity. It is especially essential, in: (1) the distribution of energy, and (2) the
processing of information. To enable this, electricity must be handled in circuits, a closed loop of
conducting wire connecting power plant with individual homes, and businesses. To appreciate this
phenomena, it is useful to investigate various aspects of simple circuits and the various laws that may
govern them.
8.2 Objective
1. To verify Ohm’s Law
2. To use Ohm’s law to determine the resistance of a light source.
8.3 Theory
Our initial investigations will be guided by Ohm’s law, which postulates that the relationship between
current flow I, potential difference V, and resistance R for certain materials will observe the following
mathematical relationship, given a constant temperature constraint:
…………. 1RV = I
These materials are called Ohmic conductors, equation 1 implies that the ratio of voltage to current for
these materials is constant. Manufactured resistors can be considered as such, but other components such
as semiconductor diodes, filaments, and LEDs are non ohmic. In this experiment, we will verify Ohm’s
law by assessing whether it holds for a set resistance (typical color coded resistor). Further, we will apply
this to ascertain the resistance of a light source.
8.4 Apparatus
Variable DC voltage source, color coded resistor, (2) multimeters, connecting wires, light source
8.5 Procedure
Part A Verifying Ohm’s Law
1. You will be given a particular colour coded resistor from the set; use this and the other apparatus
items to set up the circuit as shown in figure 1 below.
Figure 1
2. Adjust DC voltage source so that a relatively small voltage reading is seen across the resistor R.
Record this voltage reading, and the electrical current reading ...
Experimental Essay The DialecticThe purpose of this paper is to.docxgitagrimston
Experimental Essay: The Dialectic
The purpose of this paper is to experiment with a style of essay that you’ve probably never written before: The Dialectic. We’ll be testing Foucault’s idea about polemics in order to push ourselves to consider and explore multiple conflicting perspectives in a single paper.
The basic premise is that you will write a series of thesis, antithesis arguments - point and counterpoint paragraphs. You will first argue a side of a discussion and then take up the opposing side, eloquently crafting a rigorous response to your own ideas.
Your essay should explore the concepts we will be discussing in class, so if you’ve been doing the homework, you already have some arguments to work from. If you would like something more specific to work from, the Justice discussions and comments that your peers will be posting on course studio are a good start. In addition to this, you should also read through your notes from our class discussion about the predictions from the Constitutional Convention 1787. Can we make an argument that the poor indirectly sell their votes to the rich? Does the wealthiest class of America really dictate society? Do the poor impose upon the freedom and the property of the rich through voting? In what ways can private interests manipulate public opinions and widely held beliefs? Who is influencing whom? Who is responsible for the actions and behaviors of masses and of individuals?
This dialectic should not look like the typical childhood debate: “YES. NO. YES. NO.” You should not simply state a side and then write the inverse. Instead, you should invent the most compelling defense for both sides. Where students misstep here is in the unfortunate habit of writing weak counterpoints - something “stupid” that’s easy to rip apart. Right? We’ve all done this in essays that require counterpoints. Why that doesn’t work for this essay is that it would essentially mean that HALF of your essay is intentionally “stupid”... This doesn’t make for a good college paper. Instead, you must argue both sides so well that the reader cannot tell which is actually your own position.
To build this paper over the next two weeks, you should be exploring as many points (and counterpoints) as you can imagine in your homework assignments. In your final essay, I would like you to try to compile what you believe to be your best ideas.
This paper cannot be a summary - you should not simply have a series of points restating and summarizing the arguments that you’ve pulled from the various texts. Instead, you should use what you think is interesting from the text as a way to launch into a discussion of your own brilliant ideas.
Format: double-spaced, times new roman typeface, 12-point font, with 1 inchmargins.
The paper must be 1000 - 1400 words in length.
Peer Review Draft Due : May 27
Final Draft Due : May 29 via email by 11:54pm
REFLECTION PIECE: You will also be writing a 300 word reflection on your writing. In this piece you sho ...
How to Create Map Views in the Odoo 17 ERPCeline George
The map views are useful for providing a geographical representation of data. They allow users to visualize and analyze the data in a more intuitive manner.
We all have good and bad thoughts from time to time and situation to situation. We are bombarded daily with spiraling thoughts(both negative and positive) creating all-consuming feel , making us difficult to manage with associated suffering. Good thoughts are like our Mob Signal (Positive thought) amidst noise(negative thought) in the atmosphere. Negative thoughts like noise outweigh positive thoughts. These thoughts often create unwanted confusion, trouble, stress and frustration in our mind as well as chaos in our physical world. Negative thoughts are also known as “distorted thinking”.
Instructions for Submissions thorugh G- Classroom.pptxJheel Barad
This presentation provides a briefing on how to upload submissions and documents in Google Classroom. It was prepared as part of an orientation for new Sainik School in-service teacher trainees. As a training officer, my goal is to ensure that you are comfortable and proficient with this essential tool for managing assignments and fostering student engagement.
The Roman Empire A Historical Colossus.pdfkaushalkr1407
The Roman Empire, a vast and enduring power, stands as one of history's most remarkable civilizations, leaving an indelible imprint on the world. It emerged from the Roman Republic, transitioning into an imperial powerhouse under the leadership of Augustus Caesar in 27 BCE. This transformation marked the beginning of an era defined by unprecedented territorial expansion, architectural marvels, and profound cultural influence.
The empire's roots lie in the city of Rome, founded, according to legend, by Romulus in 753 BCE. Over centuries, Rome evolved from a small settlement to a formidable republic, characterized by a complex political system with elected officials and checks on power. However, internal strife, class conflicts, and military ambitions paved the way for the end of the Republic. Julius Caesar’s dictatorship and subsequent assassination in 44 BCE created a power vacuum, leading to a civil war. Octavian, later Augustus, emerged victorious, heralding the Roman Empire’s birth.
Under Augustus, the empire experienced the Pax Romana, a 200-year period of relative peace and stability. Augustus reformed the military, established efficient administrative systems, and initiated grand construction projects. The empire's borders expanded, encompassing territories from Britain to Egypt and from Spain to the Euphrates. Roman legions, renowned for their discipline and engineering prowess, secured and maintained these vast territories, building roads, fortifications, and cities that facilitated control and integration.
The Roman Empire’s society was hierarchical, with a rigid class system. At the top were the patricians, wealthy elites who held significant political power. Below them were the plebeians, free citizens with limited political influence, and the vast numbers of slaves who formed the backbone of the economy. The family unit was central, governed by the paterfamilias, the male head who held absolute authority.
Culturally, the Romans were eclectic, absorbing and adapting elements from the civilizations they encountered, particularly the Greeks. Roman art, literature, and philosophy reflected this synthesis, creating a rich cultural tapestry. Latin, the Roman language, became the lingua franca of the Western world, influencing numerous modern languages.
Roman architecture and engineering achievements were monumental. They perfected the arch, vault, and dome, constructing enduring structures like the Colosseum, Pantheon, and aqueducts. These engineering marvels not only showcased Roman ingenuity but also served practical purposes, from public entertainment to water supply.
Model Attribute Check Company Auto PropertyCeline George
In Odoo, the multi-company feature allows you to manage multiple companies within a single Odoo database instance. Each company can have its own configurations while still sharing common resources such as products, customers, and suppliers.
This is a presentation by Dada Robert in a Your Skill Boost masterclass organised by the Excellence Foundation for South Sudan (EFSS) on Saturday, the 25th and Sunday, the 26th of May 2024.
He discussed the concept of quality improvement, emphasizing its applicability to various aspects of life, including personal, project, and program improvements. He defined quality as doing the right thing at the right time in the right way to achieve the best possible results and discussed the concept of the "gap" between what we know and what we do, and how this gap represents the areas we need to improve. He explained the scientific approach to quality improvement, which involves systematic performance analysis, testing and learning, and implementing change ideas. He also highlighted the importance of client focus and a team approach to quality improvement.
2024.06.01 Introducing a competency framework for languag learning materials ...Sandy Millin
http://sandymillin.wordpress.com/iateflwebinar2024
Published classroom materials form the basis of syllabuses, drive teacher professional development, and have a potentially huge influence on learners, teachers and education systems. All teachers also create their own materials, whether a few sentences on a blackboard, a highly-structured fully-realised online course, or anything in between. Despite this, the knowledge and skills needed to create effective language learning materials are rarely part of teacher training, and are mostly learnt by trial and error.
Knowledge and skills frameworks, generally called competency frameworks, for ELT teachers, trainers and managers have existed for a few years now. However, until I created one for my MA dissertation, there wasn’t one drawing together what we need to know and do to be able to effectively produce language learning materials.
This webinar will introduce you to my framework, highlighting the key competencies I identified from my research. It will also show how anybody involved in language teaching (any language, not just English!), teacher training, managing schools or developing language learning materials can benefit from using the framework.
1. EXERCISE 23 PEARSON'S PRODUCT-MOMENT
CORRELATION COEFFICIENT
STATISTICAL TECHNIQUE IN REVIEW
Many studies are conducted to identify relationships between or
among variables. The correlational coefficient is the
mathematical expression of
the relationship studied. Three common analysis techniques are
used to examine relationships: Spearman Rank-Order
Correlation or rho, Kendall's
Tau or tau, and the Pearson's Product-Moment Correlation
Coefficient or r. Spearman and Kendall's Tau are used to
examine relationships with
ordinal level data. Pearson's Correlation Coefficient is the most
common correlational analysis technique used to examine the
relationship
between two variables measured at the interval or ratio level.
Relationships are discussed in terms of direction and strength.
The direction of the relationship is expressed as either positive
or negative. A
positive or direct relationship exists when one variable
increases as does the other variable increases, or when one
variable decreases as the other
decreases. Conversely, a negative or inverse relationship exists
when one variable increases and the other variable decreases.
The strength of a
relationship is described as weak, moderate, or strong. Pearson's
r is never greater than −1.00 or +1.00, so an r value of −1.00 or
+1.00 indicates the
strongest possible relationship, either negative or positive,
2. respectively. An r value of 0.00 indicates no relationship. To
describe a relationship, the
labels weak (r < 0.3), moderate (r = 0.3 to 0.5), and strong (r >
0.5) are used in conjunction with both positive and negative
values of r. Thus, the
strength of the negative relationships would be weak with r <
−0.3, moderate with r = −0.3 to −0.5, and strong with r > −0.5
(Burns & Grove,
2007).
RESEARCH ARTICLE
Source: Keays, S. L., Bullock-Saxton, J. E., Newcombe, P., &
Keays, A. C. (2003). The relationship between knee strength
and functional
stability before and after anterior cruciate ligament
reconstruction. Journal of Orthopedic Research, 21 (2), 231–7.
Introduction
Keays et al. (2003) conducted a correlational study to determine
“the relationship between muscle strength and functional
stability in 31 patients
pre- and postoperatively, following a unilateral anterior cruciate
ligament rupture” (Keays et al., 2003, p. 231). The results of the
study showed a
significant positive correlation between quadriceps strength
indices and functional stability, both before and after surgery.
No significant
relationship was demonstrated between hamstring strength
indices 60°/s and functional stability, as presented in Table 5.
Relevant Study Results
3. “Patients with an unstable knee as a result of an anterior
cruciate ligament (ACL) rupture rely heavily on muscle function
around the joint to
maintain dynamic stability during functional activity. It is
uncertain which muscles play the decisive role in functional
stability or exactly which
aspect of muscle function is most critical” (Keays et al., 2003,
p. 231). “The aim of this study was to assess the relationship
between muscle
strength and functional stability of 31 patients pre- and
postoperatively, following unilateral ACL ligament rupture”
(Keays et al., 2003, p. 231).
“To assess the relationship between maximum isokinetic
strength and functional performance Pearson's correlations (r)
were computed. … Due to
the number of correlations computed, and therefore the
increased likelihood that chance results may be evident, a more
conservative significance
level of α = 0.01 was adopted to control for increased Type 1
error” (see Table 5; Keays et al., 2003, pp. 232–3).
TABLE 5 Pearson's Product-Moment Correlation between
Strength Indices and Function after Surgery
n Quadriceps Strength Index 60°/s Hamstring Strength Index
60°/s Quadriceps Strength Index 120°/s Hamstring Strength
4. Index 20°/s
Hop index 3
1
r = 0.655** r = 0.247 r = 0.744** r = 0.431*
Sig. (two tailed) p = 0.000 p = 0.080 p = 0.000 p = 0.016
Triple hop index 3
1
r = 0.619** r = 0.342 r = 0.742** r = 0.420*
Sig. (two tailed) p = 0.000 p = 0.060 p = 0.000 p = 0.019
Shuttle run test 3
1
r = −0.498** r = −0.149 r = −0.457** r = −0.178
Sig. (two tailed) p = 0.004 p = 0.424 p = 0.010 p = 0.338
Side step test 3
1
r = −0.528** r = −0.124 r = −0.519** r = 0.238*
Sig. (two tailed) p = 0.002 p = 0.506 p = 0.003 p = 0.198
Carioca test 3
1
r = −0.474* r = −0.047 r = −0.510** r = 0.267
Sig. (two tailed) p = 0.000 p = 0.802 p = 0.003 p = 0.146
6. Below is an example of a mirror-image table that compares
hours of class attended,
hours studying, and final grade as a percentage. The results in
the table are intended as an example of a mirror-image table and
are not based on
research. If you were asked to identify the r value for the
relationship between hours of class attended and the final grade
as a percentage, the
answer would be r = 0.72, and between hours studying and final
grade as a percentage, the answer would be r = 0.78. The dash
(–) marks located
on the diagonal line of the table represent the variable's
correlation with itself, which is always a perfect positive
correlation or r = +1.00.
VARIABLES A B C
A. Hours of class attended – 0.44 0.72
B. Hours studying 0.44 – 0.78
C. Final grade as a percentage 0.72 0.78 –
Effect Size of an r Value
In determining the strength of a relationship, remember that a
weak relationship is r < 0.3 or r < −0.3, a moderate relationship
is r = 0.3 to 0.5 or
−0.3 to −0.5, and a strong relationship is r > 0.5 or > −0.5. The
r value is equal to the effect size or the strength of a
relationship. In the table
above, the relationship between hours of class attended and
hours of studying is r = 0.44 and the effect size = 0.44. The
effect size is used in
power analysis to determine sample size for future studies. The
strength of the effect size is the same as that for the r values,
7. with a weak effect
size < 0.3 or < −0.3, a moderate effect size 0.3 to 0.5 or −0.3 to
−0.5, and a strong effect size > 0.5 or > −0.5. The smaller the
effect size, the
greater the sample size needed to detect significant
relationships in future studies. Thus the larger the effect size,
the smaller the sample size that
is needed to determine significant relationships. The
determination of study sample sizes with power analysis is
presented in Exercise 12.
173
174
Percentage of Variance Explained in a Relationship
Percentage of variance explained is a calculation based on a
Pearson's r value. The purpose for calculating the percentage of
variance explained is
to understand further the relationship or correlation between
two variables in terms of clinical importance. To calculate the
percentage of variance
explained, square the r value then multiply by 100 to determine
a percentage.
Formula: r2 × 100 = % variance explained
Example: r = 0.78 (correlation between hours studying and final
grade as a percentage)
(0.78)2 × 100 = 0.6084 × 100 = 60.84% variance explained
8. The example above indicates that the hours studying can be
used to predict 60.84% of the variance in the final course grade.
Calculating the
percentage of variance explained helps the researchers and
consumers of research better understand the practical
implications of reported results.
The stronger the r value, the greater the percentage of variance
explained. For example if r = 0.5, then 25% of the variance in
one variable is
explained by an another variable and if r = 0.6, then 36% of the
variance is explained. Any Pearson's r ≥ 0.3, which yields a 9%
variance
explained, is considered clinically important. Keep in mind that
a result may be statistically significant (p < 0.05), but it may
not represent a
clinically important finding (Burns & Grove, 2005).
RESEARCH ARTICLE
Source: Hatchett, G. T., & Park, H. L. (2004). Relationships
among optimism, coping styles, psychopathology, and
counseling outcome.
Personality and Individual Differences, 36 (8), 1755–69.
Introduction
Hatchett and Park (2004) conducted a study consisting of 96
college students to determine the relationships between
optimism, coping styles,
psychopathology, and counseling outcomes. Each participant
filled out three questionnaires before beginning counseling: the
Outcome
9. Questionnnaire-45 (OQ-45) (measures psychopathology), the
Life Orientation Test-Revised (LOT-R) (measures optimism and
pessimism), and
the Coping Inventory for Stressful Situations (CISS) (measures
coping styles). At the termination of treatment, the OQ-45 was
re-administered.
The researchers reported that optimism “was negatively
correlated with psychopathology, emotion-oriented coping, and
the avoidance-distraction
subscale from the CISS” (Hatchett & Park, 2004, p. 1762).
Conversely, they report optimism to be positively correlated
with task-oriented coping
and the avoidance–social diversion subscales. Pessimism
reportedly had the opposite or negative relationships with these
same variables. The
researchers reported no statistically significant correlation
between optimism and counseling outcomes. “Future research
might be directed at
determining whether the early assessment and subsequent
remediation of pessimistic thoughts leads to better outcomes.
Furthermore research
might ascertain whether optimists and pessimists respond
differently to certain types of clinical interventions. [One]
might advocate matching
clinical interventions to clients’ unique personality
characteristics. For example, optimists, who rely more on
problem-focused coping strategies,
might respond better to more active intervention strategies (e.g.,
problem-solving skills). On the other hand, pessimists, who
report greater use of
emotion-oriented coping, might respond better to more
expressive and supportive therapeutic techniques” (Hatchett &
Park, 2004, pp. 1766–7).
Relevant Study Results
10. In Table 2 in p. 175, Hatchett and Park (2004) presented the
correlations among optimism (LOT-R Total and Positive Items);
pessimism
(Negative Items); psychopathology (OQ-45); and coping styles
(Task, Emotion, Avoidance, Avoidance–Distraction, and
Avoidance–Social
Diversion). Table 2 is a mirror-image table with the variables
numbered and labeled on the y-axis and the numbers of the
variables on the x-axis.
The blank spaces in the table are where the variable is
correlated with itself and would be a +1.00 correlation.
TABLE 2 Intercorrelations among Optimism, Psychopathology,
and Coping Styles
Variable 1 2 3 4 5 6 7 8 9
1. OQ-45 (psychopathology) – -0.72** -0.59** 0.74** -0.43**
0.76** -0.22* 0.09 -0.45**
2. LOT-R Total (optimism) – 0.92** -0.94** 0.54** -0.58**
0.11 -0.20* 0.38**
3. Positive Items (from LOT-R) – -0.72** 0.53** -0.48** 0.15