Download to read offline
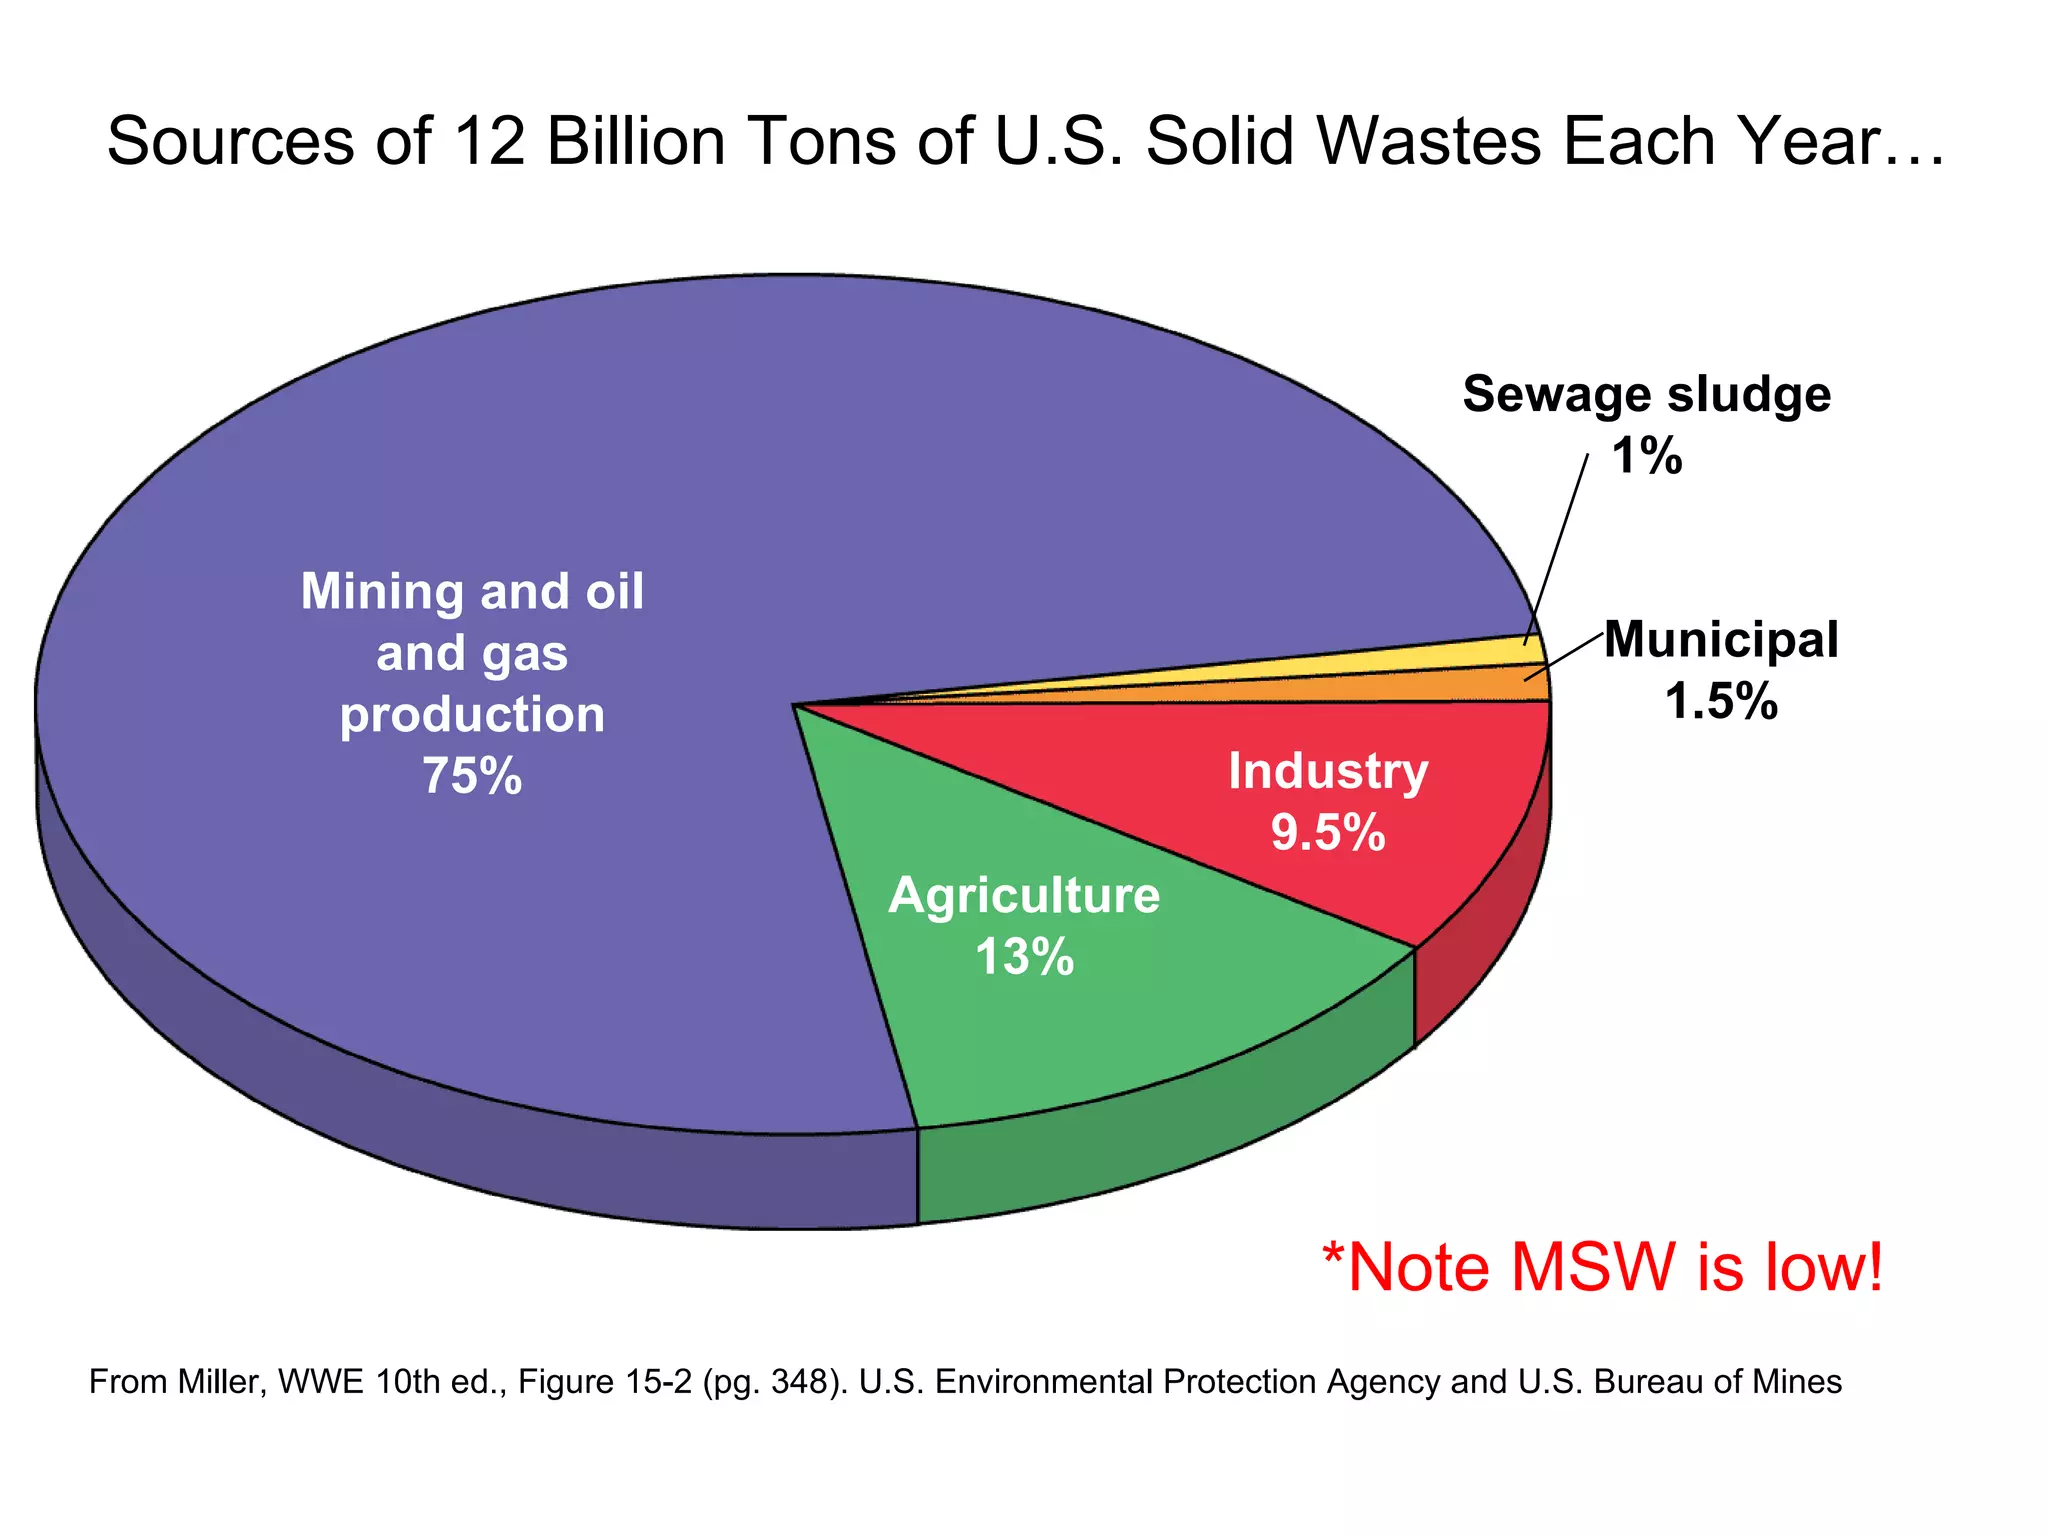
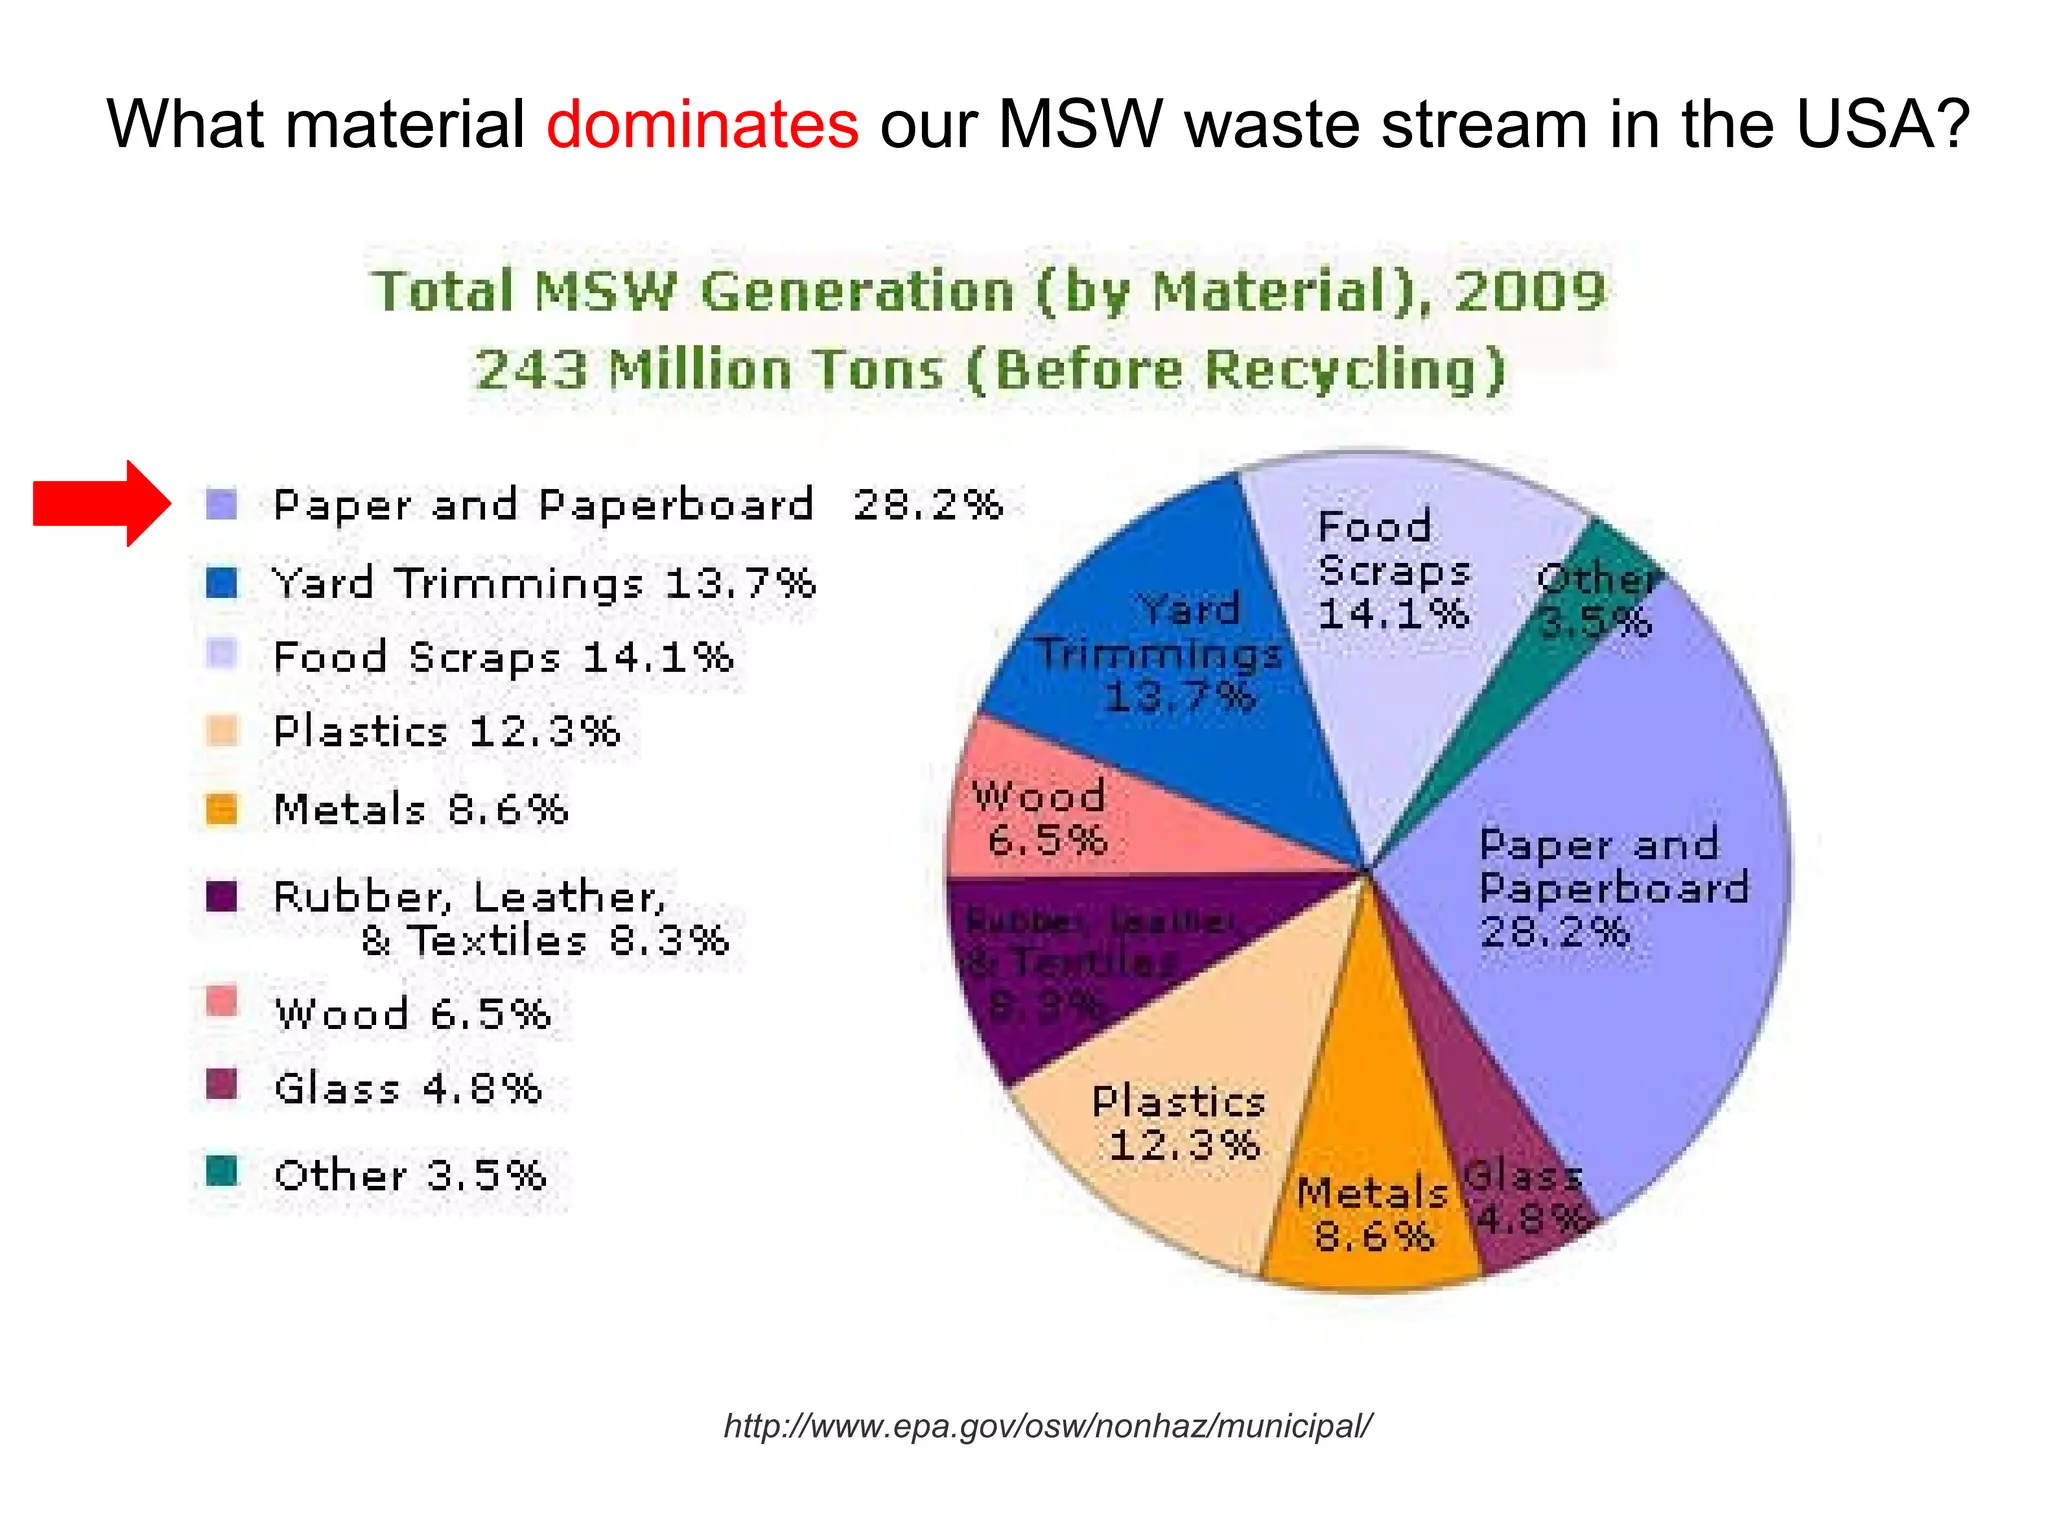
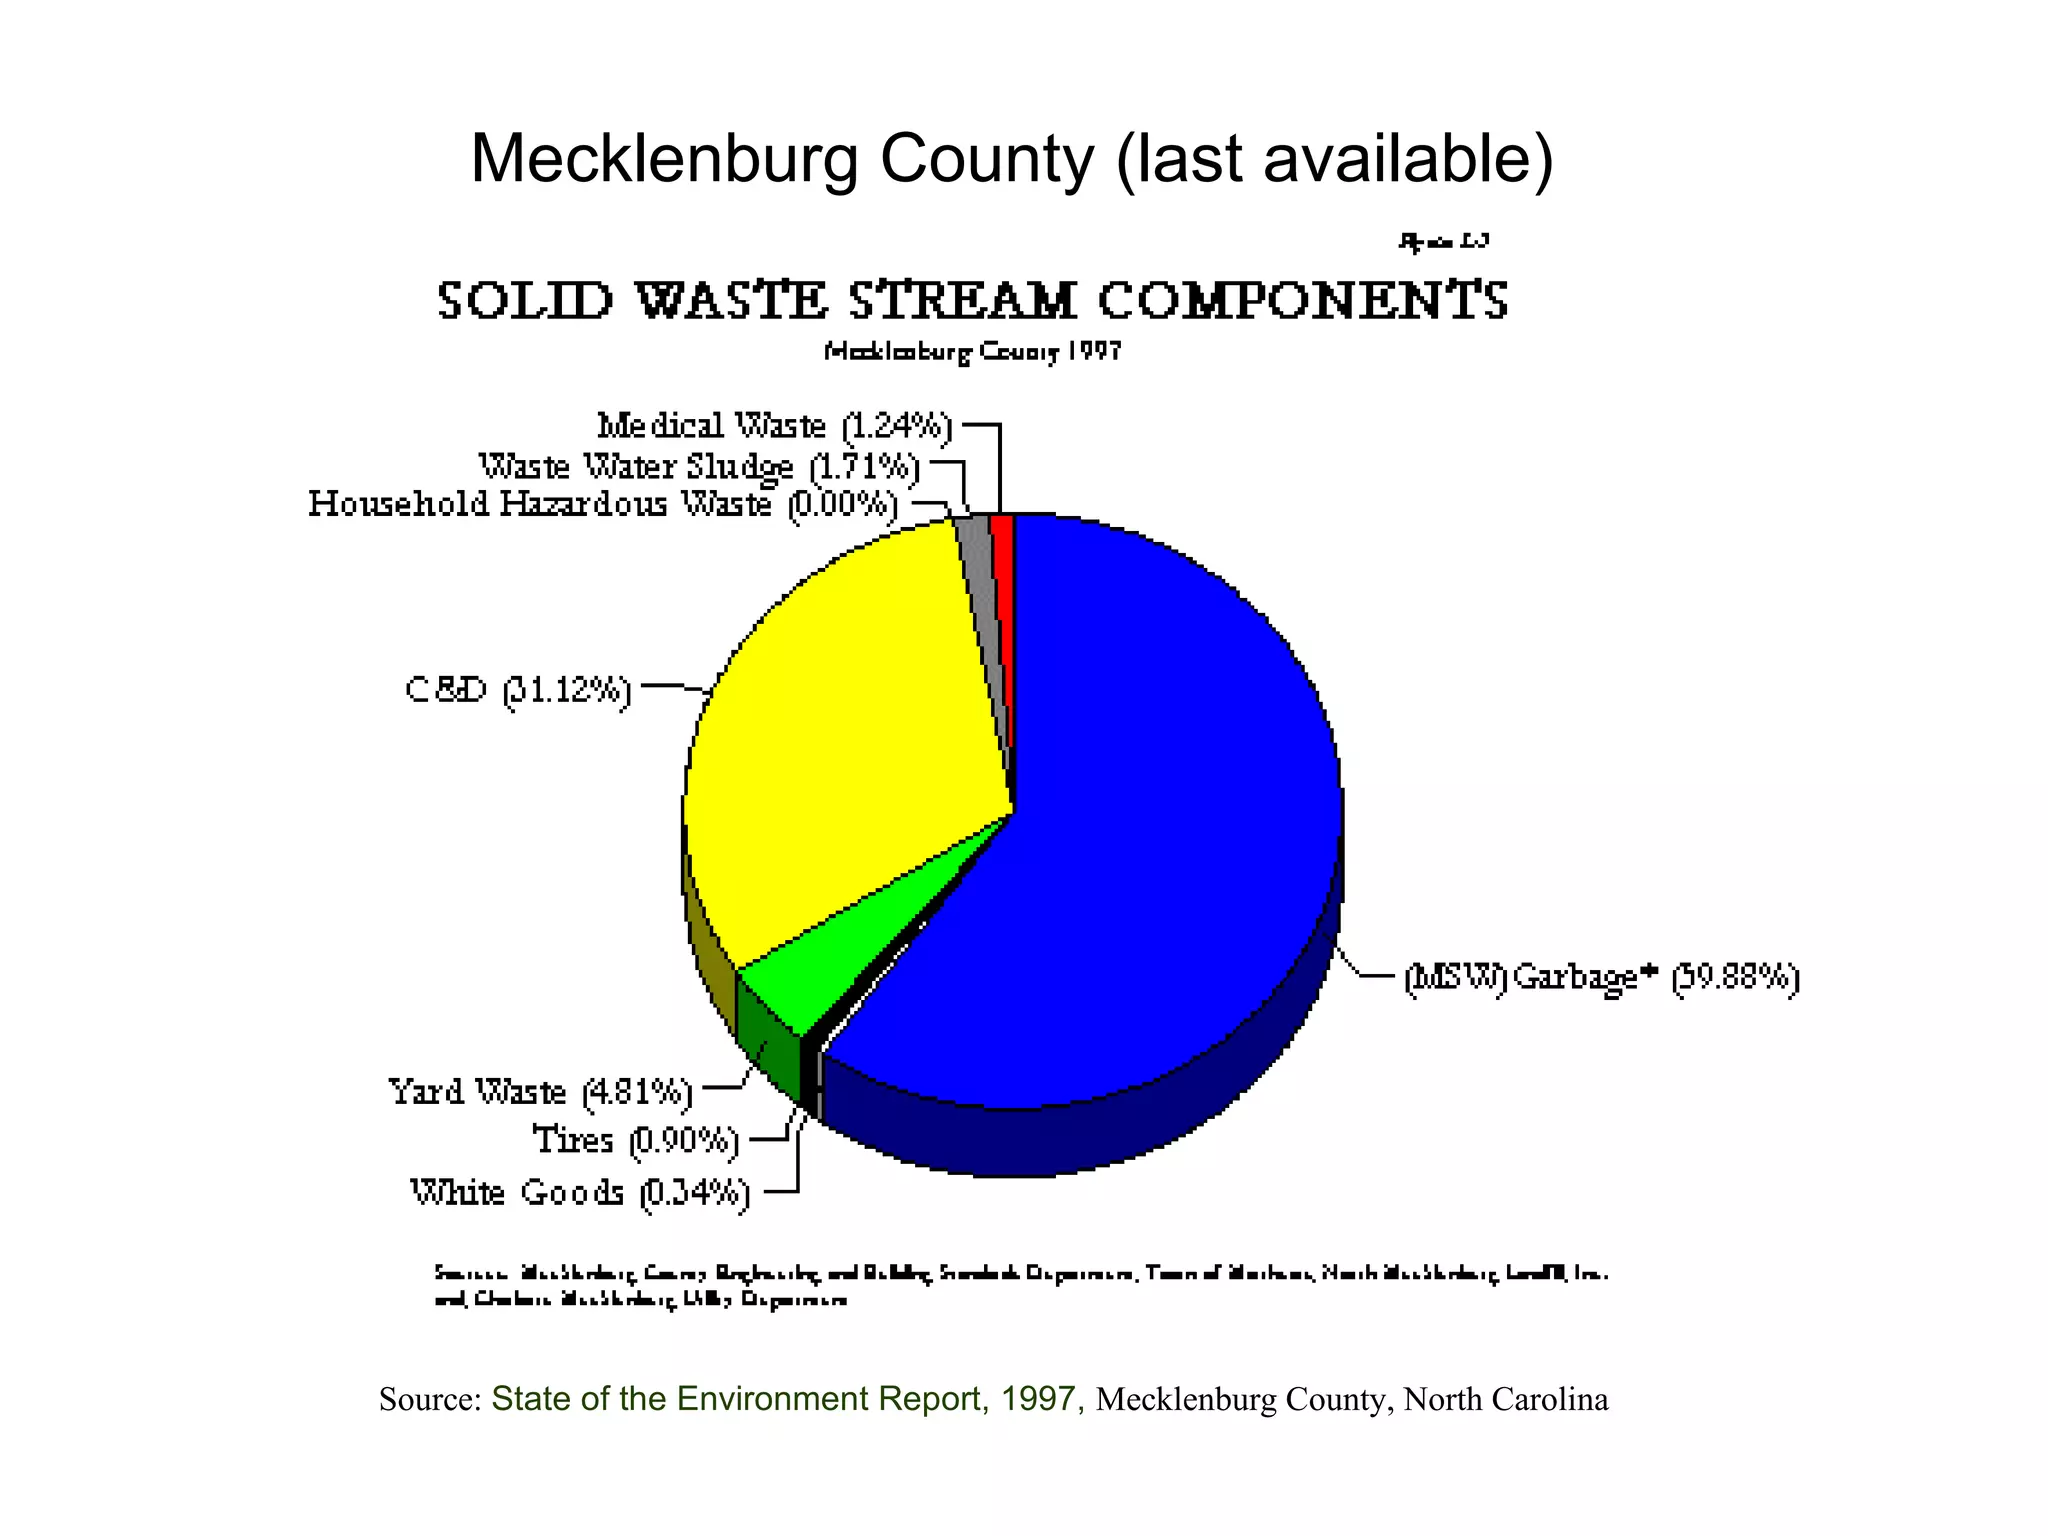
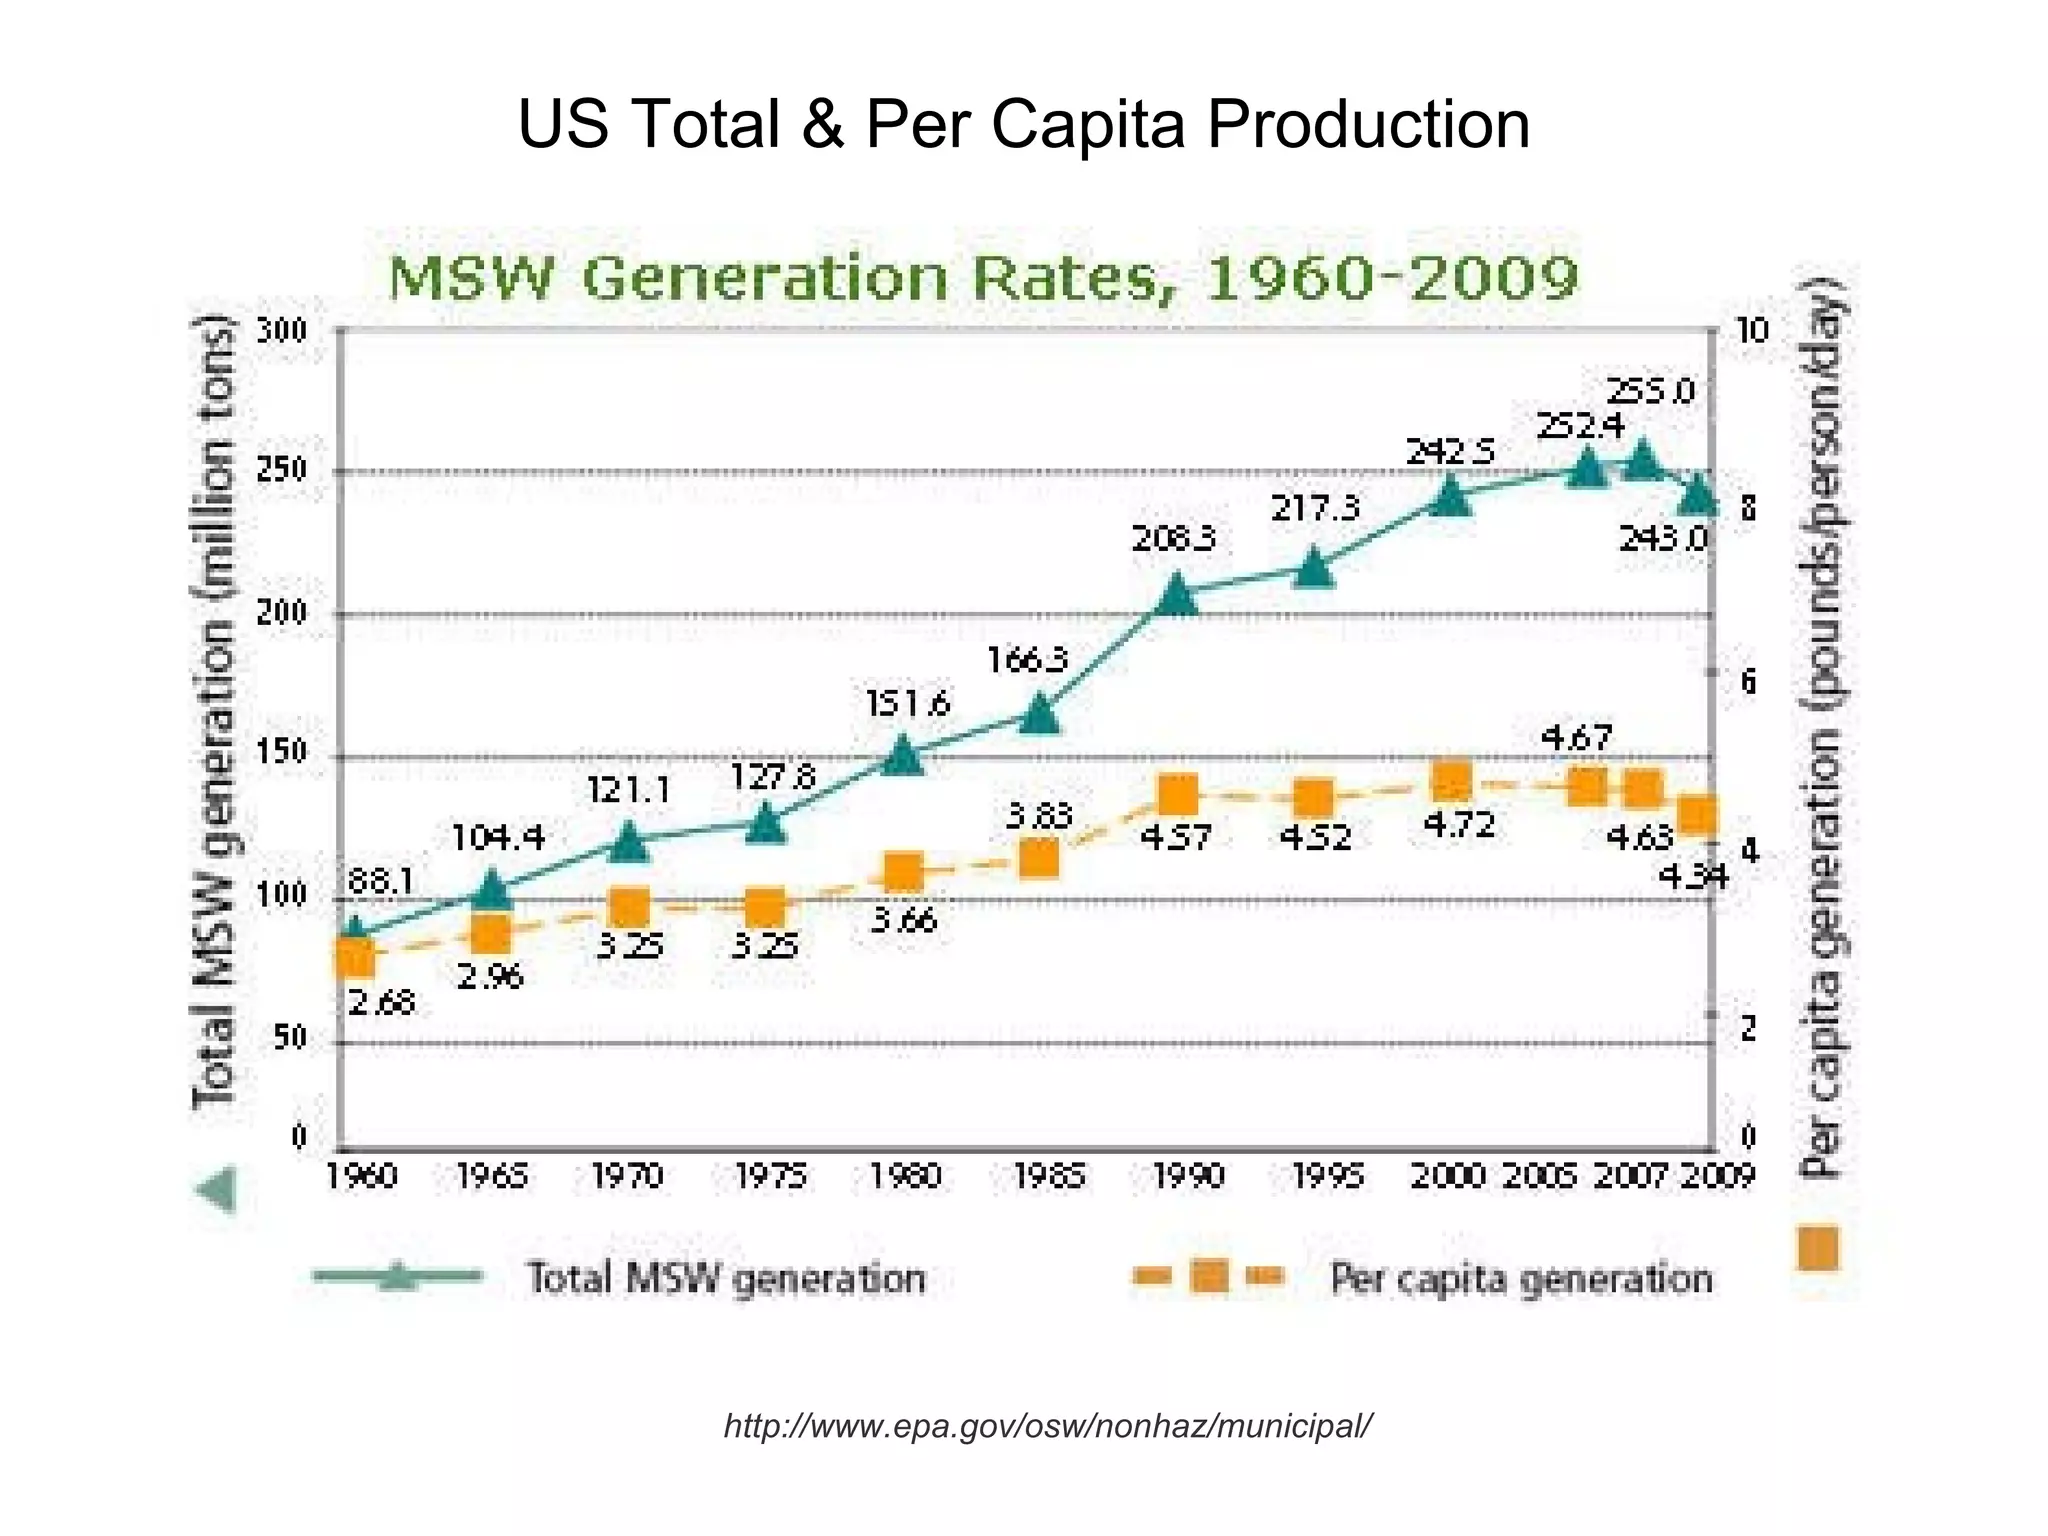
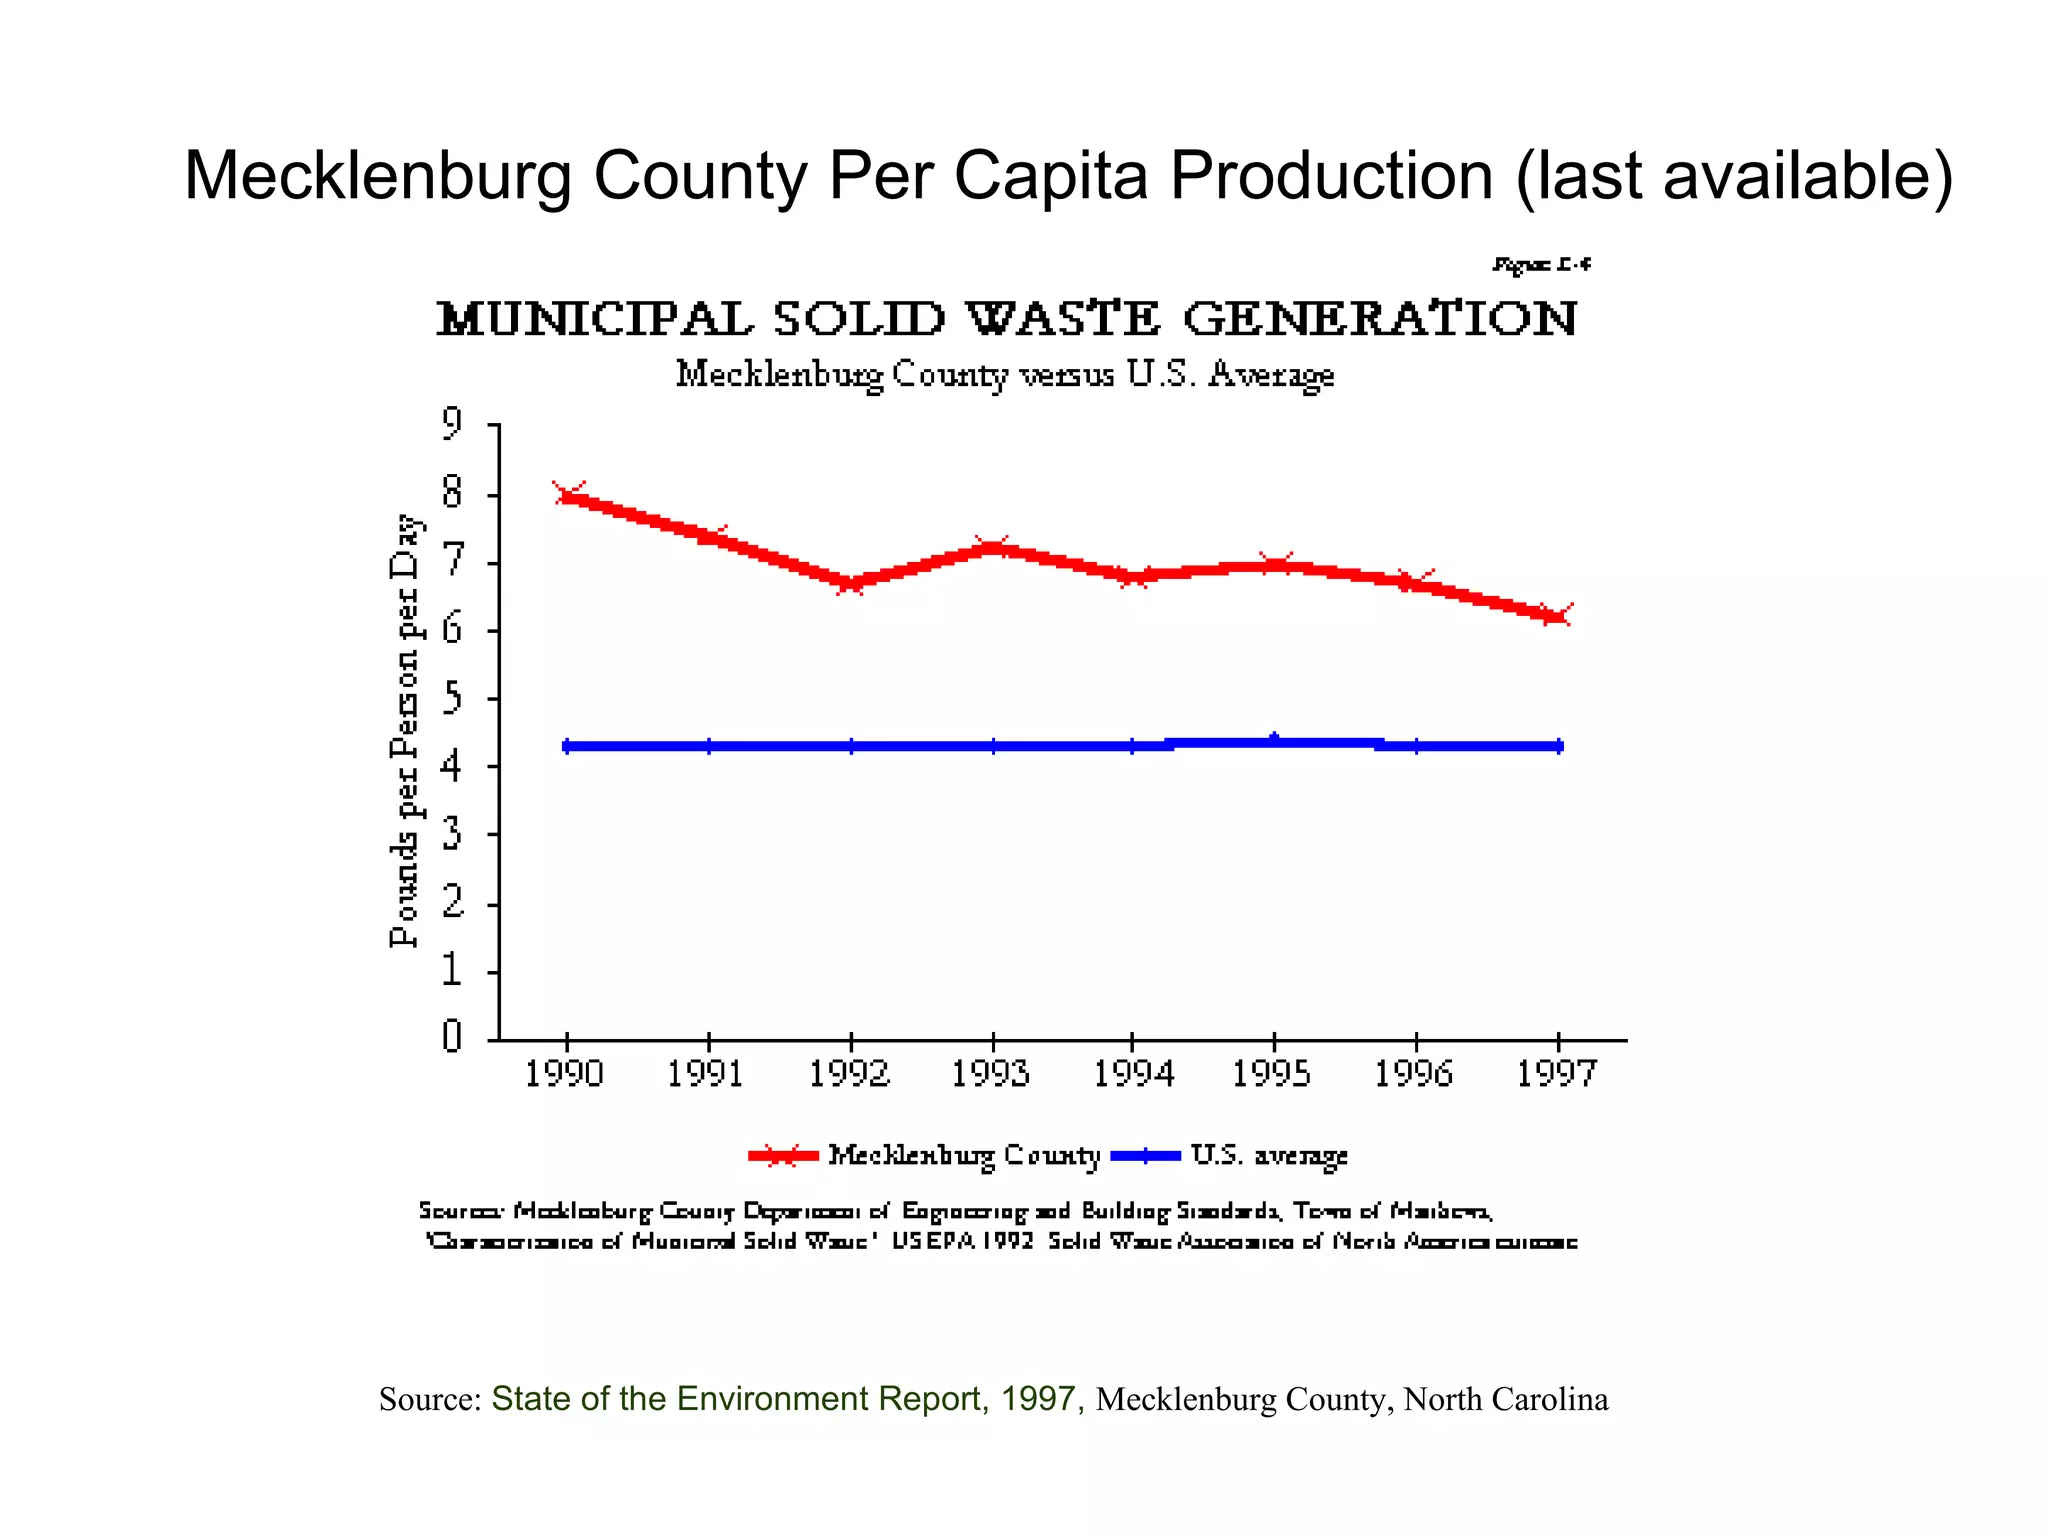
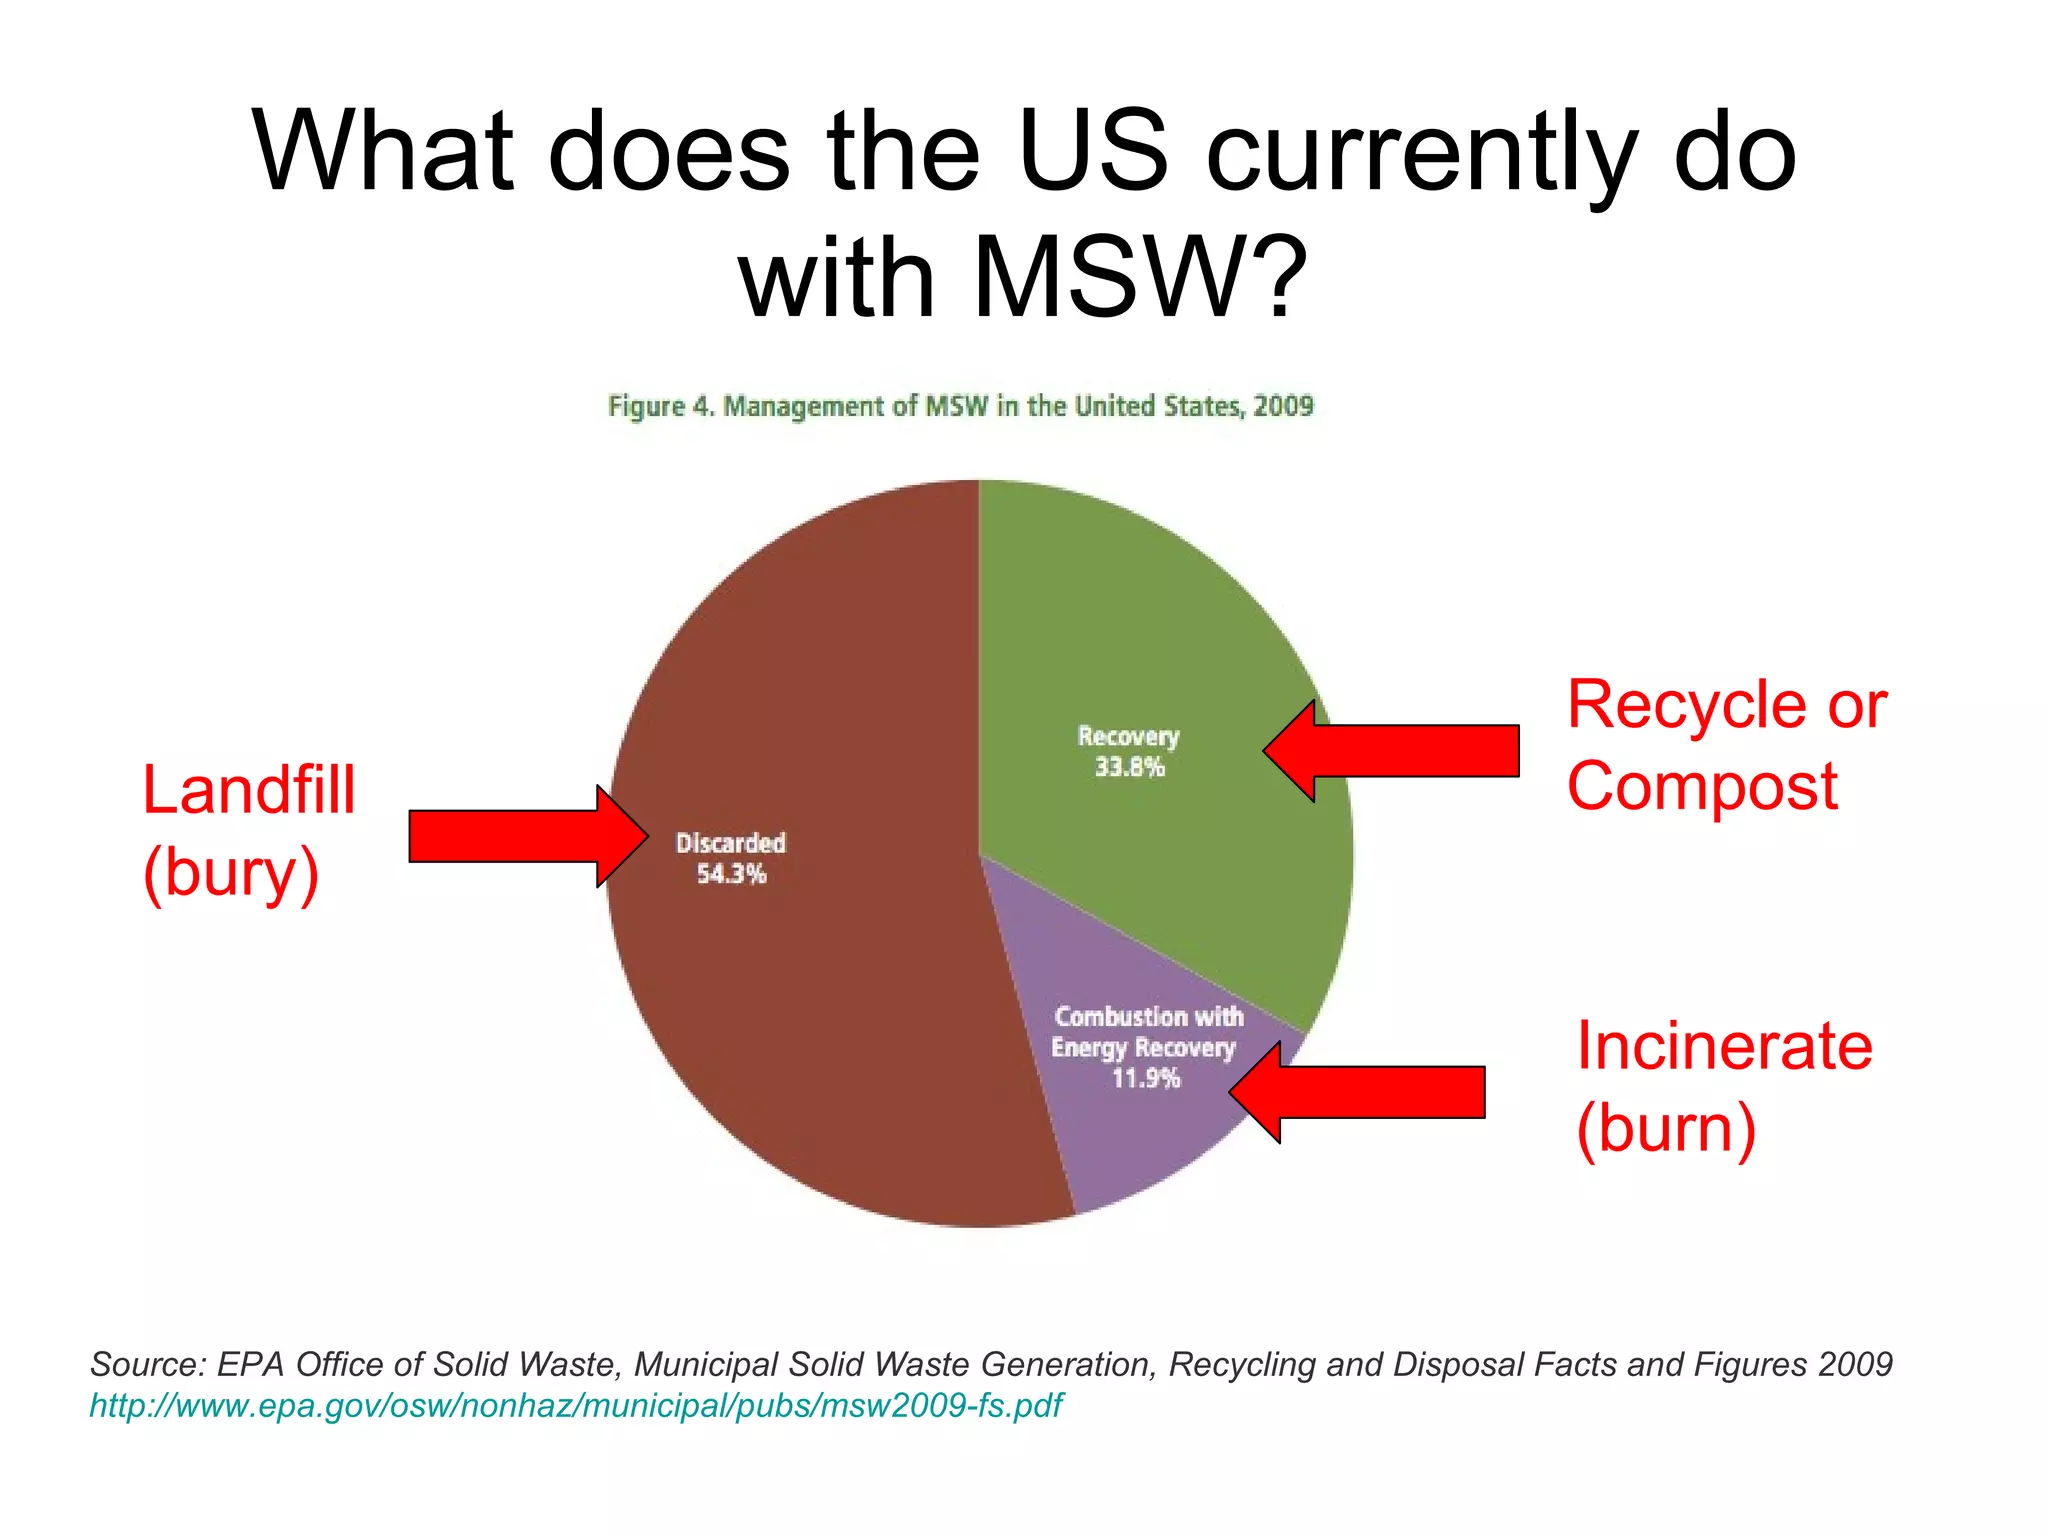
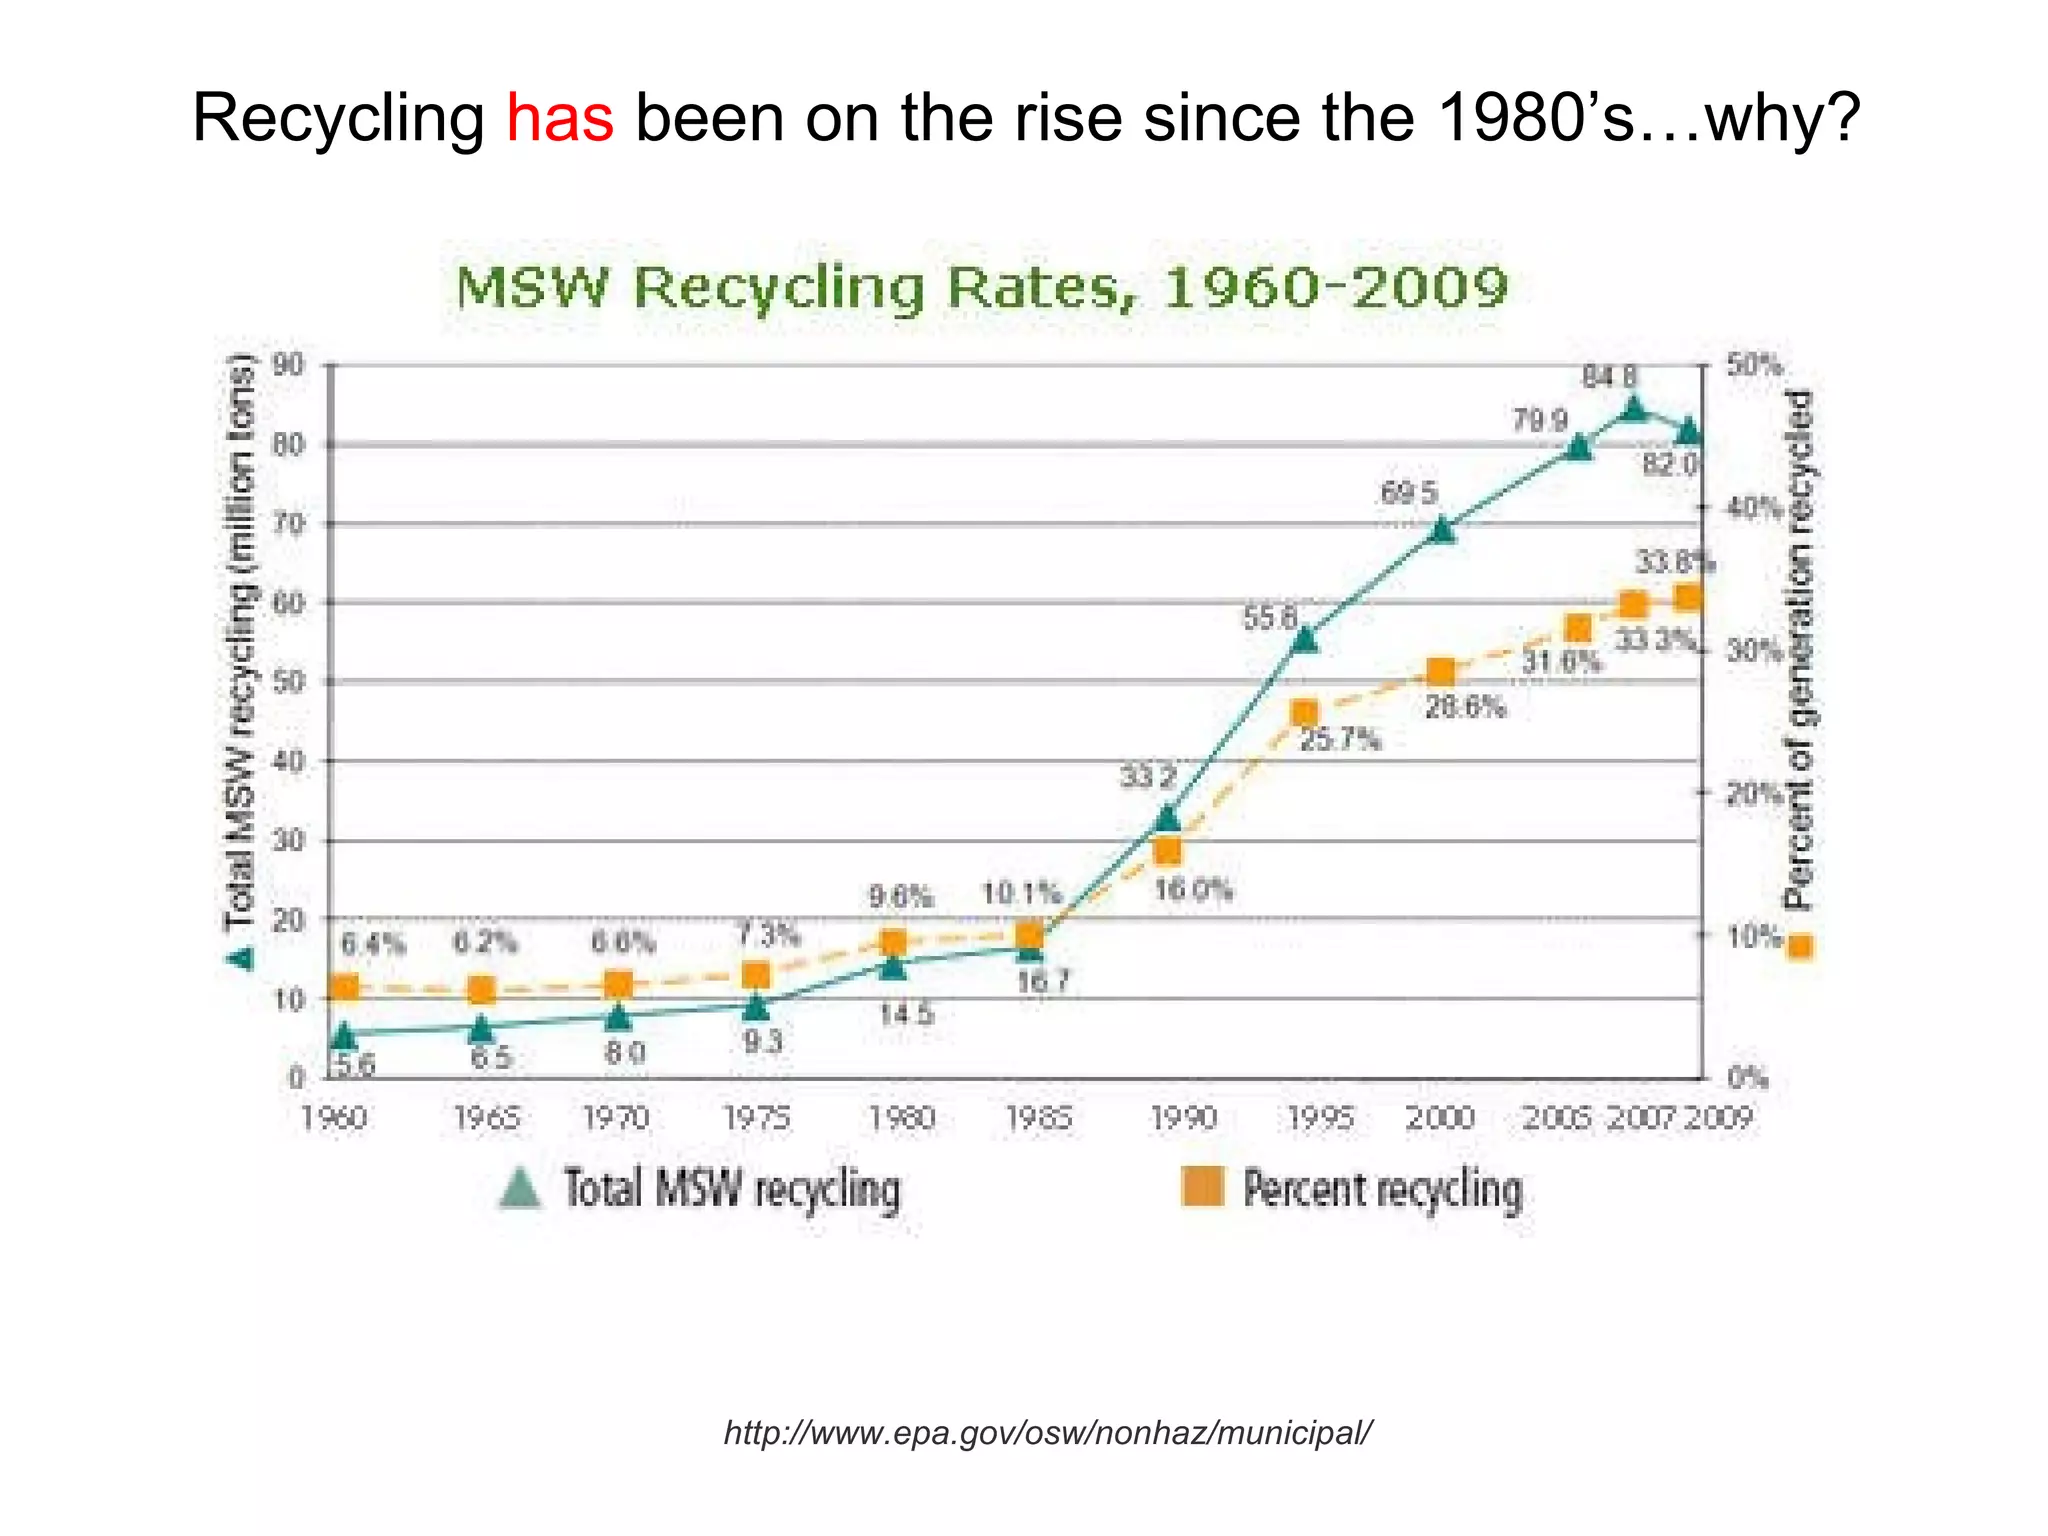
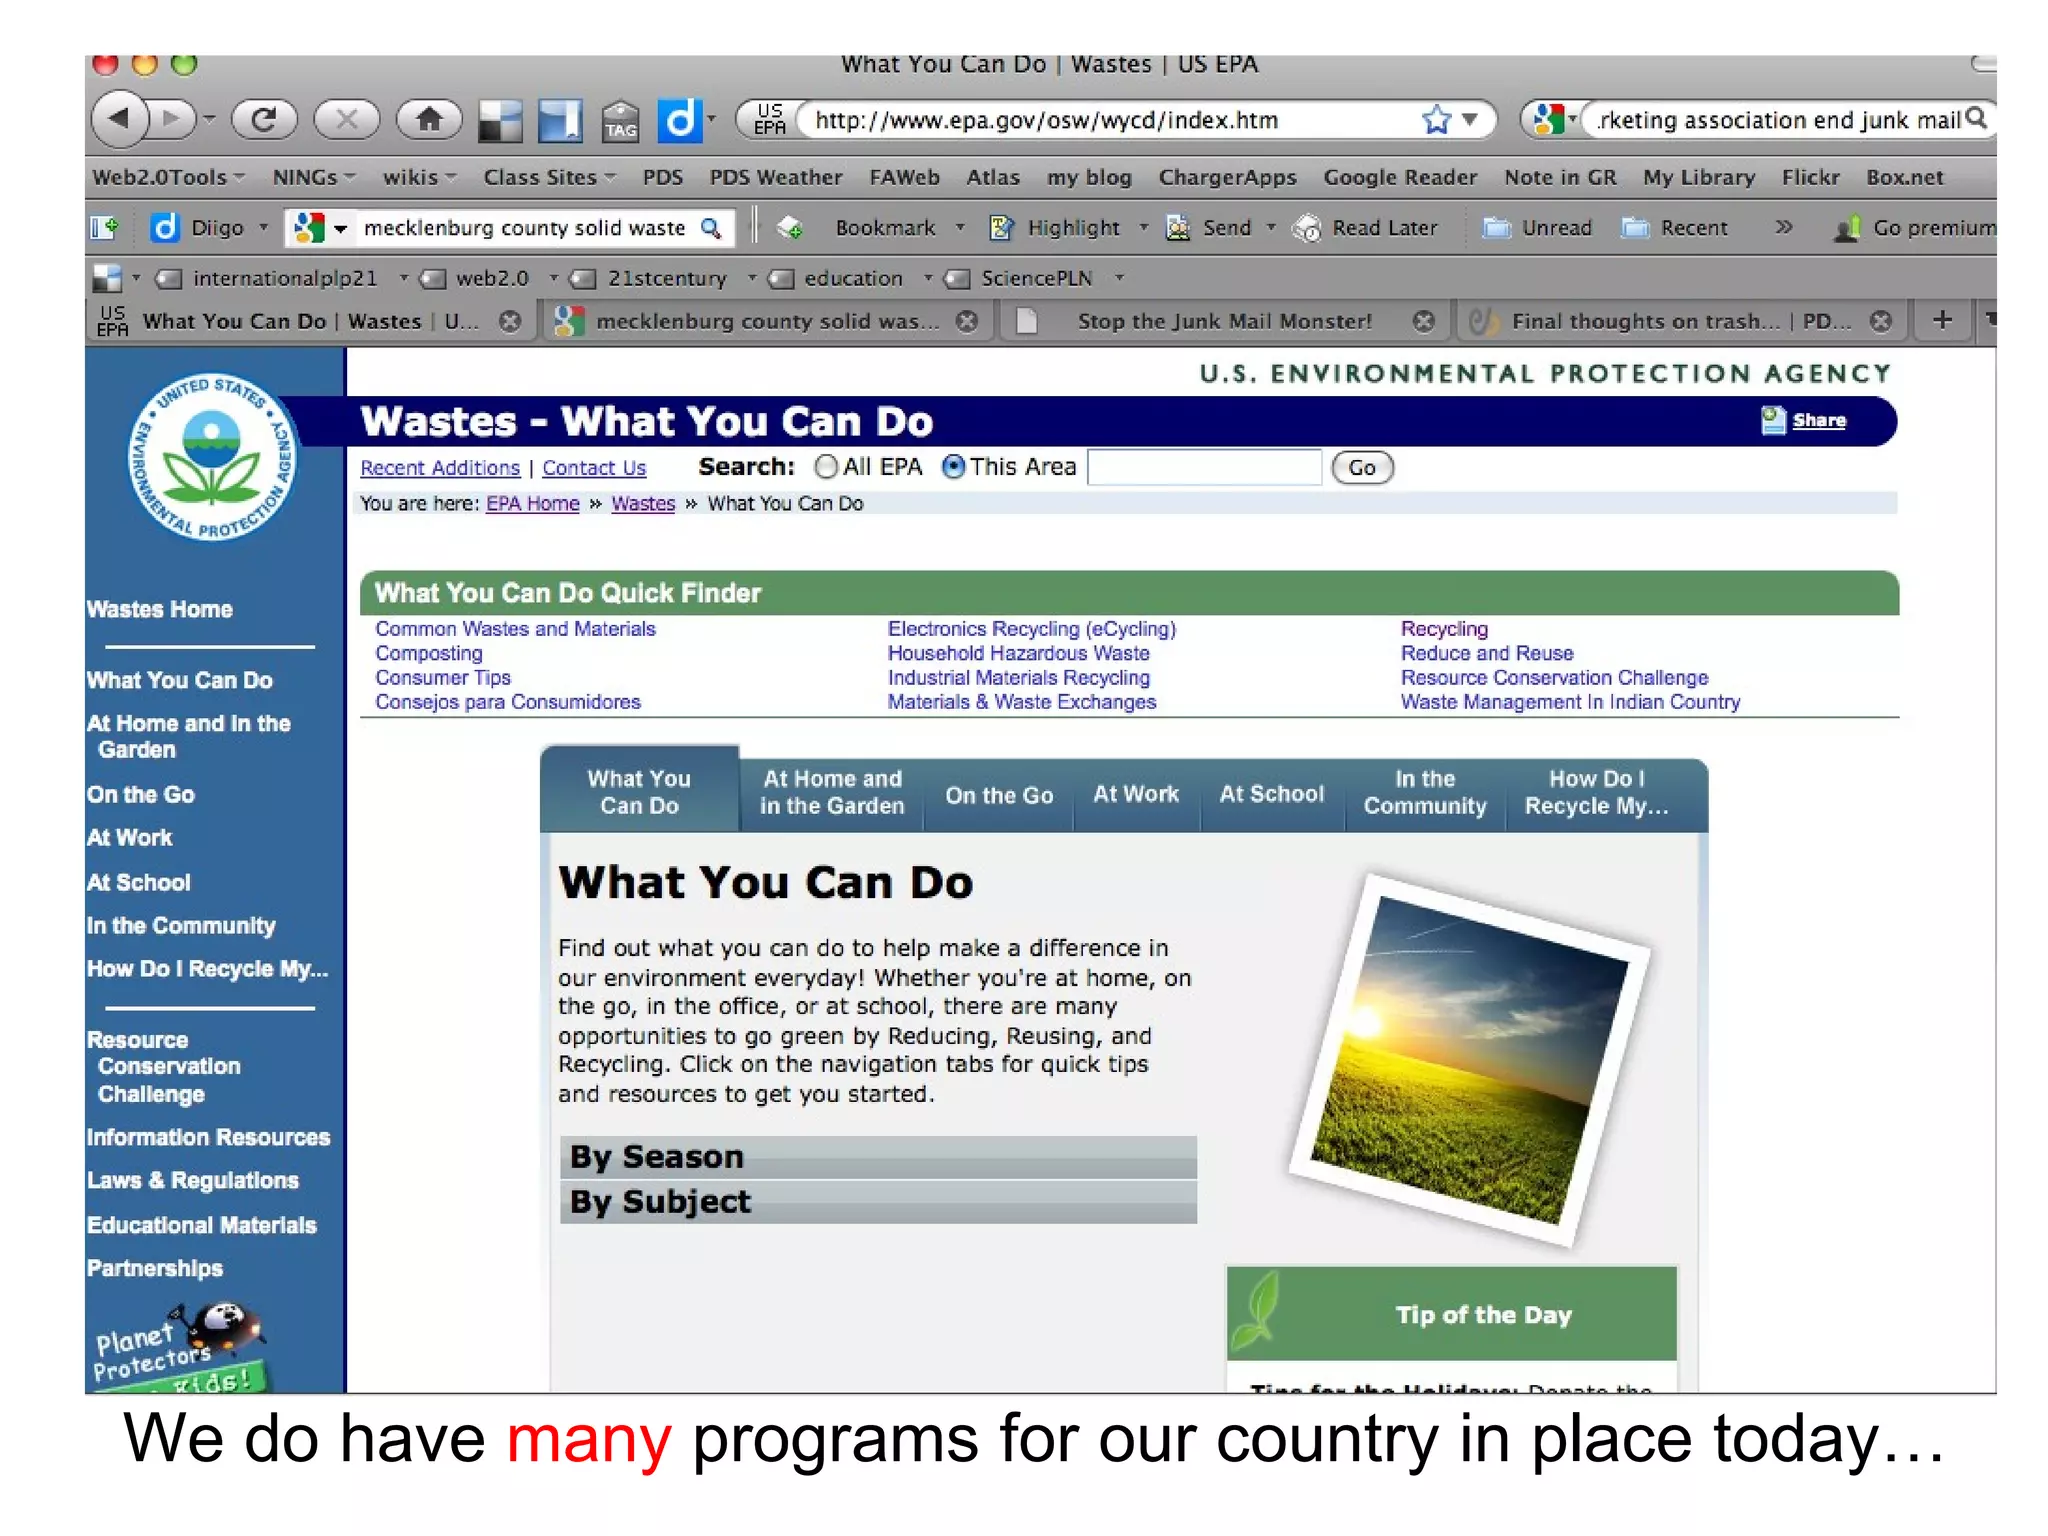
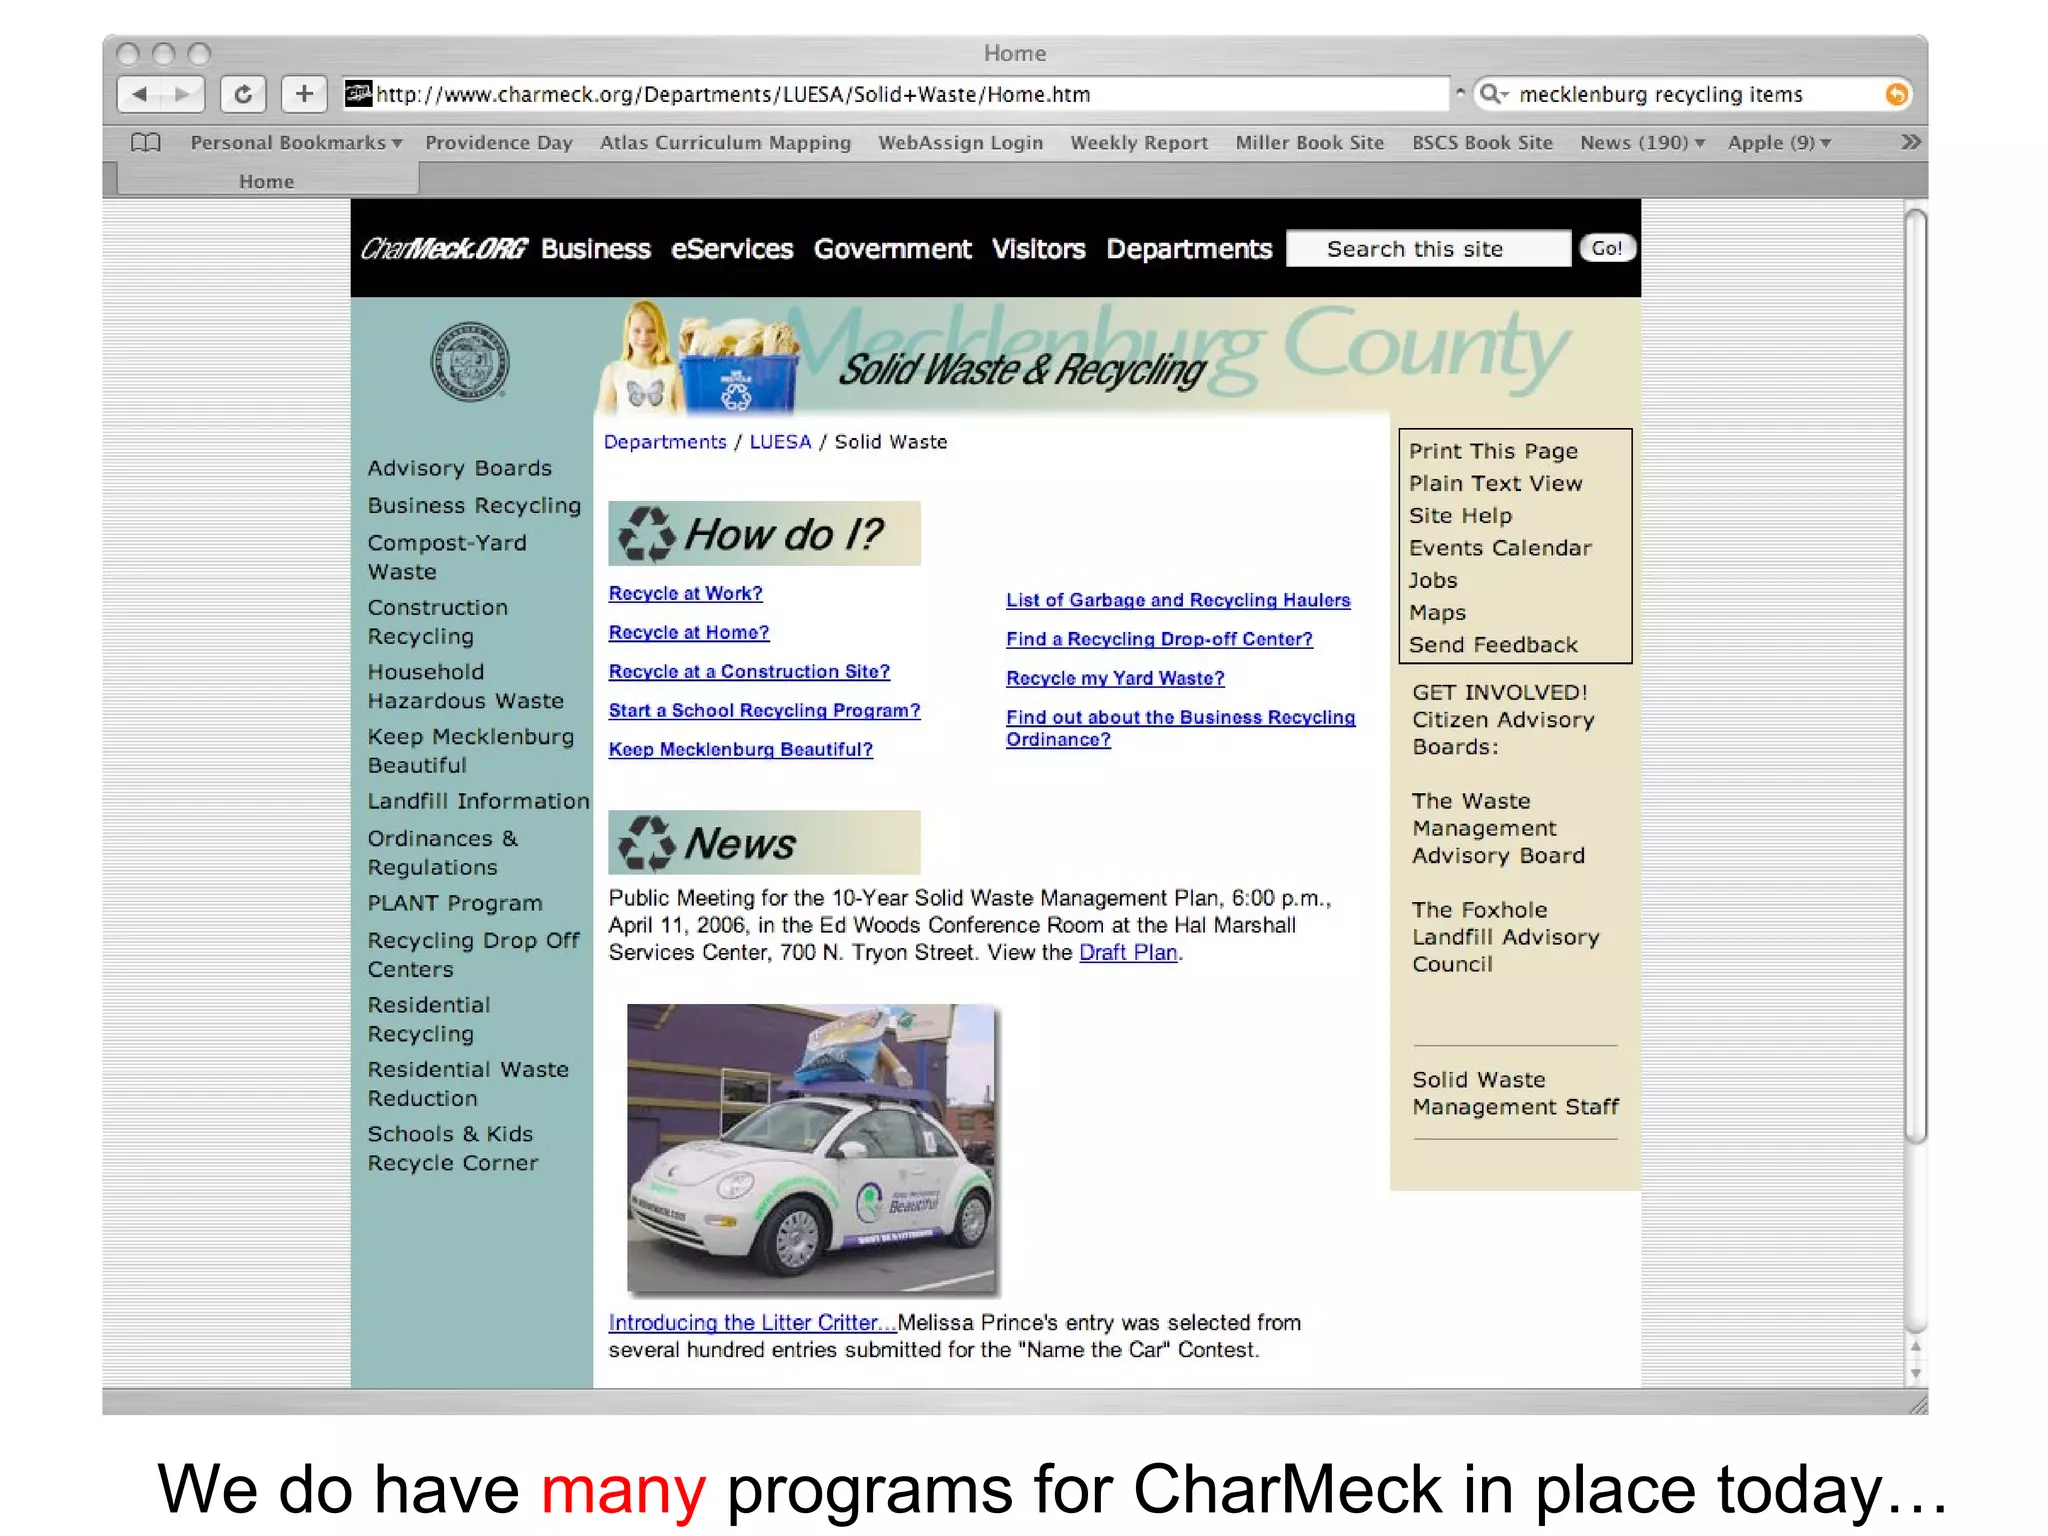
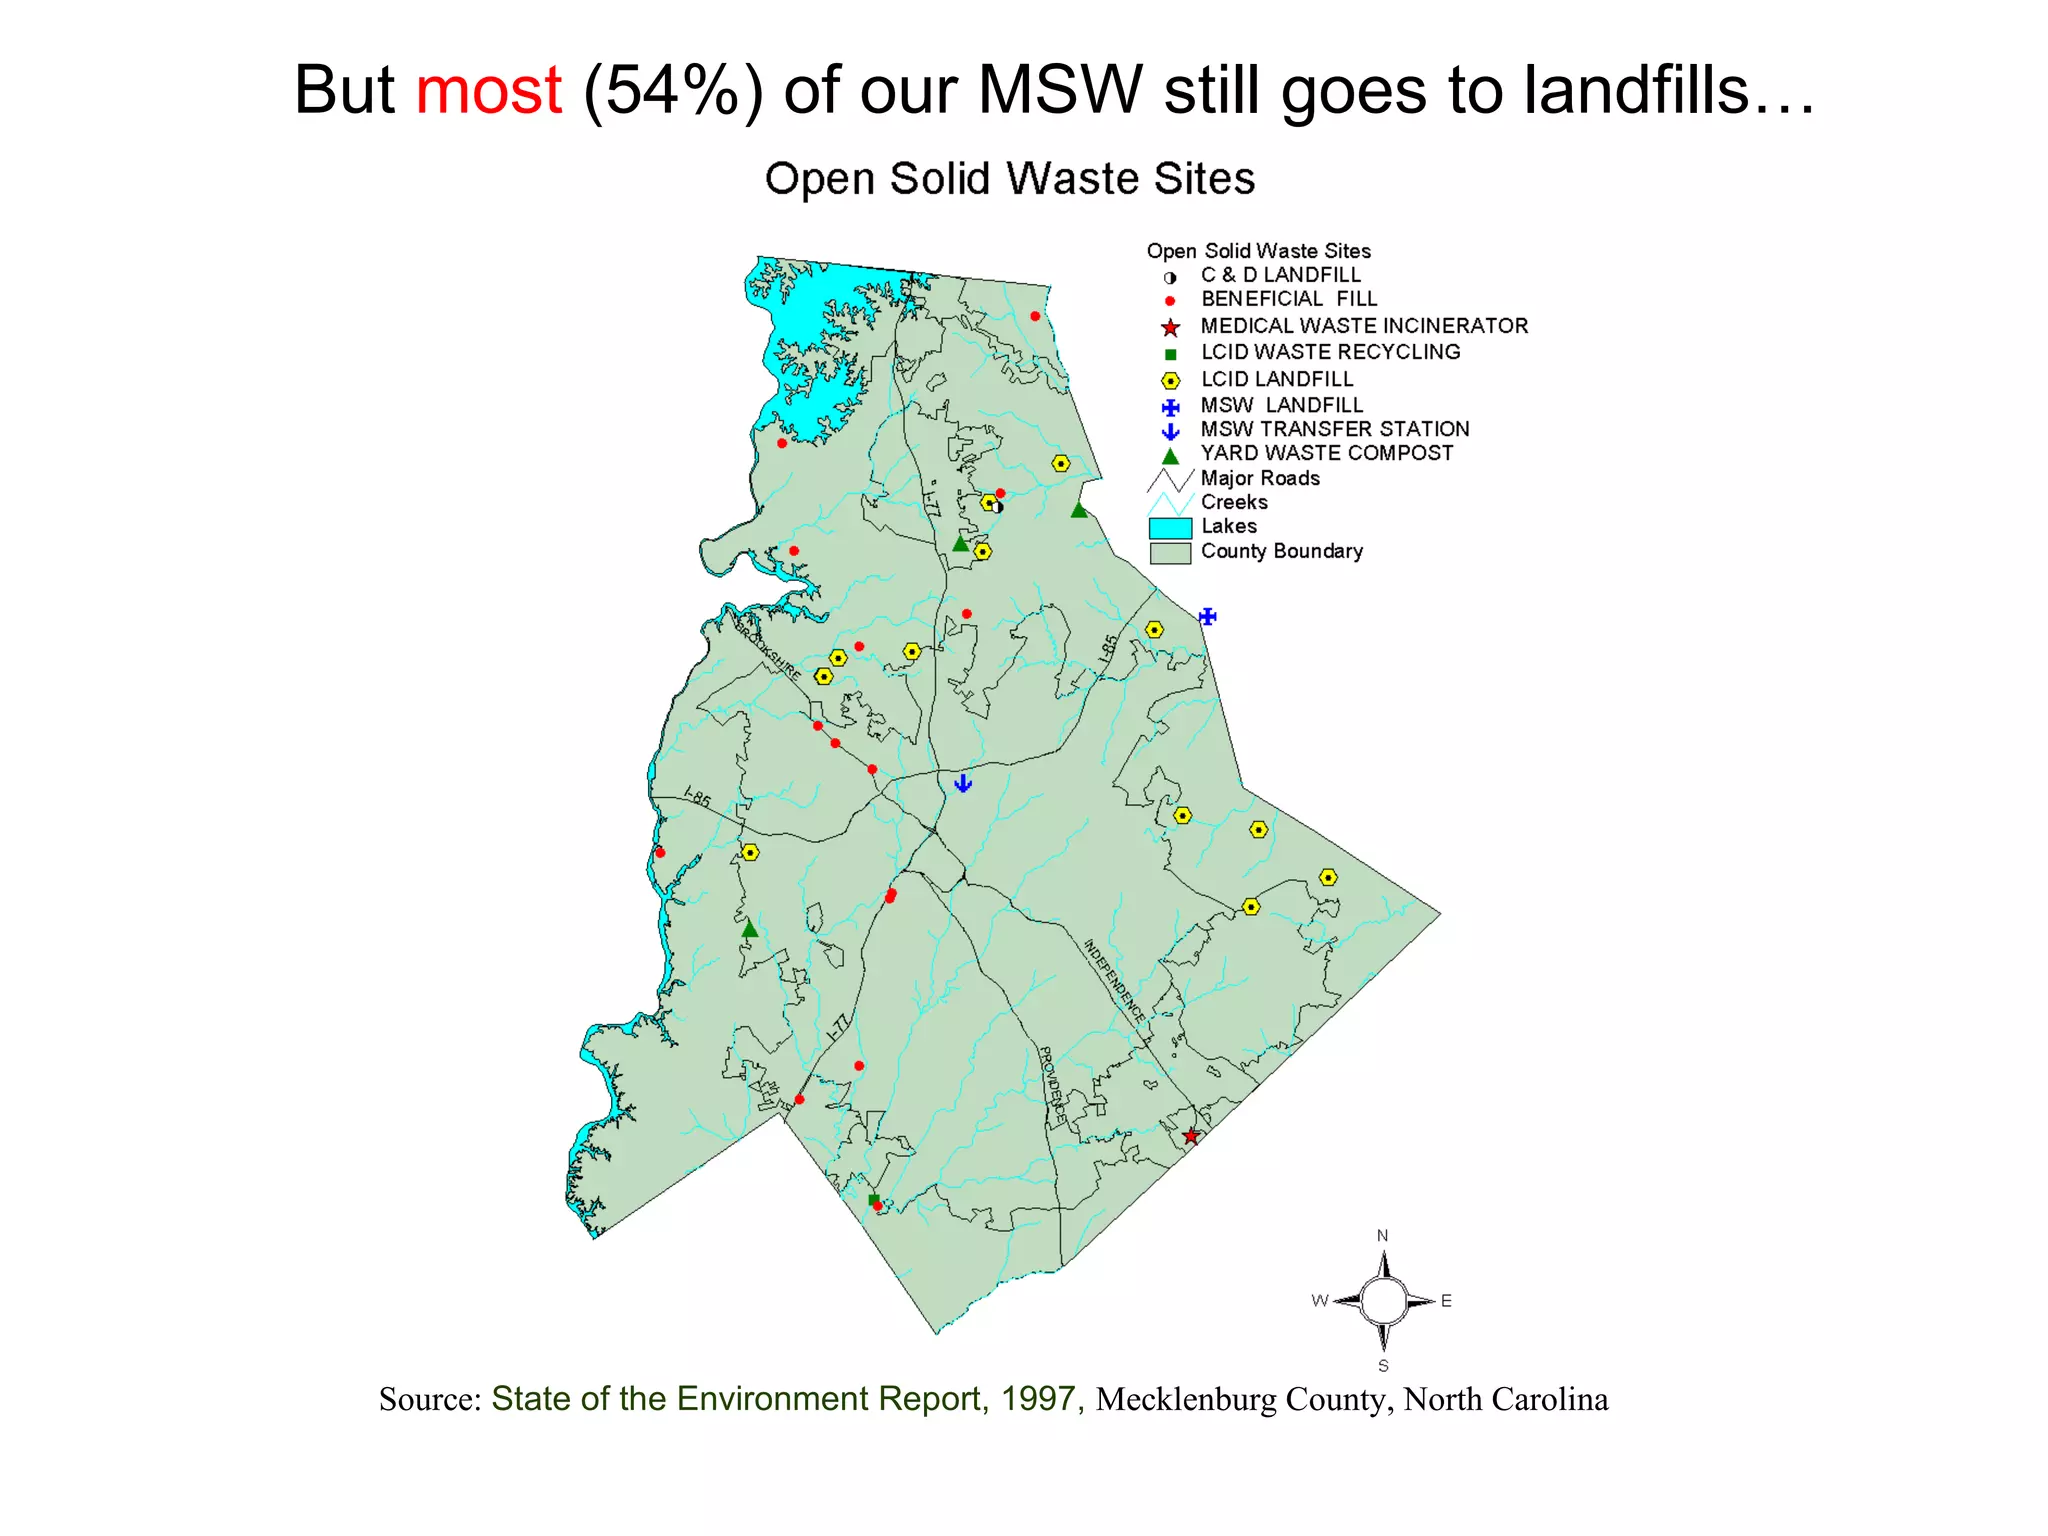
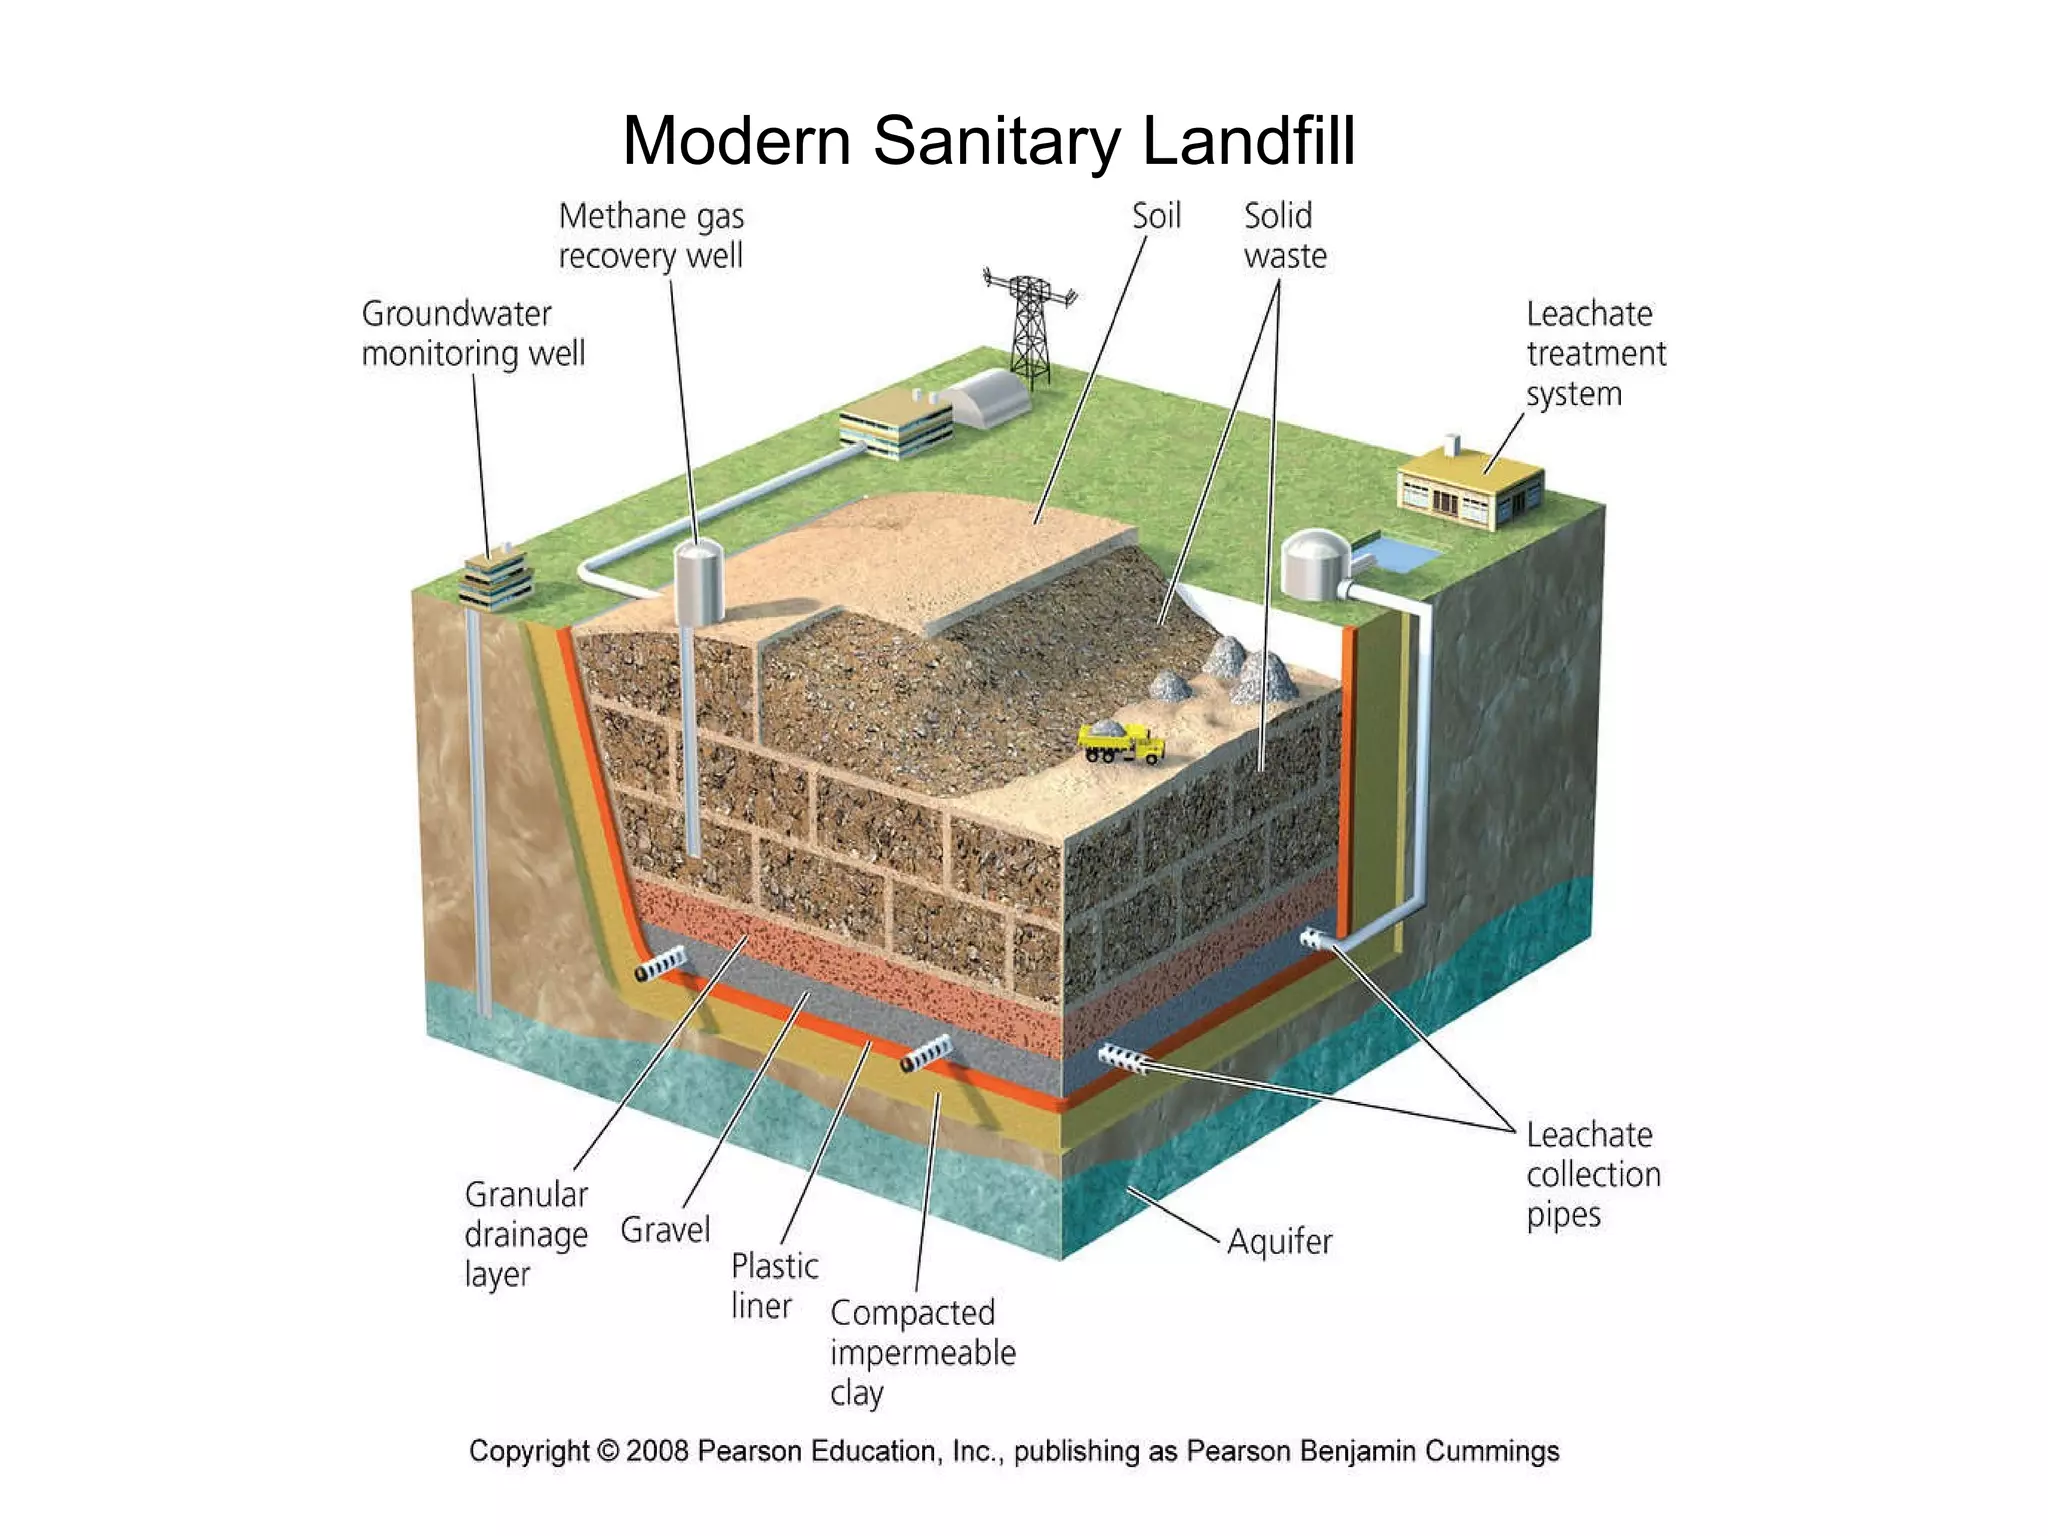
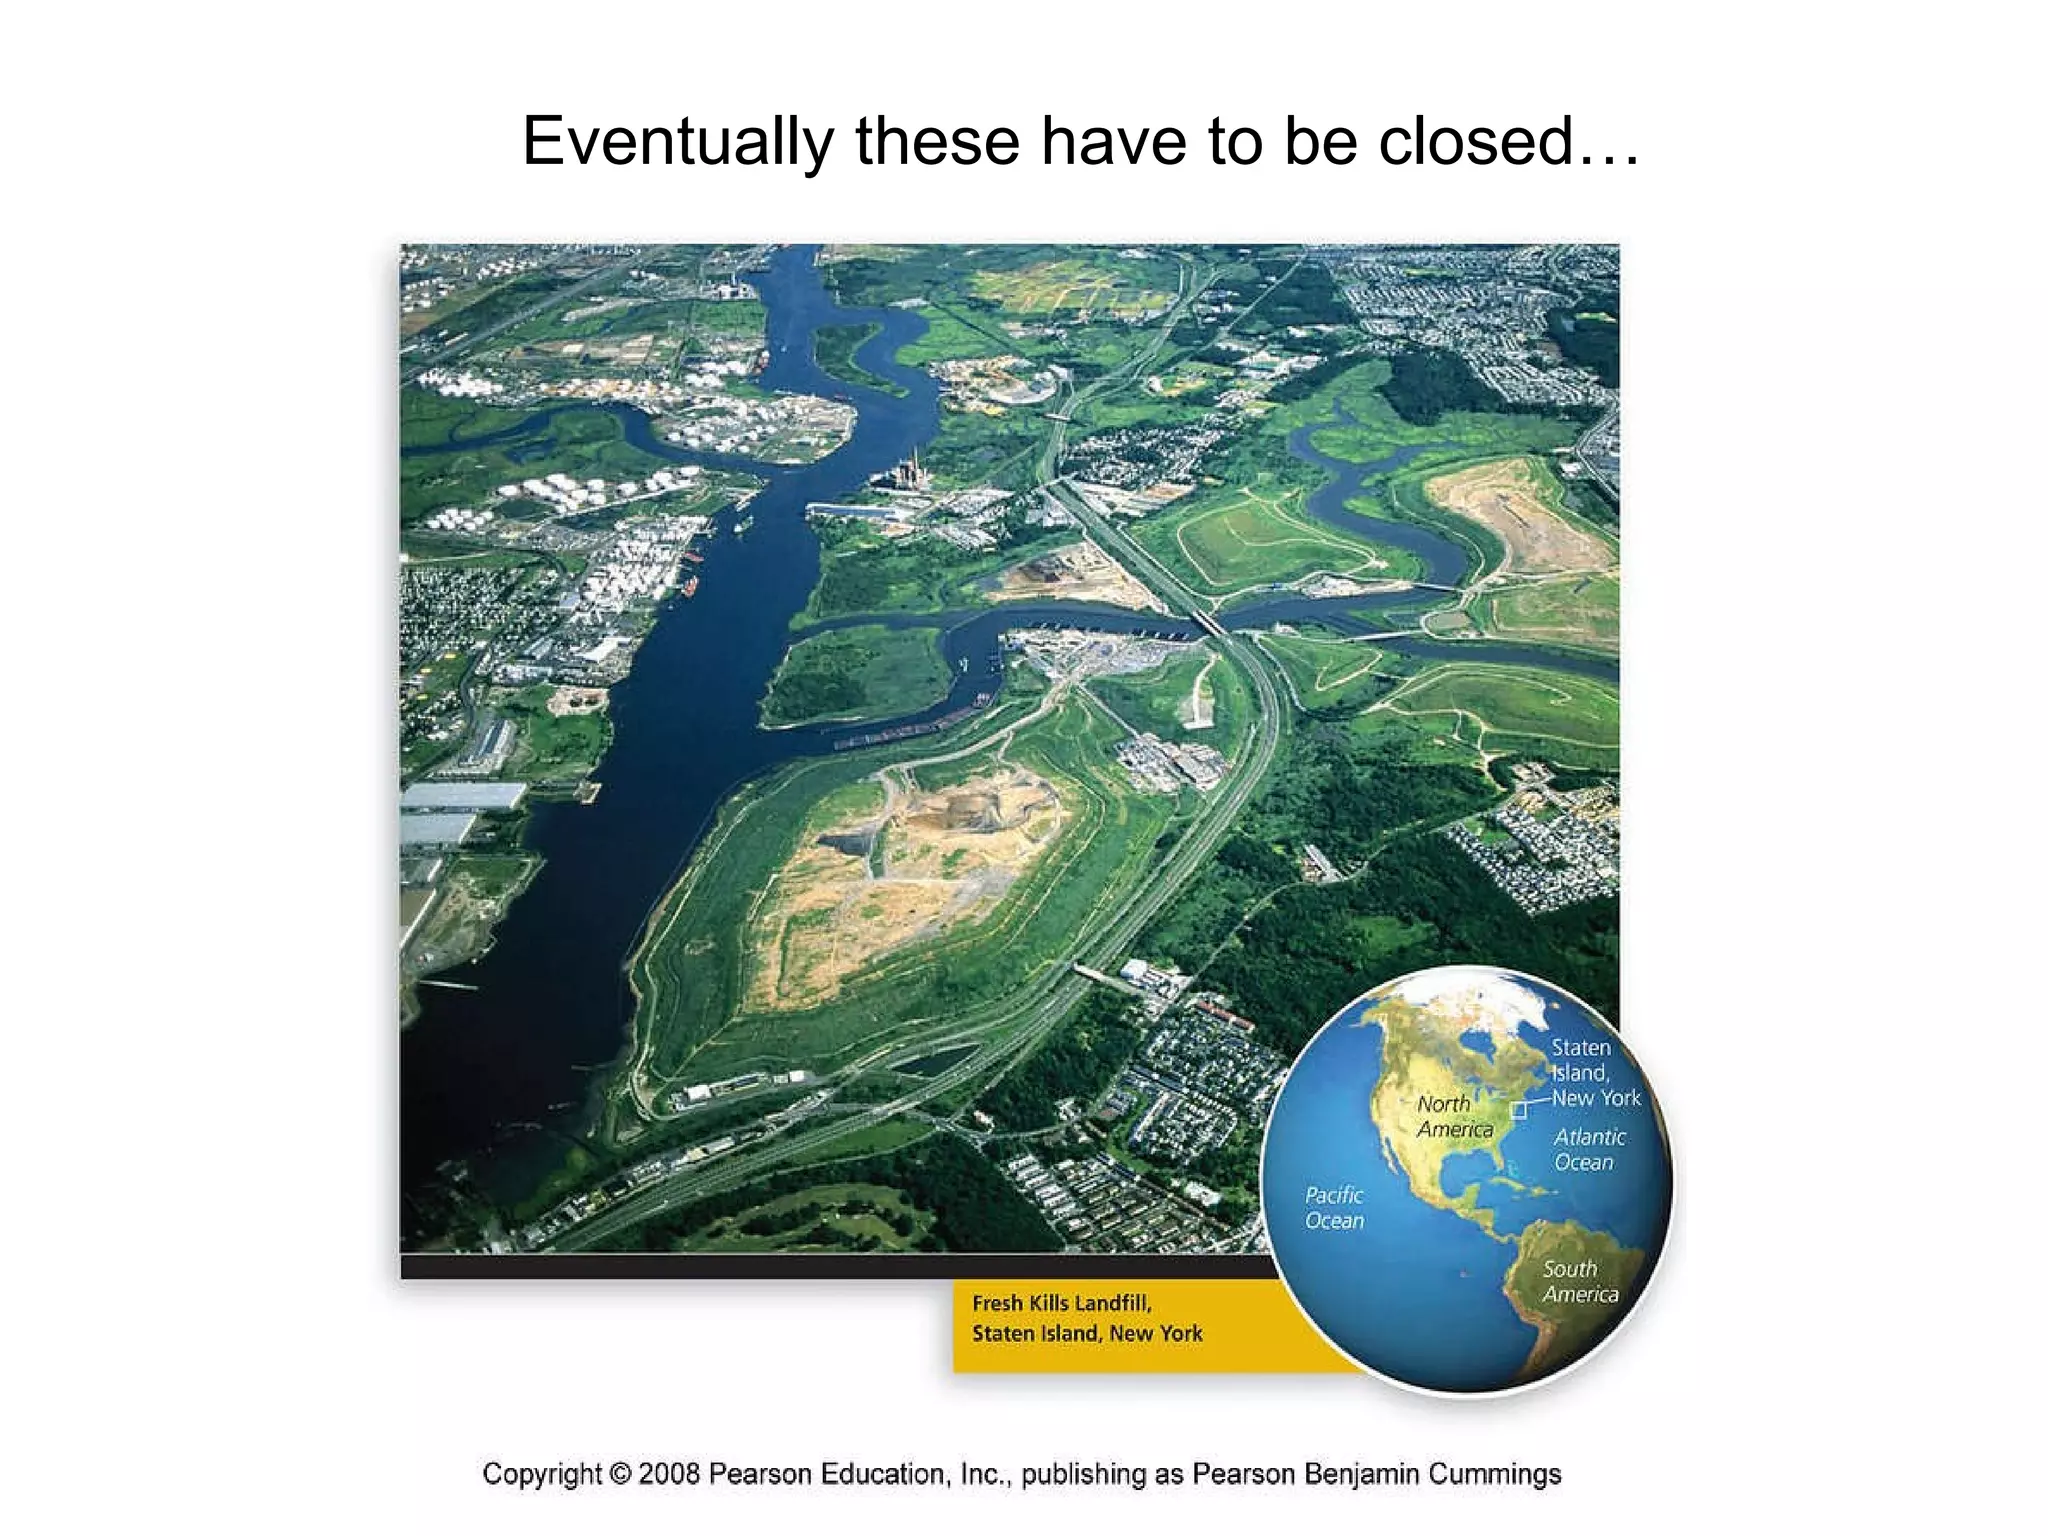
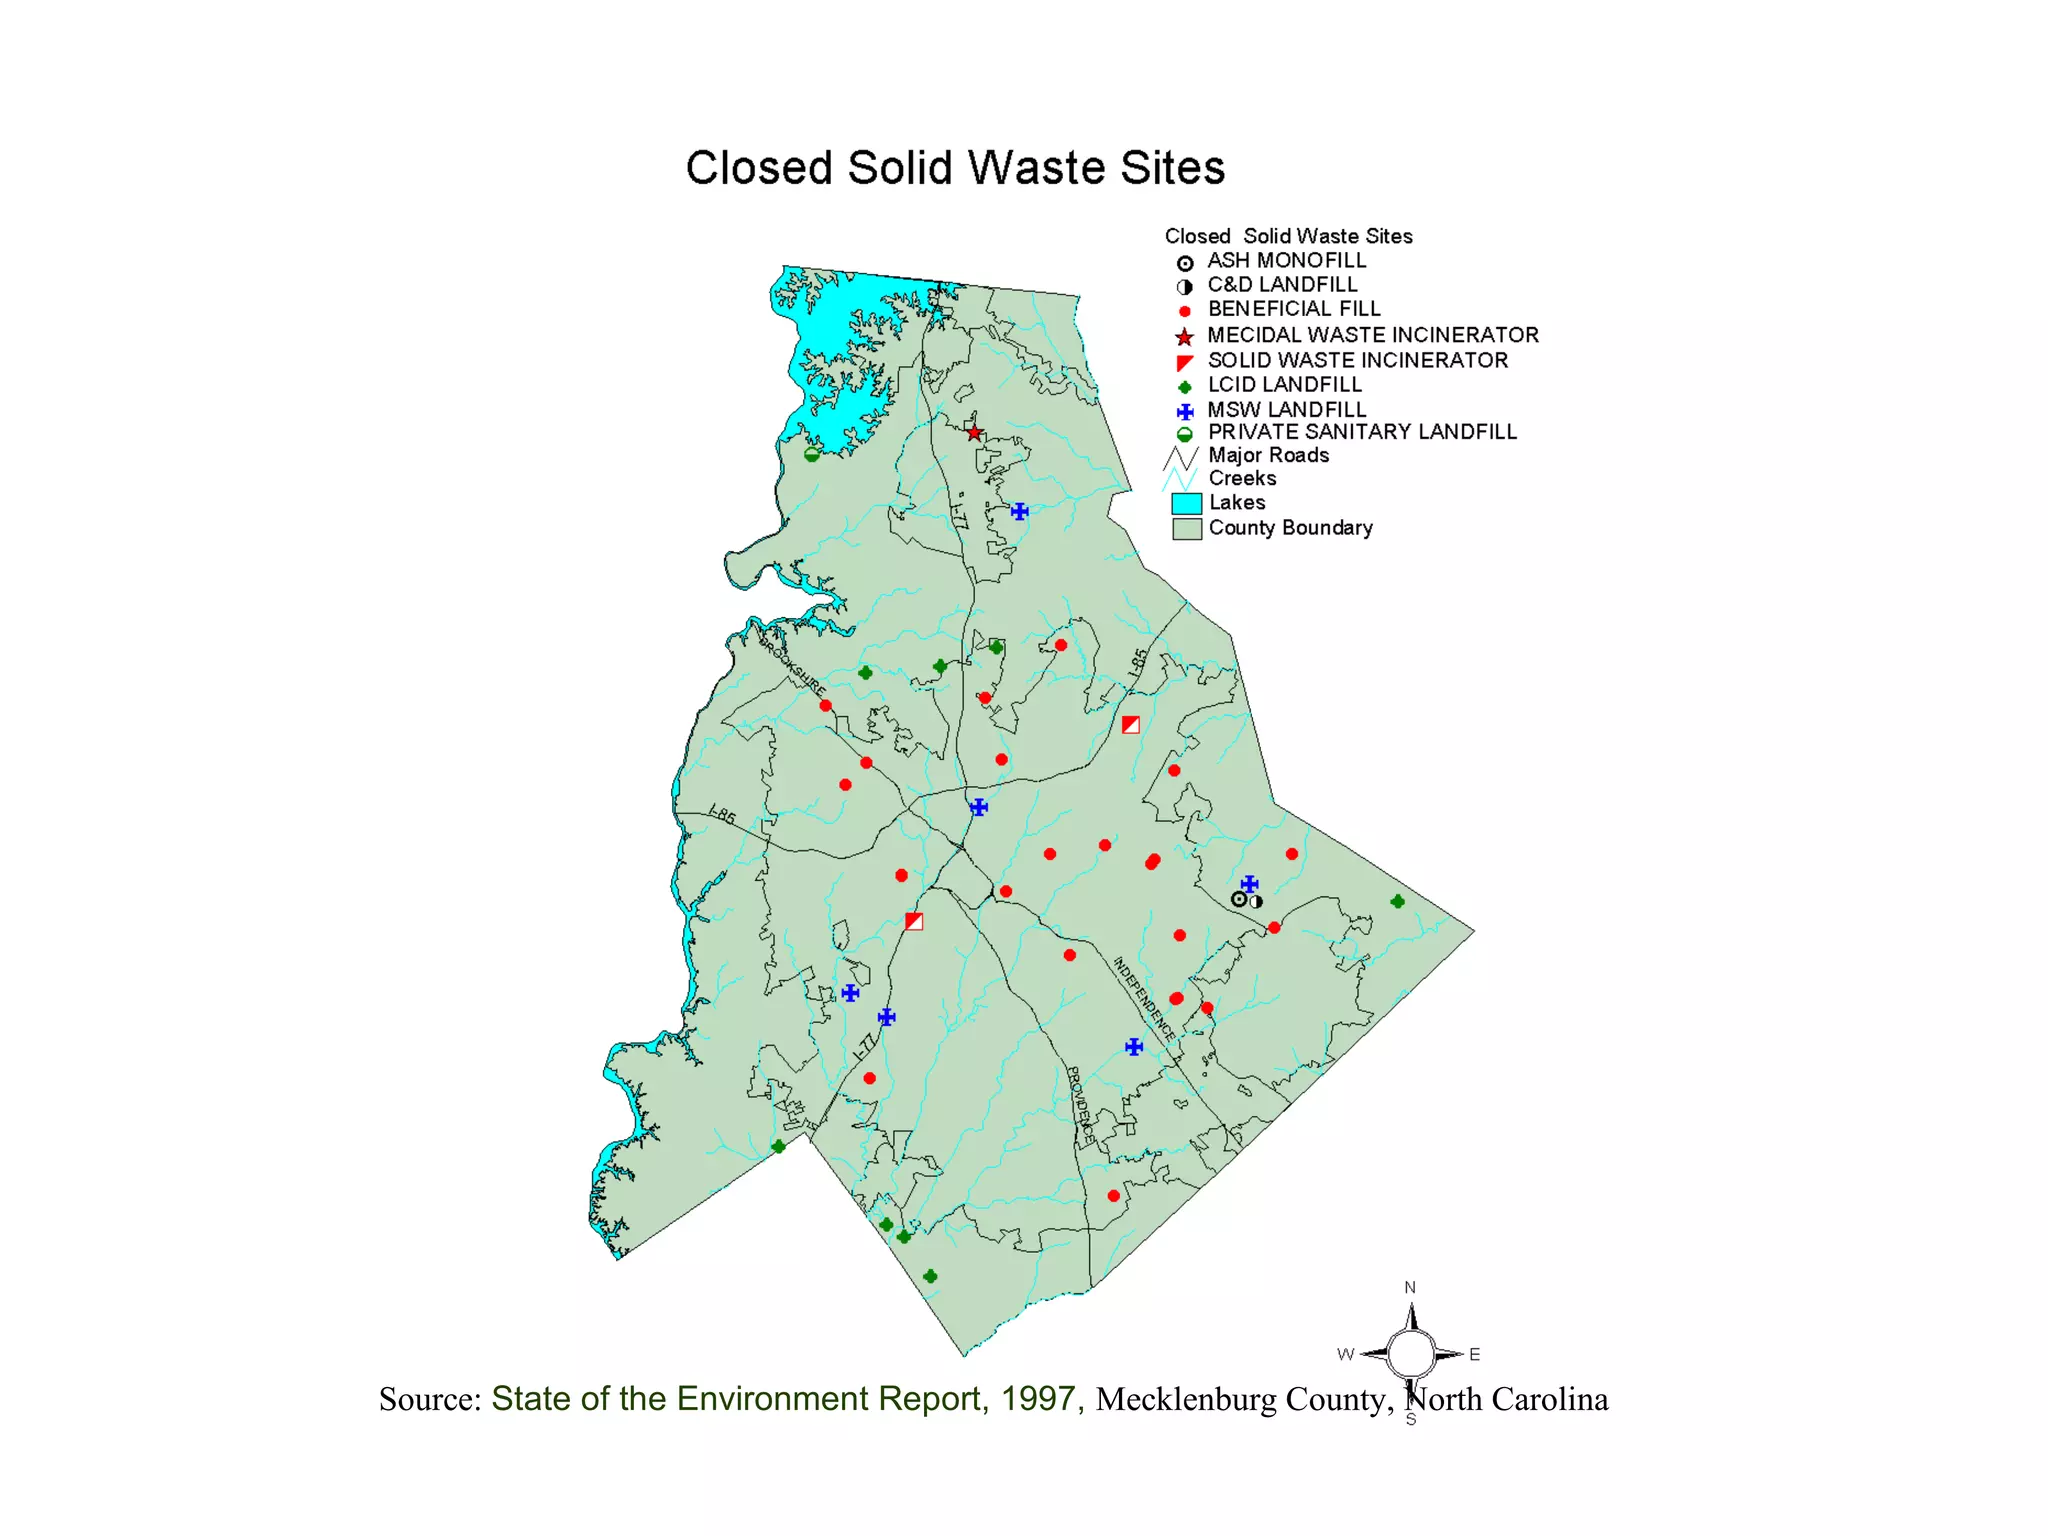
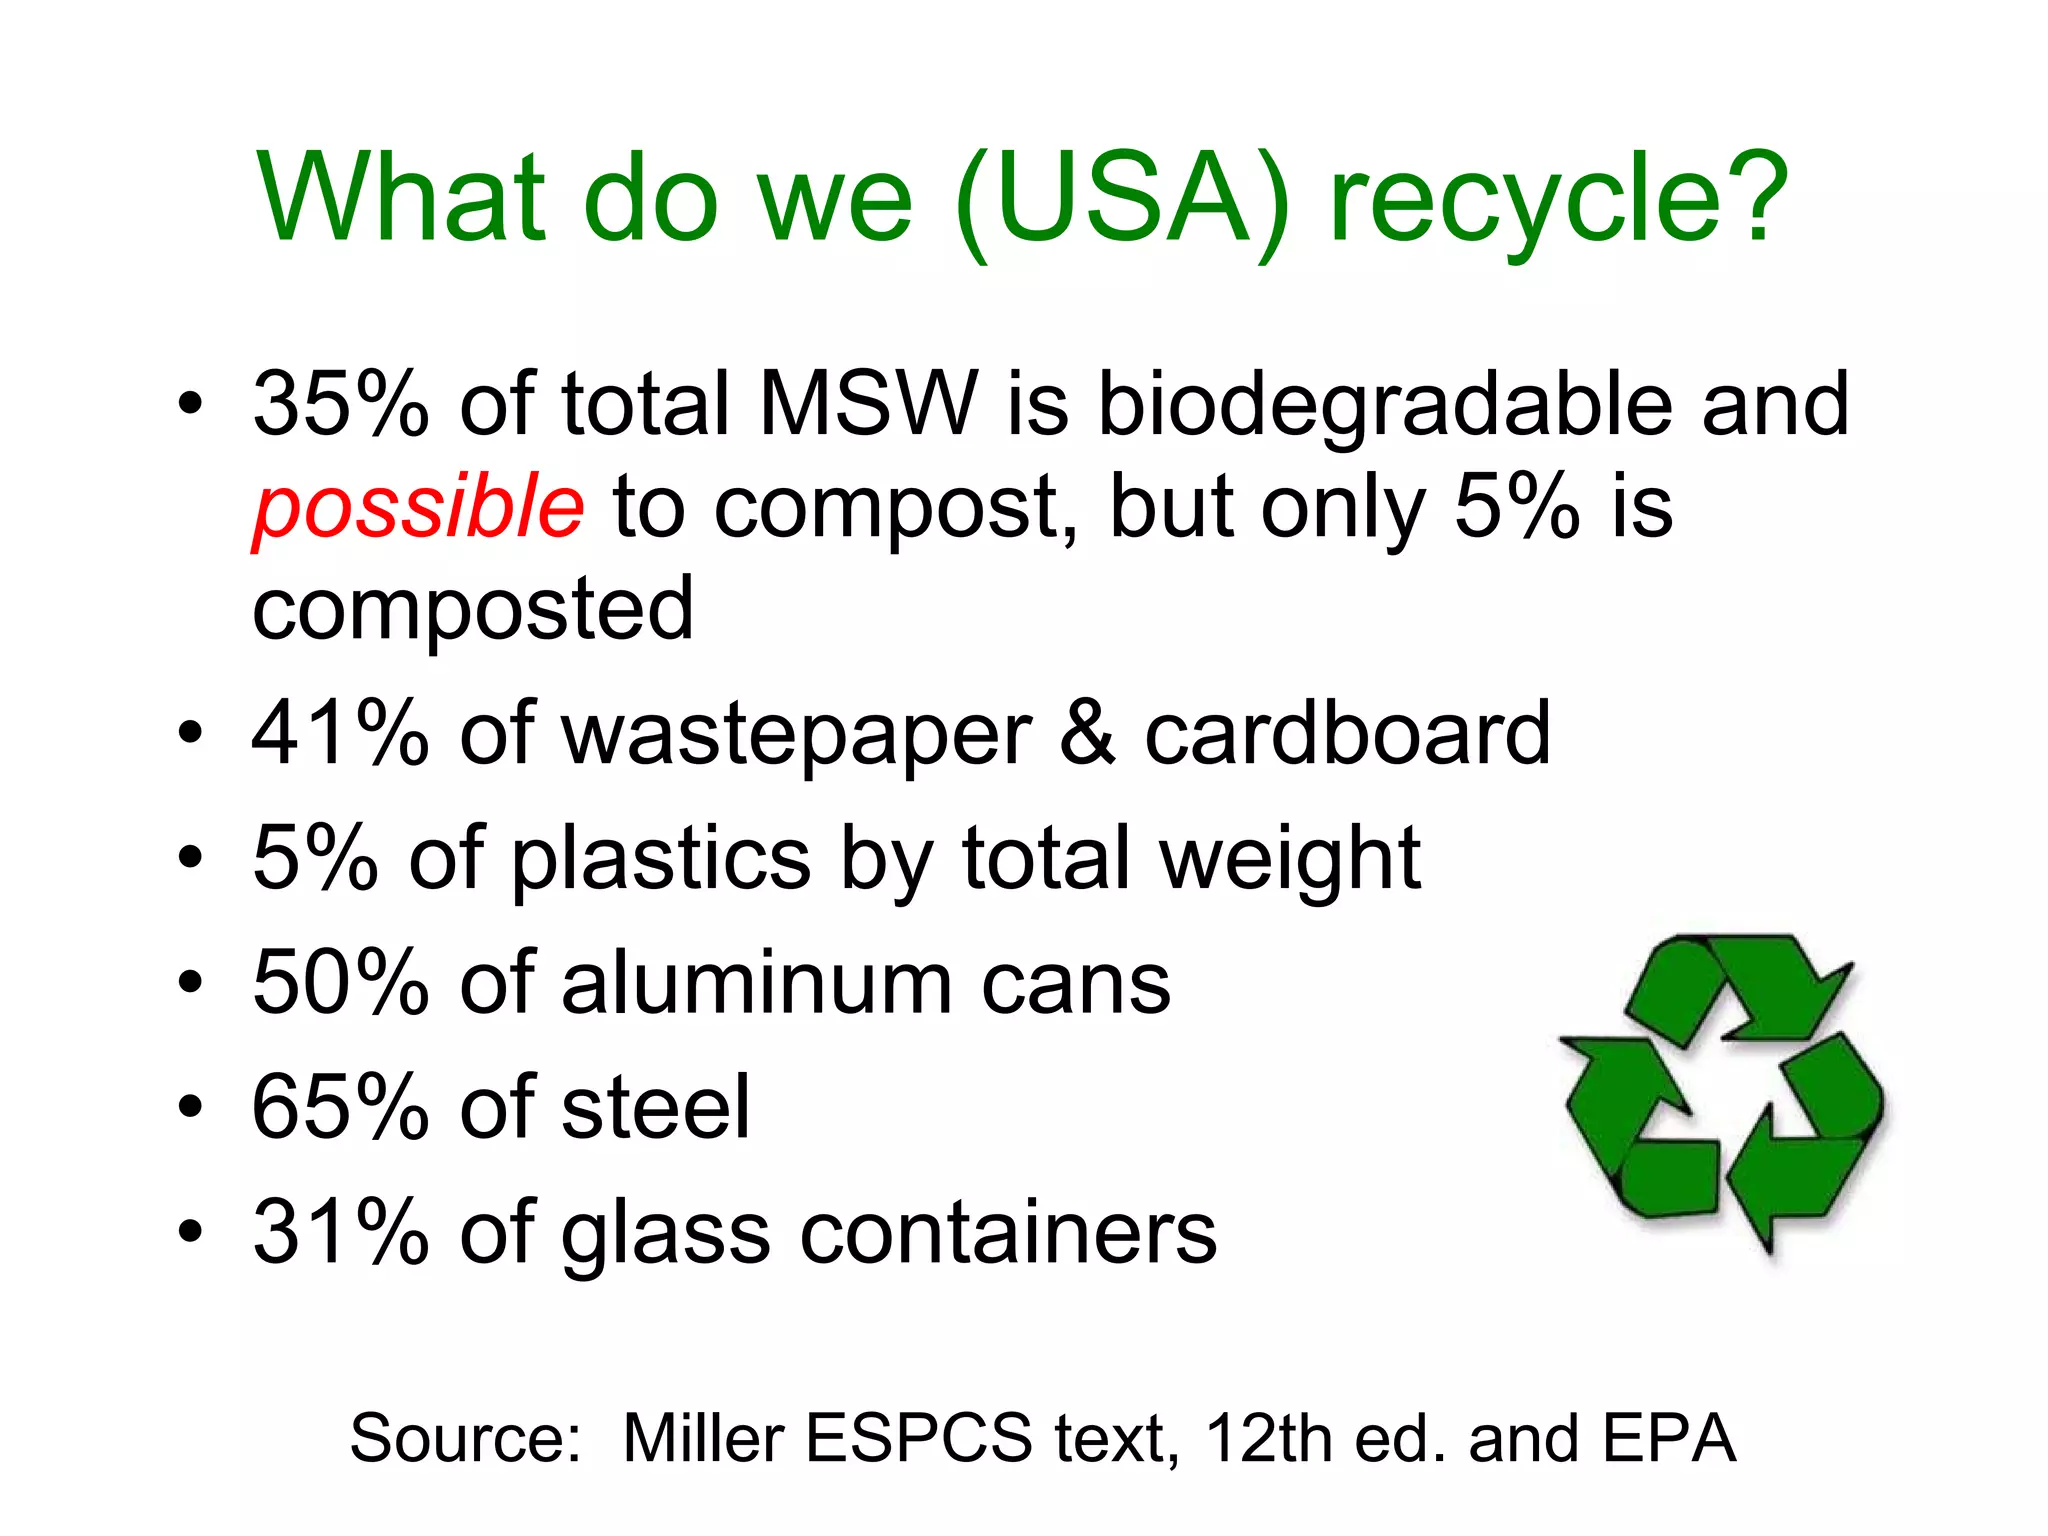
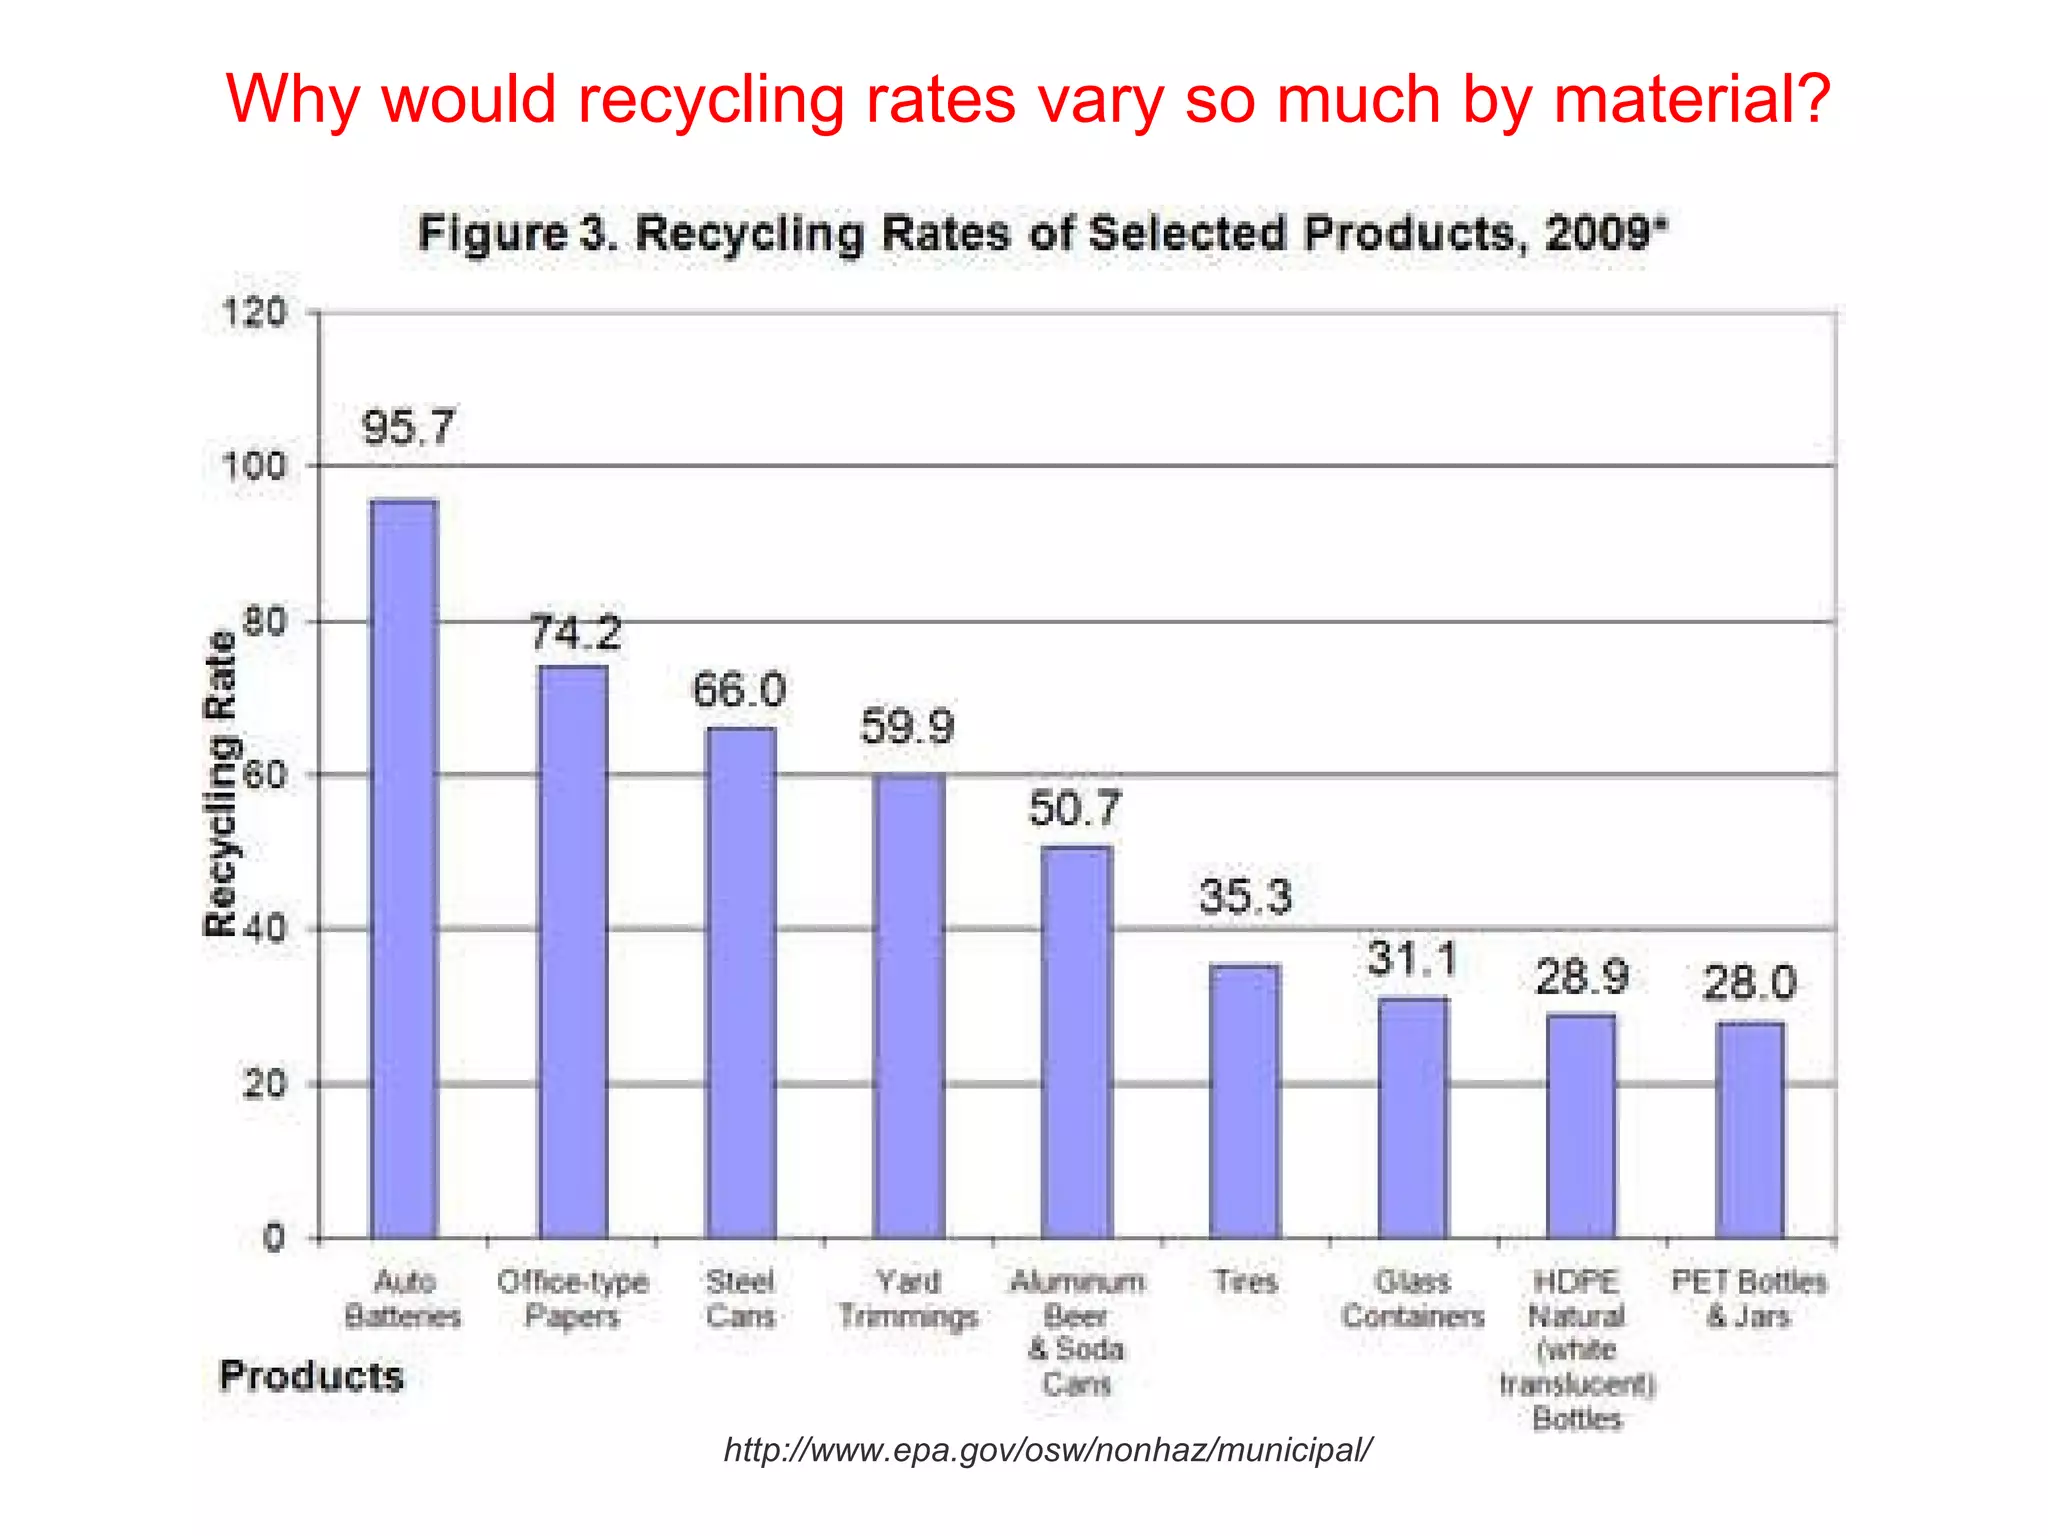
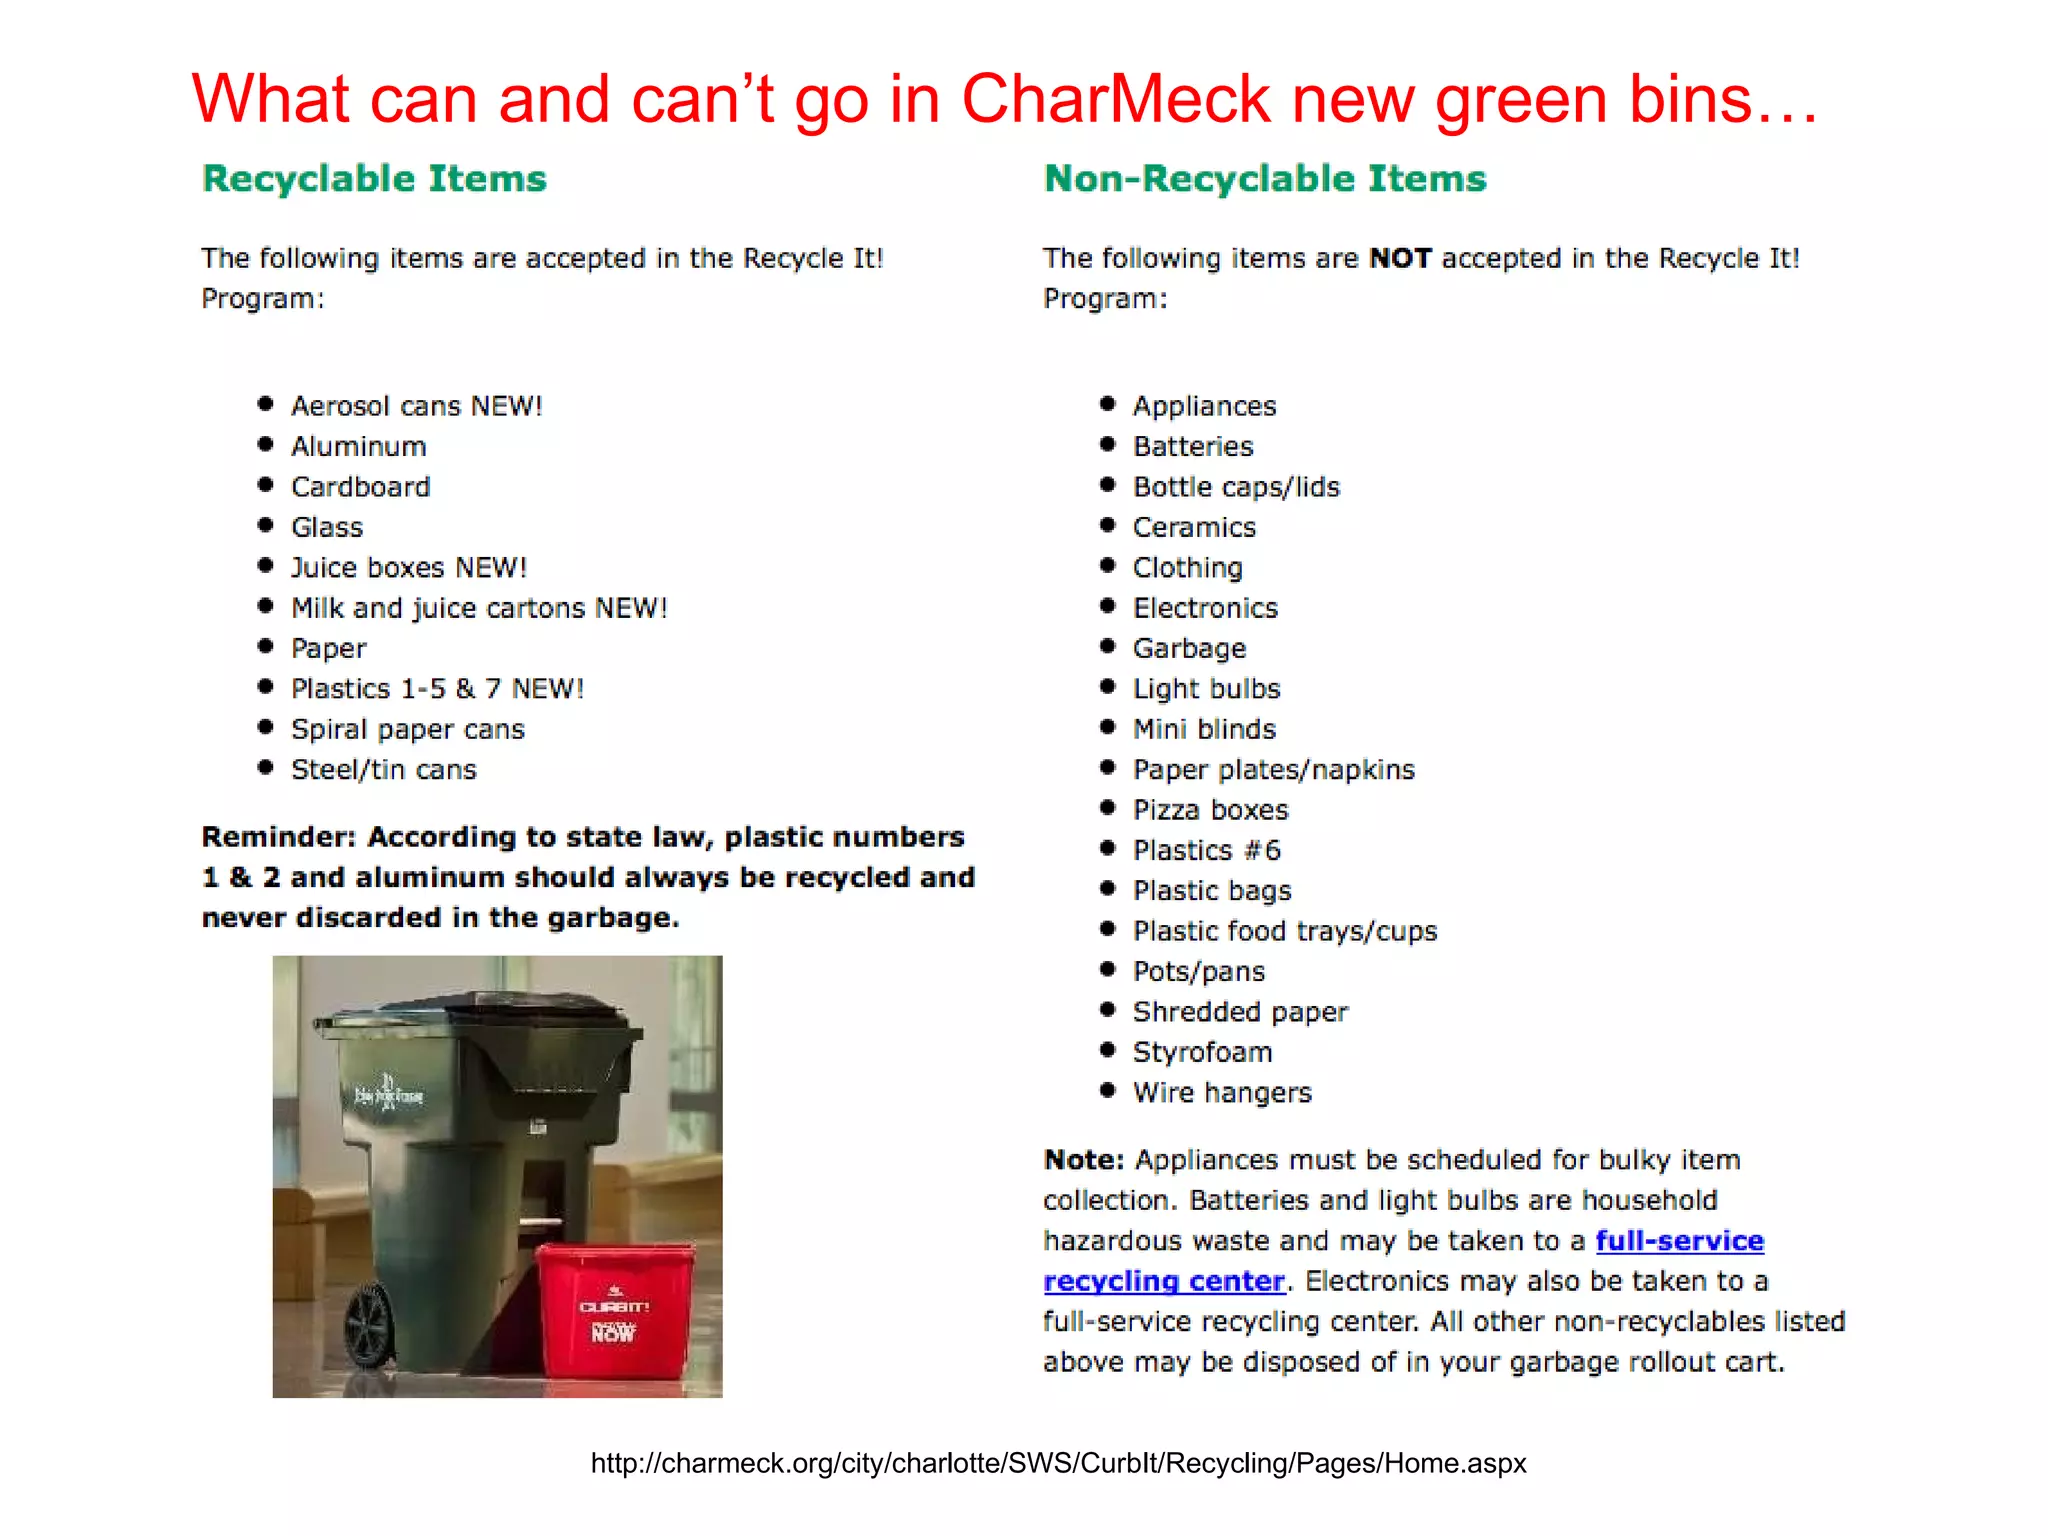
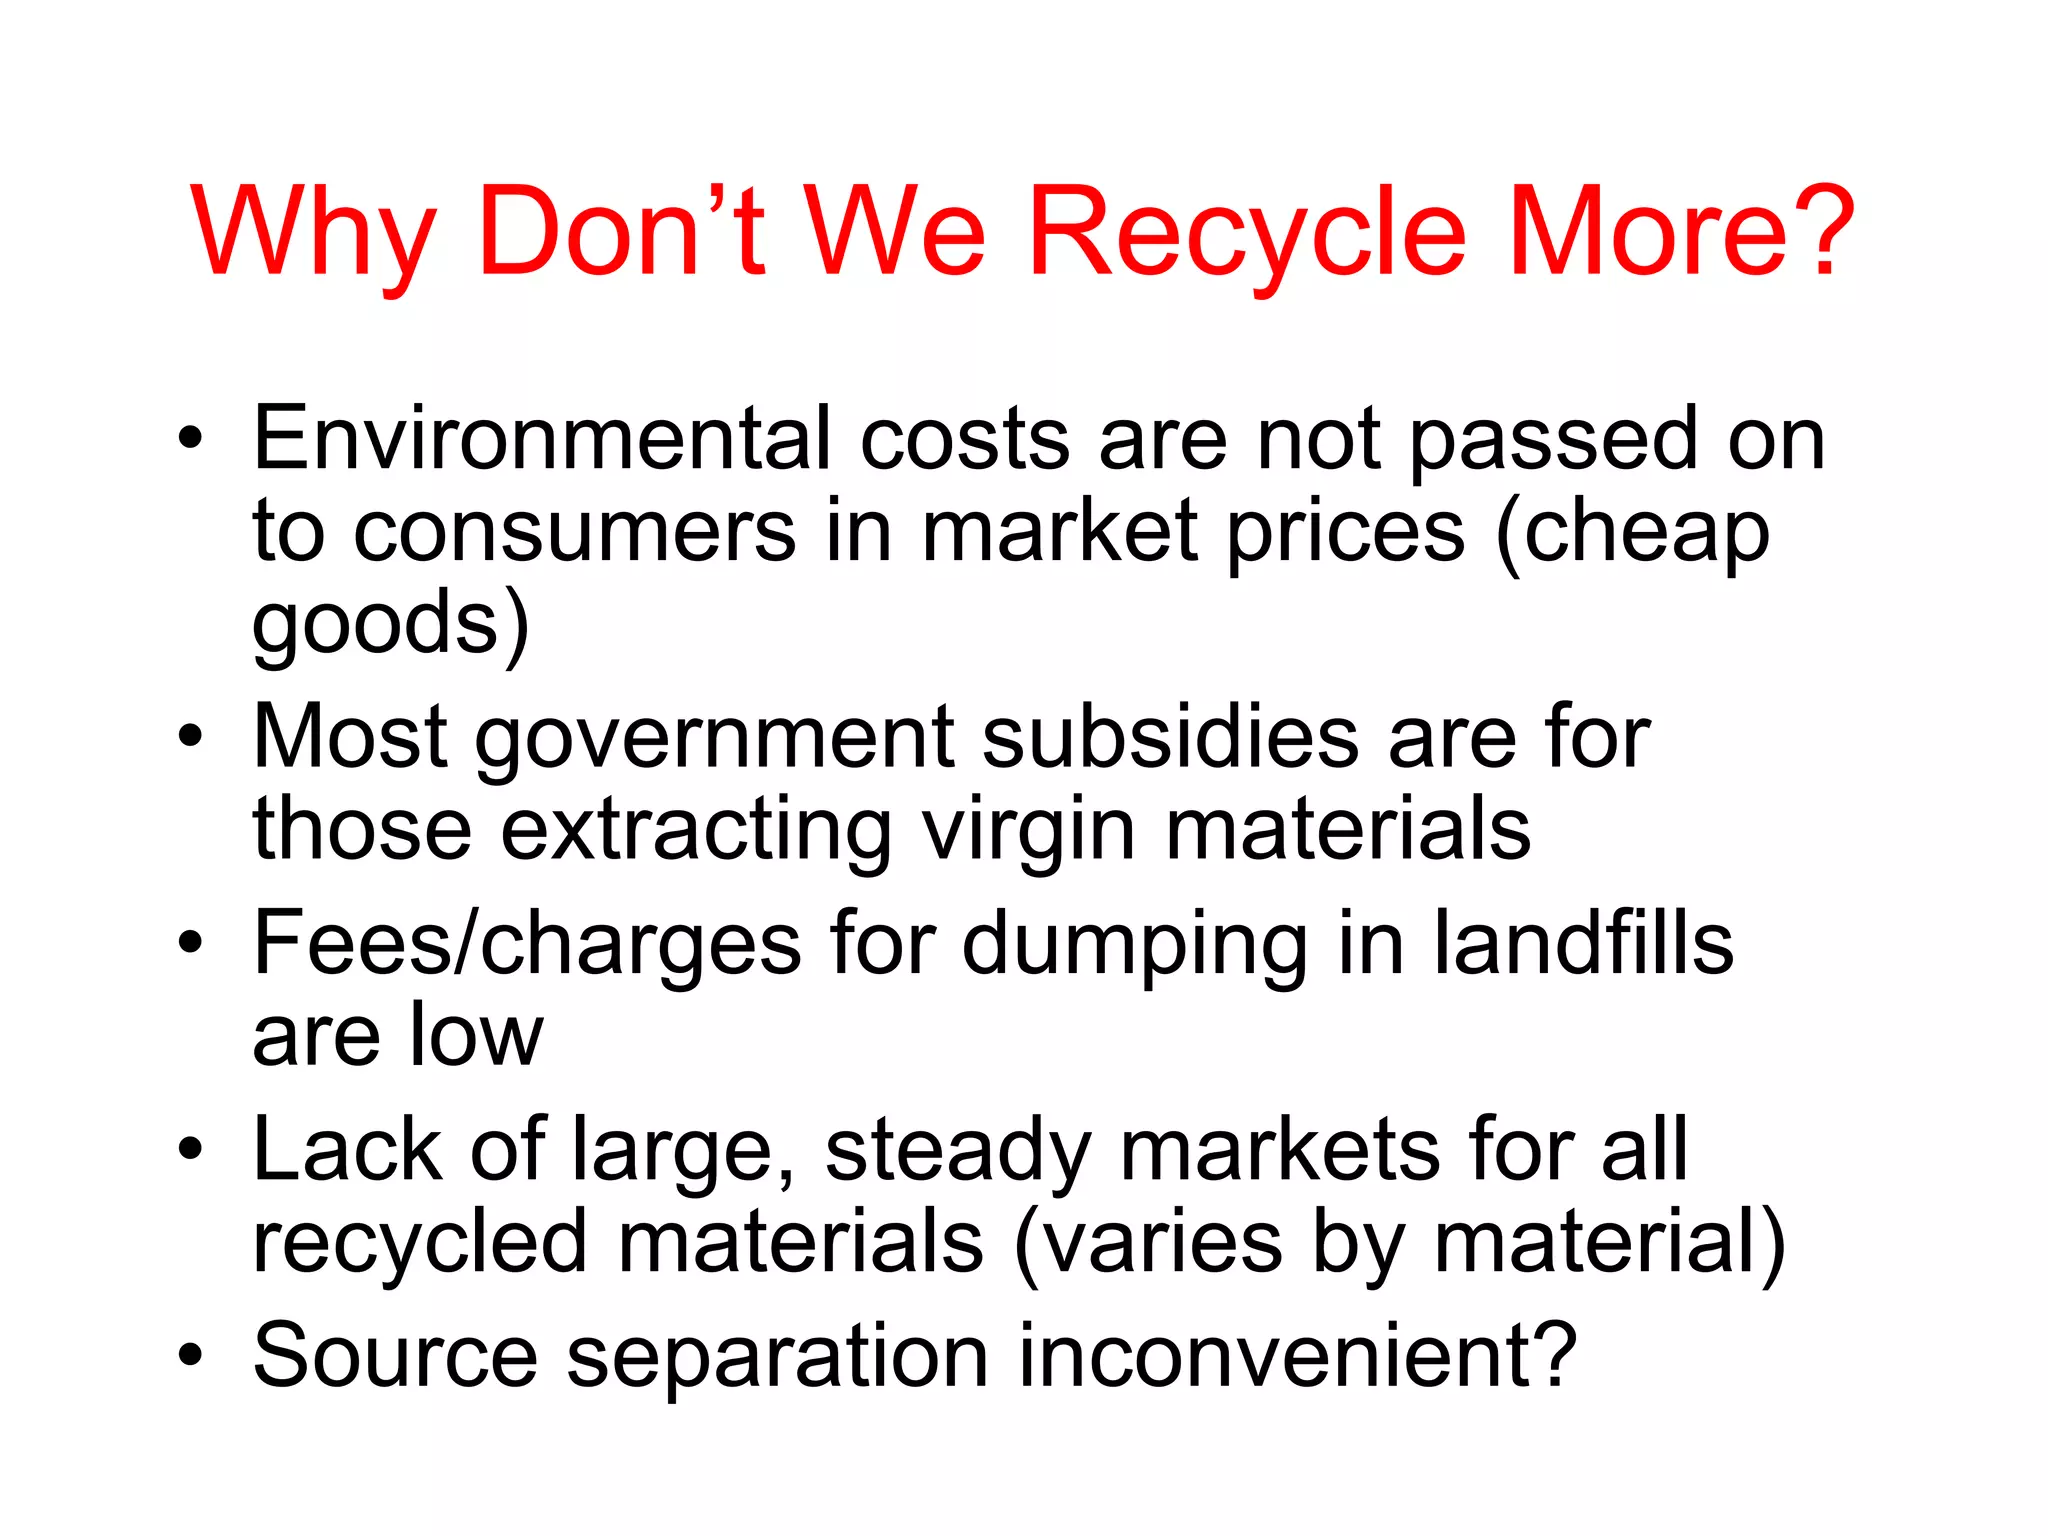
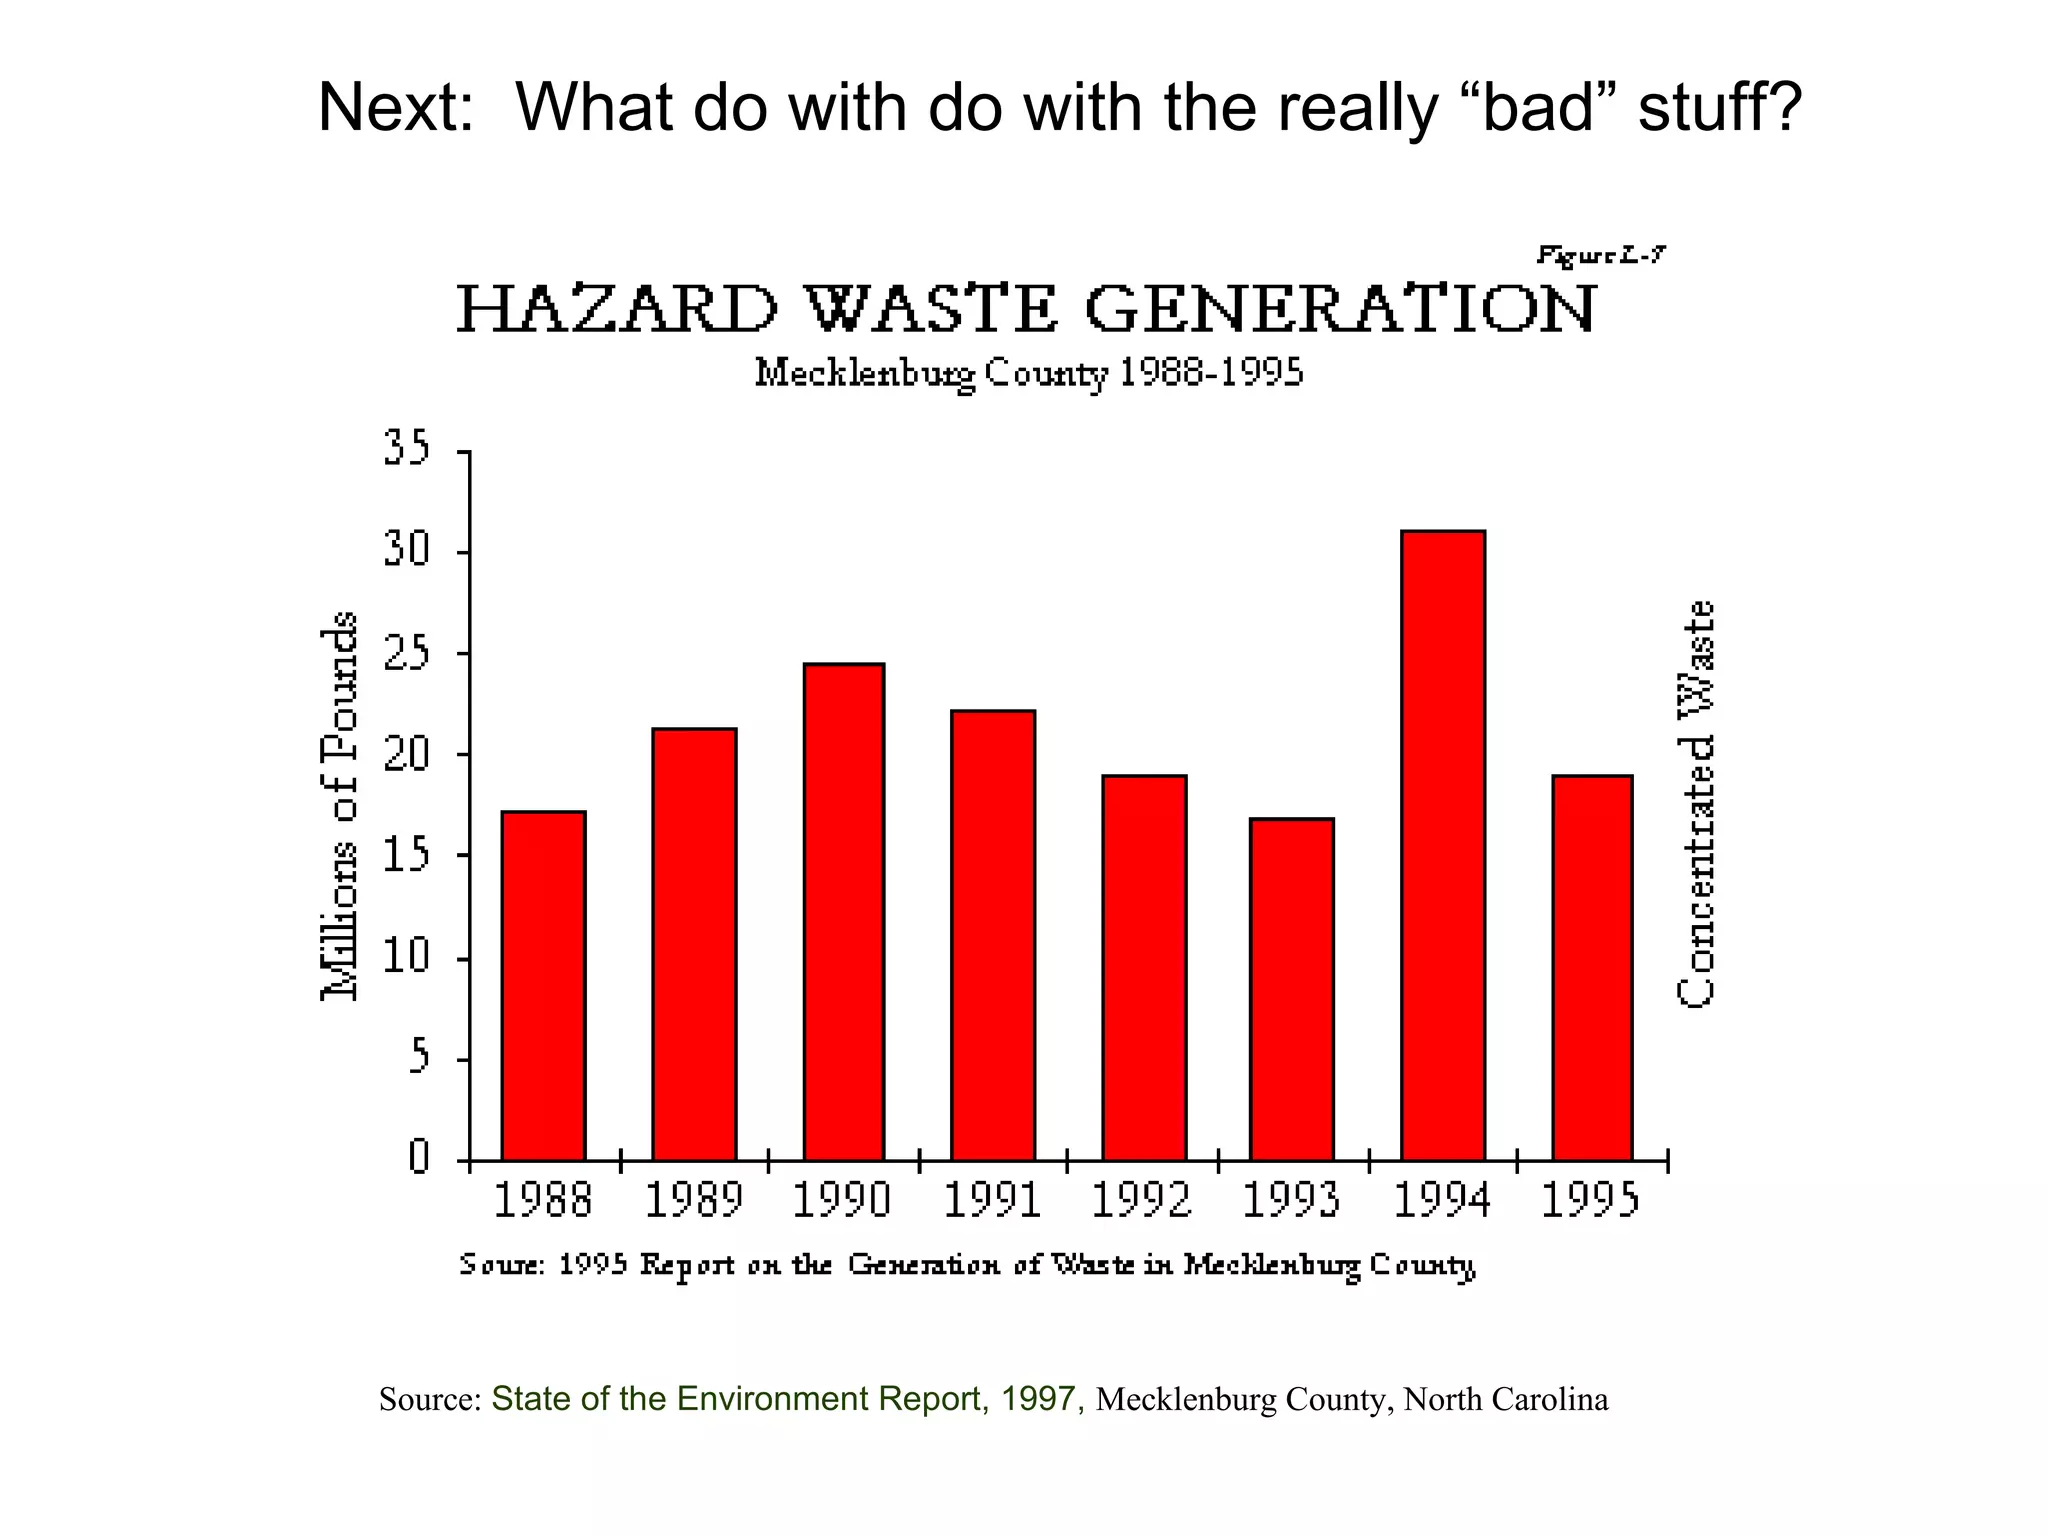

This document discusses municipal solid waste (MSW) in the United States and Mecklenburg County, North Carolina from 1997-2009. It notes that most MSW in the US comes from mining, oil and gas, and agriculture, while municipal waste makes up a small percentage. It also outlines current practices for dealing with MSW, including landfilling, recycling, and incineration. Barriers to increasing recycling rates are discussed, such as low environmental costs and subsidies that favor virgin materials over recycled materials. Potential solutions proposed include taxing resource extraction and requiring government agencies to purchase more recyclables.