Using ClustrMaps
•Download as KEY, PDF•
0 likes•503 views

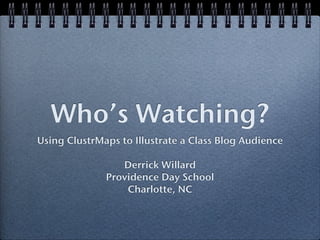
This document describes how a teacher used ClustrMaps to visualize the geographic locations of visitors to his class blog over 10 months. The blog gained over 1600 visitors from countries all around the world, including places in North America, Europe, Asia, Africa, South America, and the Pacific. The map showed the expanding international audience for the class blog over time.
Report
Share
Report
Share

Recommended
Social Media ROI: Measure What Matters
Do You Have a FB Page? A Twitter Page? A Social Media Team? So What! Get past the deja vu and focus on what really matters. ROI is business measurement, not alchemy. The key between Marketing & ROI is correlation.
Dare to Connect Them!
Anms Symposium 2009 Final
This document provides an overview of Boston Logan International Airport and its noise mitigation efforts. In 3 sentences: Boston Logan is operated by the Massachusetts Port Authority and handles over 26 million passengers annually, making it one of the busiest airports in the US. For decades, the airport has implemented an extensive noise mitigation program, including soundproofing over 11,000 homes and 37 schools near flight paths. While not officially part of the FAA's Part 150 program, the airport's efforts effectively meet and exceed federal requirements for addressing aircraft noise in surrounding communities.
Tracking Current Strategies Population Agenda Imbong
The document outlines 16 strategies from NSSM 200, a 1974 US national security memorandum, for population control in developing countries. The strategies include promoting biomedical research, courting political leaders, using international organizations as partners, targeting country programs, and manipulating social security and media to change attitudes and behaviors around family planning. The overall goal is to reduce population growth rates in the named countries for the national security interests of the United States.
Share point techfest 2011 user driven data sources
This was a presentation that Andrew Alexander made at SharePoint TechFest on May 19, 2011 in Irving, TX. For more information, please see more about Cogent at www.cogentcompany.com.
Learning Walks: Trail Hikes in Pedagography
My presentation with Bo Adams, Chief Learning & Innovation Officer, Mount Vernon Presbyterian School at the 2018 Southern Association of Independent Schools Annual Conference.
Description
So often tales from students, parents, and colleagues establish legend and lore about our classroom teachers, providing an incomplete picture of the landscape of teaching and learning in our schools. How might we accurately view that landscape ourselves and, with others, construct and understand a truer map of our pedagogical system? Learning walks are a means to "hike the pedagogical topography” in schools while leveraging simple tech tools to better map that landscape.
Possibilities to Practices II
This document summarizes Derrick Willard's experience integrating iPads and social media into science instruction at Providence Day School in Charlotte, North Carolina. It describes how he has used digital tools like collaborative blogs, digital notebooks, note-taking apps, and formative assessment tools to move from a paper-based to a more paperless approach across various science courses from tropical ecology to AP Environmental Science to Science 8. The goal has been to promote creation, collaboration, and moving beyond just substituting digital tools for paper-based ones to truly transforming instruction using the SAMR model of technology integration.
Planning for Charlotte's Future
This is the slide deck accompanying the presentation by urban planner Garet Johnson in our AP Environmental Science class on 1/11/2013.
Succession Slides 2012
This document discusses ecological succession, including primary and secondary succession. It provides examples of primary succession on new landscapes like volcanic islands or glacial retreat. Secondary succession is examined using a case study of an old field recovering from agriculture. The document also discusses how disturbances can impact succession, creating ecotones and edge effects. The intermediate disturbance hypothesis is presented, suggesting peak diversity at moderate disturbance levels. Island biogeography theories are summarized, relating them to habitat fragmentation. The solution of wildlife corridors is proposed to address fragmentation effects.
Possibilities to Practices
Derrick Willard and Matt Scully from Providence Day School in Charlotte, North Carolina discuss how the iPad is changing science instruction at their school. They implemented iPads in various science courses from tropical ecology to AP Environmental Science. This allowed them to go paperless, use digital tools for collaboration and projects, access content on demand, and use formative assessment apps. They found the iPad helped promote productivity, note taking, projects presented on Apple TV, digital lab notebooks, and collaborative blogs. The iPad is helping bring 21st century skills like digital learning to the science classroom.
Species interactions
Presentation on species interactions that determine a species' niche and impact population dynamics. Class notes from November 5th, 2012.
Mining Practices 2012
This document discusses coal mining practices and their environmental impacts. It begins by explaining that coal and other minerals are mined to produce energy and materials like steel. Several mining techniques are described, including surface mining methods like mountaintop removal and subsurface techniques like longwall mining. The document notes that while mining is important, it can cause issues like water and air pollution, subsidence, and damage to landscapes. Laws like the Surface Mining Control and Reclamation Act were passed to regulate impacts and require cleanup, but mining continues to significantly alter environments.
Charlotte’s Future: Growth and the Environment
This is the slide deck accompanying the presentation by urban planner Garet Johnson in our AP Environmental Science class on 1/13/2012.
Species interactions
This document discusses different types of species interactions including competition, predation, parasitism, commensalism, and mutualism. It provides examples of each type of interaction and how species may coevolve or partition resources in response to competition or predation. Species must adapt to interactions, migrate to avoid negative interactions, or may go extinct if unable to adapt or migrate in response to competition or predation.
Hazardous wastes
1. Hazardous waste landfills are designed with multiple layers to prevent contamination, including compacted waste, clay and plastic linings, leachate collection systems, and groundwater monitoring wells.
2. Common hazardous wastes include cleaning products, paints, pesticides, batteries, motor oil and antifreeze which should not be thrown in the trash or poured down drains but disposed of properly.
3. Transitioning to a low-waste society requires reducing and reusing materials to minimize pollution, following principles like industrial ecology that mimic natural cycles.
Examining MSW
This document discusses municipal solid waste (MSW) in the United States and Mecklenburg County, North Carolina from 1997-2009. It notes that most MSW in the US comes from mining, oil and gas, and agriculture, while municipal waste makes up a small percentage. It also outlines current practices for dealing with MSW, including landfilling, recycling, and incineration. Barriers to increasing recycling rates are discussed, such as low environmental costs and subsidies that favor virgin materials over recycled materials. Potential solutions proposed include taxing resource extraction and requiring government agencies to purchase more recyclables.
Charlotte's Future
A presentation by Garet Johnson of the Charlotte-Mecklenburg Planning Department to our AP Environmental Science Class at Providence Day School on 1/6/2011.
NCAIS Presentation Nov 2010
Slide deck for presentation on using social media to extend the science classroom given at the North Carolina Association of Independent Schools Conference on November 5, 2010.
NCSTA Presentation Nov 2010
Slide deck for a presentation on an integrated math/science unit given at the North Carolina Science Teachers Professional Development Institute on November 12, 2010.
Keystone and Foundation Species 2011
The document discusses the concepts of keystone and foundation species through several examples. It describes research showing that the sea star Pisaster ochraceus is a keystone species that controls populations of mussels, maintaining diversity in intertidal communities. Studies on kangaroo rats and prairie dogs also demonstrate how removing these species can transform ecosystems by reducing diversity. Kelp is provided as an example of a foundation species as a dominant primary producer.
Species interactions
This document discusses different types of species interactions including competition, predation, parasitism, commensalism, and mutualism. It provides examples of each type of interaction such as the competitive exclusion of grey squirrels outcompeting red squirrels in Britain. Species may coevolve due to competitive interactions, developing strategies like resource partitioning to coexist. Predator-prey relationships can drive coevolution through evolutionary arms races. Commensal and mutualistic interactions provide benefits to one or both species involved.
Biomass energy
Presentation to my APES students on types of biofuels (solid, liquid, gas) using mostly my own photos.
Mining Practices & Impacts
The document discusses various mining techniques and their environmental impacts. It describes how minerals are identified and land is acquired for mining under the 1872 Mining Law. Surface mining techniques like open-pit, strip, contour, and mountaintop removal mining are outlined. Subsurface mining techniques like room-and-pillar and longwall mining are also summarized. The document discusses the impacts of mining such as scarring of land, erosion, subsidence, water and air pollution from acid mine drainage and slurry pond spills. It provides an example of reclamation at an abandoned coal mine in Pennsylvania.
Examining MSW
The document discusses waste management statistics from the United States and Mecklenburg County, North Carolina from 1997-2008. It notes that municipal solid waste (MSW) makes up a small percentage of total waste generated annually in the US. Most MSW is disposed of in landfills, though recycling rates have increased since the 1980s. Barriers to higher recycling rates include a lack of incentives to use recycled materials and convenience of disposal options.
Willard Sparking Innovation
This is my "ignite" format (20 slide/15 sec slide) slide deck from my presentation at NCAIS Innovate Conference on March 11, 2010 at Cary Academy. No Audio, but presentation should be on YouTube Channel soon.
HIV/AIDS Lecture
HIV is a virus that weakens the immune system, and AIDS is the late stage of HIV infection defined by opportunistic infections. The document provides details on how HIV infects and damages cells, its history and global impact, treatments, and prevention strategies. It reports that over 30 million people have died of AIDS-related illnesses globally since the early 1980s, with sub-Saharan Africa particularly hard hit, though combination drug therapies have helped lower mortality in some areas.
Succession
This presentation elaborates on primary and secondary succession concepts presented in Chapter 6 of your text.
More Related Content
More from Derrick Willard
Planning for Charlotte's Future
This is the slide deck accompanying the presentation by urban planner Garet Johnson in our AP Environmental Science class on 1/11/2013.
Succession Slides 2012
This document discusses ecological succession, including primary and secondary succession. It provides examples of primary succession on new landscapes like volcanic islands or glacial retreat. Secondary succession is examined using a case study of an old field recovering from agriculture. The document also discusses how disturbances can impact succession, creating ecotones and edge effects. The intermediate disturbance hypothesis is presented, suggesting peak diversity at moderate disturbance levels. Island biogeography theories are summarized, relating them to habitat fragmentation. The solution of wildlife corridors is proposed to address fragmentation effects.
Possibilities to Practices
Derrick Willard and Matt Scully from Providence Day School in Charlotte, North Carolina discuss how the iPad is changing science instruction at their school. They implemented iPads in various science courses from tropical ecology to AP Environmental Science. This allowed them to go paperless, use digital tools for collaboration and projects, access content on demand, and use formative assessment apps. They found the iPad helped promote productivity, note taking, projects presented on Apple TV, digital lab notebooks, and collaborative blogs. The iPad is helping bring 21st century skills like digital learning to the science classroom.
Species interactions
Presentation on species interactions that determine a species' niche and impact population dynamics. Class notes from November 5th, 2012.
Mining Practices 2012
This document discusses coal mining practices and their environmental impacts. It begins by explaining that coal and other minerals are mined to produce energy and materials like steel. Several mining techniques are described, including surface mining methods like mountaintop removal and subsurface techniques like longwall mining. The document notes that while mining is important, it can cause issues like water and air pollution, subsidence, and damage to landscapes. Laws like the Surface Mining Control and Reclamation Act were passed to regulate impacts and require cleanup, but mining continues to significantly alter environments.
Charlotte’s Future: Growth and the Environment
This is the slide deck accompanying the presentation by urban planner Garet Johnson in our AP Environmental Science class on 1/13/2012.
Species interactions
This document discusses different types of species interactions including competition, predation, parasitism, commensalism, and mutualism. It provides examples of each type of interaction and how species may coevolve or partition resources in response to competition or predation. Species must adapt to interactions, migrate to avoid negative interactions, or may go extinct if unable to adapt or migrate in response to competition or predation.
Hazardous wastes
1. Hazardous waste landfills are designed with multiple layers to prevent contamination, including compacted waste, clay and plastic linings, leachate collection systems, and groundwater monitoring wells.
2. Common hazardous wastes include cleaning products, paints, pesticides, batteries, motor oil and antifreeze which should not be thrown in the trash or poured down drains but disposed of properly.
3. Transitioning to a low-waste society requires reducing and reusing materials to minimize pollution, following principles like industrial ecology that mimic natural cycles.
Examining MSW
This document discusses municipal solid waste (MSW) in the United States and Mecklenburg County, North Carolina from 1997-2009. It notes that most MSW in the US comes from mining, oil and gas, and agriculture, while municipal waste makes up a small percentage. It also outlines current practices for dealing with MSW, including landfilling, recycling, and incineration. Barriers to increasing recycling rates are discussed, such as low environmental costs and subsidies that favor virgin materials over recycled materials. Potential solutions proposed include taxing resource extraction and requiring government agencies to purchase more recyclables.
Charlotte's Future
A presentation by Garet Johnson of the Charlotte-Mecklenburg Planning Department to our AP Environmental Science Class at Providence Day School on 1/6/2011.
NCAIS Presentation Nov 2010
Slide deck for presentation on using social media to extend the science classroom given at the North Carolina Association of Independent Schools Conference on November 5, 2010.
NCSTA Presentation Nov 2010
Slide deck for a presentation on an integrated math/science unit given at the North Carolina Science Teachers Professional Development Institute on November 12, 2010.
Keystone and Foundation Species 2011
The document discusses the concepts of keystone and foundation species through several examples. It describes research showing that the sea star Pisaster ochraceus is a keystone species that controls populations of mussels, maintaining diversity in intertidal communities. Studies on kangaroo rats and prairie dogs also demonstrate how removing these species can transform ecosystems by reducing diversity. Kelp is provided as an example of a foundation species as a dominant primary producer.
Species interactions
This document discusses different types of species interactions including competition, predation, parasitism, commensalism, and mutualism. It provides examples of each type of interaction such as the competitive exclusion of grey squirrels outcompeting red squirrels in Britain. Species may coevolve due to competitive interactions, developing strategies like resource partitioning to coexist. Predator-prey relationships can drive coevolution through evolutionary arms races. Commensal and mutualistic interactions provide benefits to one or both species involved.
Biomass energy
Presentation to my APES students on types of biofuels (solid, liquid, gas) using mostly my own photos.
Mining Practices & Impacts
The document discusses various mining techniques and their environmental impacts. It describes how minerals are identified and land is acquired for mining under the 1872 Mining Law. Surface mining techniques like open-pit, strip, contour, and mountaintop removal mining are outlined. Subsurface mining techniques like room-and-pillar and longwall mining are also summarized. The document discusses the impacts of mining such as scarring of land, erosion, subsidence, water and air pollution from acid mine drainage and slurry pond spills. It provides an example of reclamation at an abandoned coal mine in Pennsylvania.
Examining MSW
The document discusses waste management statistics from the United States and Mecklenburg County, North Carolina from 1997-2008. It notes that municipal solid waste (MSW) makes up a small percentage of total waste generated annually in the US. Most MSW is disposed of in landfills, though recycling rates have increased since the 1980s. Barriers to higher recycling rates include a lack of incentives to use recycled materials and convenience of disposal options.
Willard Sparking Innovation
This is my "ignite" format (20 slide/15 sec slide) slide deck from my presentation at NCAIS Innovate Conference on March 11, 2010 at Cary Academy. No Audio, but presentation should be on YouTube Channel soon.
HIV/AIDS Lecture
HIV is a virus that weakens the immune system, and AIDS is the late stage of HIV infection defined by opportunistic infections. The document provides details on how HIV infects and damages cells, its history and global impact, treatments, and prevention strategies. It reports that over 30 million people have died of AIDS-related illnesses globally since the early 1980s, with sub-Saharan Africa particularly hard hit, though combination drug therapies have helped lower mortality in some areas.
Succession
This presentation elaborates on primary and secondary succession concepts presented in Chapter 6 of your text.
More from Derrick Willard (20)
Using ClustrMaps
- 1. Who’s Watching? Using ClustrMaps to Illustrate a Class Blog Audience Derrick Willard Providence Day School Charlotte, NC
- 3. August 2009 34 Visitors in the USA after 10 days...
- 4. September 2009 Europe
- 5. October 2009 Canada China INdia
- 6. November 2009 Korea Australia
- 7. December 2009 Vietnam
- 8. January 2010 Mexico Sudan
- 9. March 2010 Philippines Brazil
- 11. May 2010 Over 1600 visitors from all over the world in 10 months!