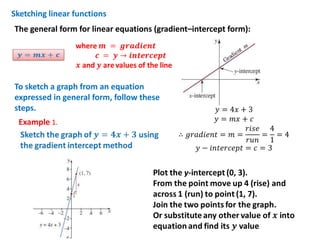
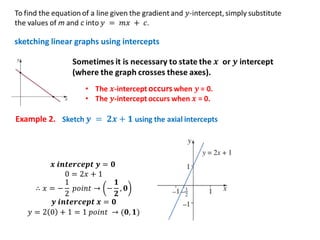
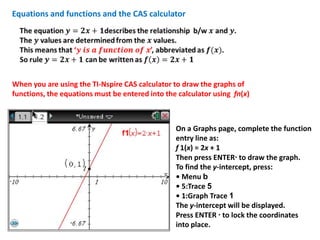
Sketching linear functions
The general form for linear equations (gradient–intercept form):

To sketch a graph from an equation
expressed in general form, follow these
steps.
Example 1.

𝑦 = 4π‘₯ + 3
𝑦 = π‘šπ‘₯ + 𝑐
π‘Ÿπ‘–π‘ π‘’ 4
∴ π‘”π‘Ÿπ‘Žπ‘‘π‘–π‘’π‘›π‘‘ = π‘š =
= =4
π‘Ÿπ‘’π‘› 1
𝑦 βˆ’ π‘–π‘›π‘‘π‘’π‘Ÿπ‘π‘’π‘π‘‘ = 𝑐 = 3
sketching linear graphs using intercepts

Example 2.

𝒙 π’Šπ’π’•π’†π’“π’„π’†π’‘π’• π’š = 𝟎
0 = 2π‘₯ + 1
1
𝟏
∴ π‘₯ = βˆ’ π‘π‘œπ‘–π‘›π‘‘ β†’ βˆ’ , 𝟎
2
𝟐
π’š π’Šπ’π’•π’†π’“π’„π’†π’‘π’• 𝒙 = 𝟎
𝑦 = 2 0 + 1 = 1 π‘π‘œπ‘–π‘›π‘‘ β†’ (𝟎, 𝟏)
Equations and functions and the CAS calculator

When you are using the TI-Nspire CAS calculator to draw the graphs of
functions, the equations must be entered into the calculator using fn(x)

On a Graphs page, complete the function
entry line as:
f 1(x) = 2x + 1
Then press ENTERΒ· to draw the graph.
To find the y-intercept, press:
β€’ Menu b
β€’ 5:Trace 5
β€’ 1:Graph Trace 1
The y-intercept will be displayed.
Press ENTER Β· to lock the coordinates
into place.
Example 3.

Exercise 1D

Ex1 d sketchlinfuncs

  • 1.
    Sketching linear functions Thegeneral form for linear equations (gradient–intercept form): To sketch a graph from an equation expressed in general form, follow these steps. Example 1. 𝑦 = 4π‘₯ + 3 𝑦 = π‘šπ‘₯ + 𝑐 π‘Ÿπ‘–π‘ π‘’ 4 ∴ π‘”π‘Ÿπ‘Žπ‘‘π‘–π‘’π‘›π‘‘ = π‘š = = =4 π‘Ÿπ‘’π‘› 1 𝑦 βˆ’ π‘–π‘›π‘‘π‘’π‘Ÿπ‘π‘’π‘π‘‘ = 𝑐 = 3
  • 2.
    sketching linear graphsusing intercepts Example 2. 𝒙 π’Šπ’π’•π’†π’“π’„π’†π’‘π’• π’š = 𝟎 0 = 2π‘₯ + 1 1 𝟏 ∴ π‘₯ = βˆ’ π‘π‘œπ‘–π‘›π‘‘ β†’ βˆ’ , 𝟎 2 𝟐 π’š π’Šπ’π’•π’†π’“π’„π’†π’‘π’• 𝒙 = 𝟎 𝑦 = 2 0 + 1 = 1 π‘π‘œπ‘–π‘›π‘‘ β†’ (𝟎, 𝟏)
  • 3.
    Equations and functionsand the CAS calculator When you are using the TI-Nspire CAS calculator to draw the graphs of functions, the equations must be entered into the calculator using fn(x) On a Graphs page, complete the function entry line as: f 1(x) = 2x + 1 Then press ENTERΒ· to draw the graph. To find the y-intercept, press: β€’ Menu b β€’ 5:Trace 5 β€’ 1:Graph Trace 1 The y-intercept will be displayed. Press ENTER Β· to lock the coordinates into place.
  • 4.