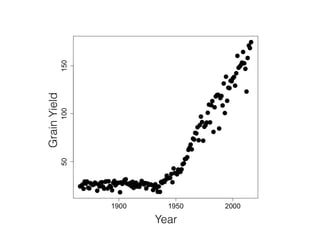
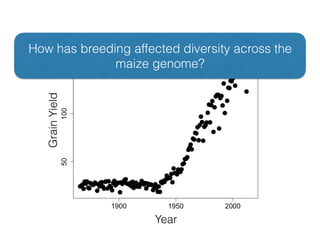
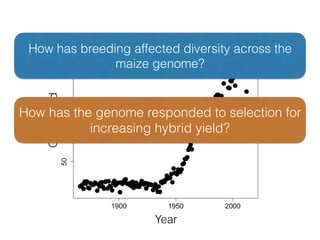
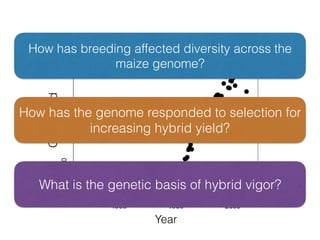
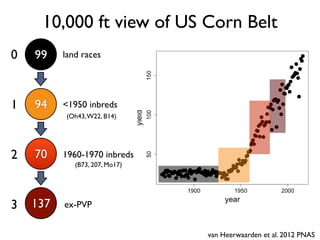
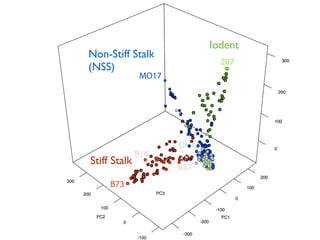
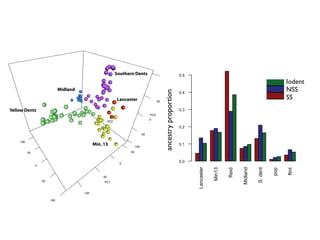
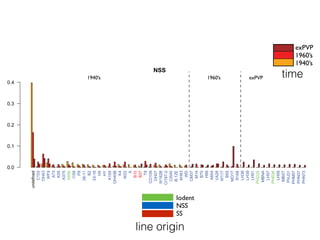
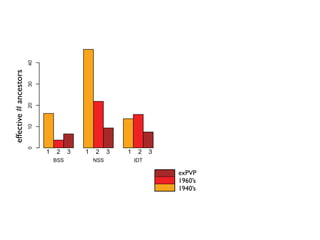
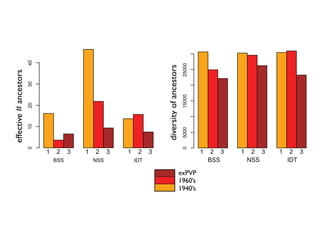
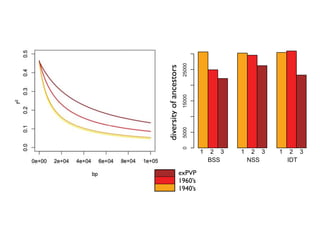
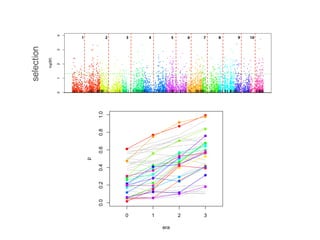
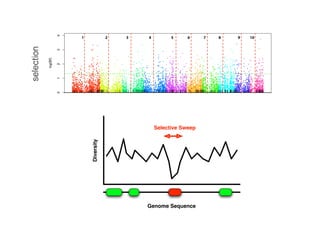
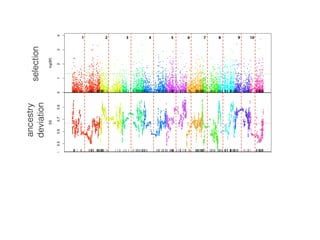
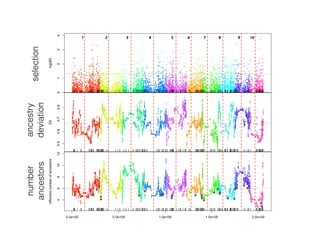
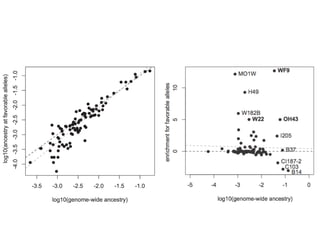
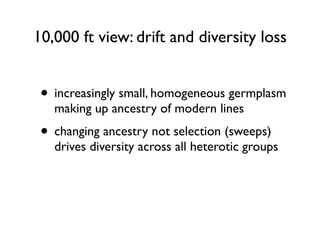
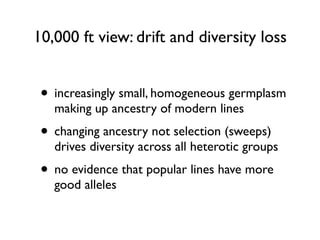
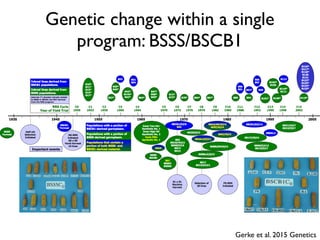
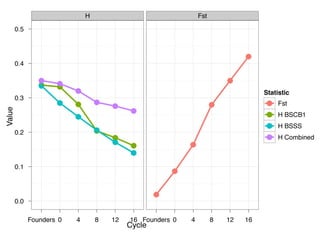
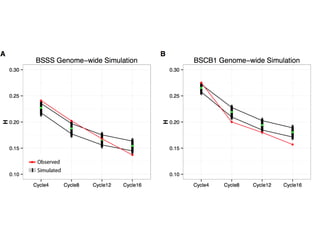
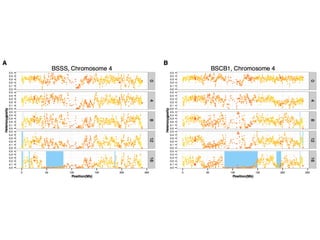
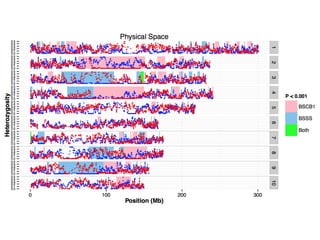
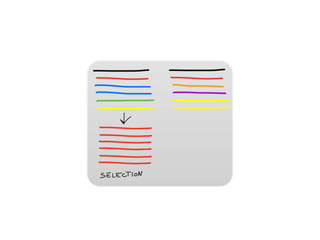
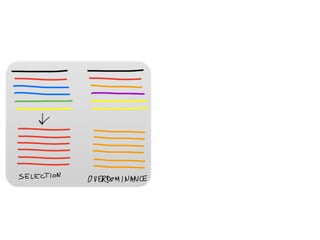
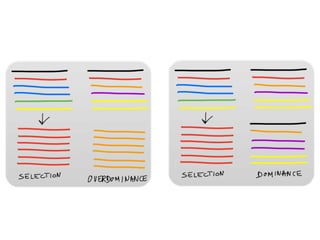
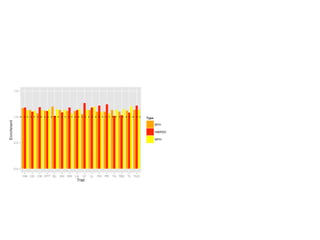
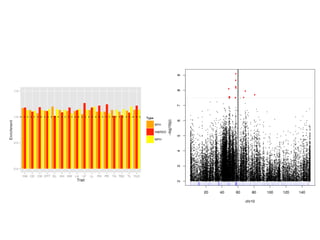
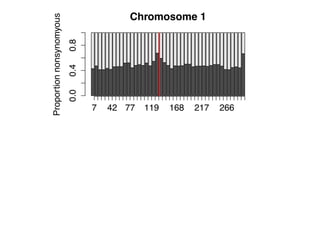
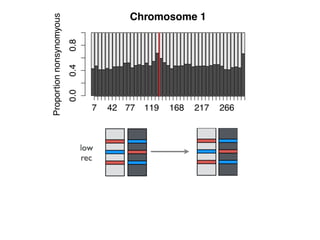
Evolutionary Genetics
of Hybrid Maize
Jeffrey Ross-Ibarra
www.rilab.org
@jrossibarra
GrainYield
Year
GrainYield
Year
How has breeding affected diversity across the
maize genome?
GrainYield
Year
How has breeding affected diversity across the
maize genome?
How has the genome responded to selection for
increasing hybrid yield?
GrainYield
Year
How has breeding affected diversity across the
maize genome?
How has the genome responded to selection for
increasing hybrid yield?
What is the genetic basis of hybrid vigor?
van Heerwaarden et al. 2012 PNAS
99
94
70
137
land races
<1950 inbreds
1960-1970 inbreds
ex-PVP
0
1
2
3
(Oh43,W22, B14)
(B73, 207, Mo17)
10,000 ft view of US Corn Belt
Iodent
Non-Stiff Stalk
(NSS)
Stiff Stalk
!
1 2 30 1 2 3
era
C
0.000.100.20
BSS NSS IDT
manhattan
050001500
BSS NSS IDT
inv.simpson
010203040
Lancaster
Min13
Reid
Midland
S.dent
pop
flint
0.0
0.1
0.2
0.3
0.4
0.5
d. e.
era
1 2 3 1 2 3 1 2 3
1 2 3 1 2 3 1 2 3 ancestryproportion
23
BSSNSS
manhattandistance
050001500025
0.1
0.2
0.3
0.4
0.5
e.
era
1231231
Iodent
NSS
SS
A
C
T
G
T
G
A
C
T
C
C
A
T
C
G
A
Inbred 1
A
C
T
G
T
G
A
C
T
C
C
A
T
C
G
A
G
T
G
A
C
T
C
T
C
G
T
C
G
A
C
G
A
C
T
G
T
G
A
C
T
C
C
A
T
G
T
G
Inbred 1 2 3
A
C
T
G
T
G
A
C
T
C
C
A
T
C
G
A
G
T
G
A
C
T
C
T
C
G
T
C
G
A
C
G
A
C
T
G
T
G
A
C
T
C
C
A
T
G
T
G
Inbred 1 2 3
A
C
T
G
T
G
A
C
T
C
C
A
T
C
G
A
G
T
G
A
C
T
C
T
C
G
T
C
G
A
C
G
A
C
T
G
T
G
A
C
T
C
C
A
T
G
T
G
Inbred 1 2 3
A
C
T
G
T
G
A
C
T
C
C
A
T
C
G
A
A
C
T
G
T
G
A
C
T
C
C
A
T
G
T
G
Inbred 1 3
A
C
T
G
T
G
A
C
T
C
C
A
T
C
G
A
A
C
T
G
T
G
A
C
T
C
C
A
T
G
T
G
Inbred 1 3
3
2
1
0
timecategory
SS
NSS
Iodent
SS
0.0
0.1
0.2
0.3
0.4
undefined
OH43
CI31A
HY
B8
B10
B14
B96
B37
I205
OH07
CI3A
CI187-2
CI540
I224
WD456
Oh3167B
Tr9-1-1-6
FE2
LE773
ND203
B73
A634
A635
N28
H100
B64
B14A
B68
CM105
B84
A632
N196
LH195
LH205
LH196
LH194
991
LH74
PHG39
LH132
G80
78004
78010
4676A
78002A
794
LP5
PHT55
H8431
1 2 3
NSS
0.4
1 2 3
manhattandistance
50001500025000
c.b.
exPVP
1960’s
1940’s
1960’s1940’s exPVP
Iodent
NSS
SS
time
line origin
0.0
0.1
undefined
C103
OH43
WF9
A73
K55
A375
A556
I159
P8
38-11
B2
33-16
H5
HY
K155
OH40B
K4
W22
A
B10
B37
T8
CO109
OH07
W182B
CI187-2
CI540
Ill.12E
AH83
WD
CM37
M14
B70
H99
A654
VA26
W117
B55
MO17
R168
LH38
LH39
LH51
PHG35
MBNA
LH57
PHR36
LH59
MBST
PHJ31
PHM57
PHN37
PHN73
IDT
1 2 3
0.0
0.1
0.2
0.3
0.4
undefined
OH43
WF9
A375
A509
A556
I198
B2
H5
HY
B164
G
ND203
B10
B14
L317
I205
CI187-2
C49A
I224
AH83
Tr9-1-1-6
C11
IDT
A638
M14
207
PHN34
PHP76
PHW86
PHG50
PHG35
PHG71
IB014
PHG83
LH150
PHG29
PHG72
PHG84
PHZ51
PHV78
PHK42
PHN11
PHH93
PHJ33
PHN73
PHR62
manhattandistance
50001500025000
c.b.
exPVP
1960’s
1940’s
1960’s1940’s exPVP
Iodent
NSS
SS
time
line origin
manhattandistance
50001500025000
c.b.
exPVP
1960’s
1940’s
0.0
0.1
undefined
OH43
CI31A
HY
B8
B10
B14
B96
B37
I205
OH07
CI3A
CI187-2
CI540
I224
WD456
Oh3167B
Tr9-1-1-6
FE2
LE773
ND203
B73
A634
A635
N28
H100
B64
B14A
B68
CM105
B84
A632
N196
LH195
LH205
LH196
LH194
991
LH74
PHG39
LH132
G80
78004
78010
4676A
78002A
794
LP5
PHT55
H8431
NSS
0.0
0.1
0.2
0.3
0.4
undefined
C103
OH43
WF9
A73
K55
A375
A556
I159
P8
38-11
B2
33-16
H5
HY
K155
OH40B
K4
W22
A
B10
B37
T8
CO109
OH07
W182B
CI187-2
CI540
Ill.12E
AH83
WD
CM37
M14
B70
H99
A654
VA26
W117
B55
MO17
R168
LH38
LH39
LH51
PHG35
MBNA
LH57
PHR36
LH59
MBST
PHJ31
PHM57
PHN37
PHN73
1 2 3
IDT
1 2 3
0.3
0.4
1960’s1940’s exPVP
Iodent
NSS
SS
time
line origin
1 2 30 1 2 3
era
BSS NSS IDT
BSS NSS IDT
inv.simpson
010203040
Lancaster
Min13
Reid
Midland
S.dent
pop
0.0
0.1
0.2
0.3
0.4
0.5
d. e.
era
1 2 3 1 2 3 1 2 3
effective#ancestors
exPVP
1960’s
1940’s
BSSNSSIDT
manhattandistance
050001500025000
123123123
1 2 30 1 2 3
era
BSS NSS IDT
BSS NSS IDT
inv.simpson
010203040
Lancaster
Min13
Reid
Midland
S.dent
pop
0.0
0.1
0.2
0.3
0.4
0.5
d. e.
era
1 2 3 1 2 3 1 2 3
effective#ancestors
1 2 30 1 2 3
era
BSS NSS IDT
manhattandistance
050001500025000
040
0.3
0.4
0.5
c.b.
e.
era
1 2 3 1 2 3 1 2 3
diversityofancestorsexPVP
1960’s
1940’s
0 1 2 3
01234
6 snp 5 snp 8 snp 7 snp 10 snp 9 snp 15 snp 15 snp
era
ratioobserved/randomized 0
0.00.10.20.30.40.50.6
Moran’sI
BSSNSSIDT
manhattandistance
050001500025000
123123123
!
selection
ancestry
deviation
number
ancestors
0 1 2 3
0.00.20.40.60.81.0
era
p
!
selection
ancestry
deviation
number
ancestors
0 1 2 3
0.00.20.40.60.81.0
era
p
!
selection
ancestry
deviation
number
ancestors
Diversity
Genome Sequence
Selective Sweep
!
selection
ancestry
deviation
number
ancestors
!
selection
ancestry
deviation
number
ancestors
10,000 ft view: drift and diversity loss
• increasingly small, homogeneous germplasm
making up ancestry of modern lines
10,000 ft view: drift and diversity loss
• increasingly small, homogeneous germplasm
making up ancestry of modern lines
• changing ancestry not selection (sweeps)
drives diversity across all heterotic groups
10,000 ft view: drift and diversity loss
• increasingly small, homogeneous germplasm
making up ancestry of modern lines
• changing ancestry not selection (sweeps)
drives diversity across all heterotic groups
• no evidence that popular lines have more
good alleles
Genetic change within a single
program: BSSS/BSCB1
Gerke et al. 2015 Genetics
Genetic change within a single
program: BSSS/BSCB1
Gerke et al. 2015 Genetics
BSSS1
BSCB11
BSSS1
BSCB11
BSSS1
BSCB11
S1
S1
BSSS1
BSCB11
yield trials
S1
S1
BSSS1
BSCB11
yield trials
S1
S1
Ne~20
BSSS1
BSCB11
yield trials
S1
S1
BSSS2
BSCB2
Ne~20
Morell, Buckler, and Ross-Ibarra. Nat. Rev. Genetics. 2012
Genetic load refers to the reduction in fitness caused by suboptimal genotypes in a population121
. Genetic load can
arise in a number of ways, including directional selection, recombination or mutation. Mutational load — the
presence of deleterious mutations segregating in a population — is of particular interest for crop genomics.
Deleterious mutations are most readily detected in protein-coding genes and can take several forms, including
premature stop codons, splice site variants or insertions and deletions (indels) that result in the loss or impairment
Nature Reviews | Genetics
. . . A A C G C C T T C . . .
. . . A A C G A C T T C . . .
. . . A A C G C C T T C . . .
. . . A A C G A C T T C . . .
. . . A G A G G A C T C . . .
. . . C G A G G A C T C . . .
. . . A G G G G A C T C . . .
. . . A G A G G A C T C . . .
. . . A A C G A C T T C . . .
. . . A A C G C C T T C . . .
. . . A G A G G A C T C . . .
. . . C G A G G C C T C . . .
. . . A G G G G A C T C . . .
. . . A G A G G A C T C . . .
. . . A A C G C C T T C . . .
. . . A A C G C C T T T . . .
. . . A G A A G A C T C . . .
. . . A G A A G A C T A . . .
. . . A G A A G A C T C . . .
. . . A G A G G A C T C . . .
. . . A G A A G A C T C . . .
Derived population 1 Derived population 2
. . . A A T G C C T T C . . .
. . . A A C G C C T T T . . .
. . . A G G G G A C T C . . .
. . . A G A A G A C T C . . .
Gene 1 Gene 2
Gene 2 Gene 1 Gene 2
. . . A A C G A T C T C . . .
HisAsn Leu
AspAsn Leu
. . . A A T C A T C T C . . .
. . . A A T G C G T T C . . .
. . . A A C G C G T T C . . .
Ancestral populationb
Sorghum
Maize
Gene 1
Morell, Buckler, and Ross-Ibarra. Nat. Rev. Genetics. 2012
Genetic load refers to the reduction in fitness caused by suboptim
arise in a number of ways, including directional selection, recomb
presence of deleterious mutations segregating in a population —
Deleterious mutations are most readily detected in protein-codin
premature stop codons, splice site variants or insertions and dele
of protein function. These types of mutations are frequently assoc
providing direct evidence that loss-of-function changes tend to b
. . . A A C G C C T T C . . .
. . . A A C G A C T T C . . .
. . . A A C G C C T T C . . .
. . . A A C G A C T T C . . .
. . . A G A G G A C T C . . .
. . . C G A G G A C T C . . .
. . . A G G G G A C T C . . .
. . . A G A G G A C T C . . .
. . . A
. . . A
. . . A
. . . A
. . . A
Derived population 1
. . . A
ed by suboptimal genotypes in a population121
. Genetic load can
ection, recombination or mutation. Mutational load — the
population — is of particular interest for crop genomics.
protein-coding genes and can take several forms, including
tions and deletions (indels) that result in the loss or impairment
Nature Reviews | Genetics
C . . .
C . . .
C . . .
C . . .
C . . .
C . . .
. . . A A C G C C T T C . . .
. . . A A C G C C T T T . . .
. . . A G A A G A C T C . . .
. . . A G A A G A C T A . . .
. . . A G A A G A C T C . . .
. . . A G A G G A C T C . . .
. . . A G A A G A C T C . . .
Derived population 2
Gene 1 Gene 2
. . . A A T G C G T T C . . .
Genetic load refers to the reduction in fitness caused by suboptimal genotypes in a population121
. Genetic load can
arise in a number of ways, including directional selection, recombination or mutation. Mutational load — the
presence of deleterious mutations segregating in a population — is of particular interest for crop genomics.
Deleterious mutations are most readily detected in protein-coding genes and can take several forms, including
premature stop codons, splice site variants or insertions and deletions (indels) that result in the loss or impairment
Nature Reviews | Genetics
. . . A A C G C C T T C . . .
. . . A A C G A C T T C . . .
. . . A A C G C C T T C . . .
. . . A A C G A C T T C . . .
. . . A G A G G A C T C . . .
. . . C G A G G A C T C . . .
. . . A G G G G A C T C . . .
. . . A G A G G A C T C . . .
. . . A A C G A C T T C . . .
. . . A A C G C C T T C . . .
. . . A G A G G A C T C . . .
. . . C G A G G C C T C . . .
. . . A G G G G A C T C . . .
. . . A G A G G A C T C . . .
. . . A A C G C C T T C . . .
. . . A A C G C C T T T . . .
. . . A G A A G A C T C . . .
. . . A G A A G A C T A . . .
. . . A G A A G A C T C . . .
. . . A G A G G A C T C . . .
. . . A G A A G A C T C . . .
Derived population 1 Derived population 2
. . . A A T G C C T T C . . .
. . . A A C G C C T T T . . .
. . . A G G G G A C T C . . .
. . . A G A A G A C T C . . .
Gene 1 Gene 2
Gene 2 Gene 1 Gene 2
. . . A A C G A T C T C . . .
HisAsn Leu
AspAsn Leu
. . . A A T C A T C T C . . .
. . . A A T G C G T T C . . .
. . . A A C G C G T T C . . .
Ancestral populationb
Sorghum
Maize
Gene 1
Complementation & Hybrid Vigor
Genetic change within a single
program: BSSS/BSCB1
Genetic change within a single
program: BSSS/BSCB1
• genetic drift explains most change in
diversity
Genetic change within a single
program: BSSS/BSCB1
• genetic drift explains most change in
diversity
• little overlap in selected regions
Genetic change within a single
program: BSSS/BSCB1
• genetic drift explains most change in
diversity
• little overlap in selected regions
• complementation of deleterious alleles
rather than overdominance likely basis of
heterosis
How important are deleterious
variants?
Mezmouk & Ross-Ibarra G3 2014
similar AA
likely neutral
similar AA
likely neutral
different AA
likely deleterious
similar AA
likely neutral
different AA
likely deleterious
nss
ts
0 0.1 0.2 0.3 0.4 0.5 0.6 0.7 0.8 0.9 1
00.10.20.30.40.50.60.70.80.91
NSS
TROPICAL
Deleterious allele frequency
nss
ts
0 0.1 0.2 0.3 0.4 0.5 0.6 0.7 0.8 0.9 1
00.10.20.30.40.50.60.70.80.91
NSS
TROPICAL
nss
ts
0 0.1 0.2 0.3 0.4 0.5 0.6 0.7 0.8 0.9 1
00.10.20.30.40.50.60.70.80.91
ss
nss
00.10.20.30.40.50.60.70.80.91
0 0.1 0.2 0.3 0.4 0.5 0.6 0.7 0.8 0.9 1
SS
NSS
Deleterious allele frequency
nss
ts
0 0.1 0.2 0.3 0.4 0.5 0.6 0.7 0.8 0.9 1
00.10.20.30.40.50.60.70.80.91
NSS
TROPICAL
nss
ts
0 0.1 0.2 0.3 0.4 0.5 0.6 0.7 0.8 0.9 1
00.10.20.30.40.50.60.70.80.91
ss
nss
00.10.20.30.40.50.60.70.80.91
0 0.1 0.2 0.3 0.4 0.5 0.6 0.7 0.8 0.9 1
SS
NSS
Deleterious allele frequency
23456789
chr10
−log10(p)
20 40 60 80 100 120 140
●
●●● ●
●
●
●
●
●
●
●
Chromosome 1
Proportionnonsynomyous
0.00.40.8
7 42 77 119 168 217 266
Chromosome 1
Proportionnonsynomyous
0.00.40.8
7 42 77 119 168 217 266
Chromosome 1
Proportionnonsynomyous
0.00.40.8
7 42 77 119 168 217 266
Gore et al. 2009 ScienceLarièpe et al. 2012 Genetics
How important are deleterious variants?
• deleterious alleles common, usually at low
frequency in at least one group
How important are deleterious variants?
• deleterious alleles common, usually at low
frequency in at least one group
• all traits show enrichment of genes with
deleterious alleles
How important are deleterious variants?
• deleterious alleles common, usually at low
frequency in at least one group
• all traits show enrichment of genes with
deleterious alleles
• complementation of deleterious alleles in
low recombination regions likely important
for heterosis
Experimental test of deleterious
complementation
Yang et al. bioRxiv 2017
B73 Mo17 PHZ51
B73
Mo17
PHZ51
B73 Mo17 PHZ51
B73
Mo17
PHZ51
B73 Mo17 PHZ51
B73
Mo17
PHZ51
Flowering Time
Height
Yield
GERP = Neutral rate - Estimated rate
High GERP
(high function)
Low GERP
(low function)
●
●●●
TW
DTP
DTS
ASI
PHT
EHT
GY
0
50
●
●
●
●
●
●
●
●
●
●
●
●●
●●●●
●
●
●
●
●
●
●
●
●
●
●
●
●
●
●
●●
●
●
●
●
●
●
●
●
●
●
●
●
●
●
●
●
●
●
●
●
●
●
●
●
●
●
●
●
●
●
●
●
●
●
●
●
●
●
●
●
●
●
●
●
●
●
●
●
●
●
●
●
●
●
●
●
●
●
●
●
●
●
●
●
●
●
●
●
●
●
●
●
●
●
●●
●
●
●
●
●
●
●
●●
●
●
●
●
●
●
●
●●
●
●●
●
●
●
●
●
●
●
●●
●
●
●
●
●
●
●
●
●
●
●
●
●
●
●
●
●
●
●●
●
●
●
●
●
●●
●●
●
●
●
●
●
●
●
●
●
●
●
●
●
●
●
●
●
●
●●
●
●
●
●●
●
●
●
●
●
●
●
●
●
●
●
●
●
●
●
●
●
●
●
●
●
●
●
●●
●
●
●
●
●
●
●
●
●
●
●●
●
●
●
●
●
●
●
●
●
●
●
●
●
●
●
●
●
●
●
●
●
●
●
●
●●
●
●
●
●●
●
●
●
●
●
●
●
●
●
●
●
●
●
●
●
●
●
●
●
●
●
●
●
●
●
●
●
●
●
●●
●
●
●
●
●
●
●●
●
●
●
●
●
●
●
●
●
●
●
●
●
●
●
●
●
●
●
●
●
●
●
●
●
●
●
●
●
●
●
●
●
●
●
●
●
●
●
●
●
●
●
●
●
●●
●
●
●
●
●●
●●
●
●
●●●
●
●
●
●
●
●●
●
●
●
●
●
●
●
●
●
●
●
●
●
●
●
●
●
●
●
●
●
●
●
●
●
●
●
●
●
●
●
●
●
●
●
●
●
●
●
●
●
●
●
●
●
●
●
●
●
●●
●
●
●
●
●
●
●
●
●
●
●
●●
●
●
●●
●
●
●
●
●
●●
●
●
●
●
●
●
●
●
●
●
●
●
●
●
●
●
●
●●
●
●
●
●
●
●
●
●
●
●
●
●
●
●
●
●
●
●
●
●●
●
●
●
●
●●
●
●
●
●
●
●
●
●
●
●
●
●
●
●
●
●
●
●
●
●●
●
●
●●●
●
●
●
●
●
●
●
●
●
●
●
●
●
●
●
●●●
●
●
●
●
●
●
●
●●
●
●
●
●
●
●
●
●
●●●
●●
●
●
●●
●
●
●
●
●
●
●
●
●
●
●
●
●
●
●
●
●
●
●
●
●
●
●
●
●
●
●
●
●●
●
●
●●●●
●●●
●
●
●
●●
●
●
●
●
●●
●
●●
●
●
●
●
●
●
●
●
●
●
●
●
●
●●
●
●
●
●
●
●
●
●●●
●
●●
●●●●
●●●
●
●
●
●●●
●●
●
●
●
●●●
●
●
●
●
●
●●●
●
●
●
●
●
●
●
●●
●
●
●
●●
●●
●
●
●
●●●
●
●
●
●
●
●
●
●
●
●
●●
●●
●
●
●
●
●
●●●●
●
●●
●
●
●
●
●●●
●
●●
●
●
●
●
●
●
●
●
●●
●
●
●
●
●●
●
●
●
●
●
●
●
●
●
●
●
●●
●
●
●
●
●
●●●
●
●
●
●
●
●
●
●
●
●
●●
●
●
●
●●
●
●●●
●
●
●
●
●●
●●●
●
●
●
●
●
●
●
●
●
●
●
●●
●
●
●
●
●
●
●
●●
●
●
●●
●
●
●
●
●
●
●
●
●
●
●
●
●
●
●●
●●
●
●
●
●
●
●
●
●
●
●
●
●
●
●
●●●
●
●●
●
●
●
●
●●
●
●
●
●
●
●
●●
●
●
●
●
●
●
●
●
●
●
●
●
●●
●
●
●
●
●
●
●
●
●
●
●●
●●
●
●
●
●●●●●
●●●
●
●●
●
●
●
●
●●
●●●
●
●
●
●
●
●●
●
●
●●
●
●●
●
●
●
●●
●
●
●●
●
●
●●
●
●●
●
●
●
●
●
●
●
●
●●
●●
●
●
●
●
●
●
●
●
●●
●
●
●
●
●
●
●
●
●
●
●
●
●
●
●●
●
●
●
●
●
●
●
●
●●
●
●
●
●
●
●●
●
●
●
●
●
●
●
●●
●
●
●
●
●
●
●
●
●
●
●
●
●
●
●
●
●
●
●
●
●
●
●
●
●
●
●
●
●
●
●
●
●
●
●
●
●
●
●
●
●
●
●
●
●●
●
●
●
●
●
●
●
●
●
●
●
●
●
●
●
●
●●
●
●
●●●
●●
●
●
●
●
●
●
●
●
●●
●
●●●
●
●
●
●
●
●
●
●
●
●
●
●
●
●
●
●
●
●
●
●●
●
●
●
●
●
●
●●
●
●
●●●
●
●
●
●
●
●
●
●
●
●
●
●
●
●
●
●
●
●
●
●
●
●
●●●
●
●
●
●
●
●
●
●
●
●
●
●
●
●
●
●
●
●●
●
●
●
●
●
●
●●
●
●
●
●●
●
●
●
●
●
●
●
●
●
●
●
●
●
●
●
●
●
●
●●
●
●
●
●●
●
●●
●●
●●
●
●
●
●
●
●
●
●
●
●
●
●
●
●
●
●
●
●●●
●
●
●
●
●
●
●
●
●
●
●
●
●
●
●
●
●
●
●
●
●
●
●
●
●
●
●●
●
●
●
●
●
●
●
●
●
●
●
●
●
●
●
●
●●
●●
●
●
●
●
●
●
●
●
●
●
●
●
●
●●
●
●
●
●
●
●●
●
●
●●●
●
●
●
●
●
●
●
●
●●
●
●
●
●
●
●
●
●
●
●
●
●
●●●
●
●
●
●
●
●
●
●●
●●
●
●
●
●●
●
●
●
●
●
●
●
●
●
●
●
●
●
●
●
●
●
●
●
●
●
●
●
●
●
●
●
●
●
●
●●
●
●
●
●●
●
●
●
●
●
●
●
●
●
●●
●
●
●
●
●
●
●
●
●
●
●
●
●
●
●●●●
●
●
●●
●
●
●
●
●
●
●
●
●
●
●
●
●
●
●
●
●
●
●
●
●
●
●
●
●●●●
●
●
●
●
●
●
●
●
●
●
●
●
●
●
●
●
●
●
●●
●
●
●
●
●
●
●
●
●
●
●
●
●
●
●
●
●
●
●
●
●
●
●
●
●
●
●
●
●
●
●
●
●
●
●
●●
●
●●
●
●●
●
●
●
●
●
●●
●
●
●
●
●●
●
●
●
●
●
●
●
●
●
●
●●
●
●
●
●
●
●
●
●
●
●
●●
●
●
●
●
●
●
●
●
●
●
●
●
●
●
●
●
●●
●●
●
●●●●
●
●
●
●
●
●
●●
●
●
●
●●
●
●
●
●
●
●
●
●●
●
●
●●
●
●
−10 −5 0 5
0.00.20.40.6
GERP Score
DeleteriousAlleleFrequency
●
●
LR MZ LR MZ LR MZ
0.080.
Delete
0.60.81.01.2
Quantiles of cM/Mb
GERPScore
25 50 75 100
c d
aj, additive effect of the jth GERP-SNP;
Xij, 0-1-2 coding of jth GERP-SNP on ith hybrid;
dj, dominance effect of the jth GERP-SNP;
Wij, 0-1-0 coding of jth GERP-SNP on ith hybrid.
Heterosis increasing
Height YieldFlowering Time
aj, additive effect of the jth GERP-SNP;
Xij, 0-1-2 coding of jth GERP-SNP on ith hybrid;
dj, dominance effect of the jth GERP-SNP;
Wij, 0-1-0 coding of jth GERP-SNP on ith hybrid.
Heterosis increasing
Height YieldFlowering Time
aj, additive effect of the jth GERP-SNP;
Xij, 0-1-2 coding of jth GERP-SNP on ith hybrid;
dj, dominance effect of the jth GERP-SNP;
Wij, 0-1-0 coding of jth GERP-SNP on ith hybrid.
k > 1 Overdominance
k = 1 Dominance
k = -1 Recessive
k < -1 Underdominance
k = 0 Additive
0.000.010.020.03
0.0 0.5 1.0 1.5 2.0
GERP Score
AdditiveEffect
0.000.010.020.03
0.0 0.5 1.0 1.5 2.0
GERP Score
DominantEffect
0.00.10.20.30.4
0.0
DegreeofDomiance(k)
c d e
0.5 1.0 1.5 2.0
GERP Score
0.00.10.20.30.4
0.0 0.5 1.0 1.5 2.0
GERP Score
DegreeofDomiance(k)
TW DTP DTS ASI PHT EHT GY
−1
0
1
2
Traits
TW
DTP
DTS
ASI
PHT
EHT
GY
e
0.000.010.020.03
0.0 0.5 1.0 1.5 2.0
GERP Score
AdditiveEffect
0.000.010.020.03
0.0 0.5 1.0 1.5 2.0
GERP Score
DominantEffect
0.00.10.20.30.4
0.0
DegreeofDomiance(k)
c d e
0.5 1.0 1.5 2.0
GERP Score
0.00.10.20.30.4
0.0 0.5 1.0 1.5 2.0
GERP Score
DegreeofDomiance(k)
TW DTP DTS ASI PHT EHT GY
−1
0
1
2
Traits
TW
DTP
DTS
ASI
PHT
EHT
GY
e
GenotypeGERP Scores
*
* * *
YieldFlowering Height
GERP
YieldFlowering Height
random
Experimental test of deleterious
complementation
• yield shows more dominance than other traits
• how deleterious an allele is matters for yield
• deleterious alleles are recessive (for yield)
• modeling complementation improves prediction
of hybrid yield and heterosis 5-10%
Heterosis yield
Duvick 2005 Maydica
Hybrid yield
Inbred yield
Unasked for opinions on heterotic
groups from a guy who knows nothing
about breeding
• The Good:
• intellectual & genetic control of germplasm
• hybrid vigor (it’s not all dominance)
• The Bad:
• diversity loss
• inefficient selection
Unasked for opinions on heterotic
groups from a guy who knows nothing
about breeding
• Option 1:
• heterotic groups, but large Ne and
genotype to enrich for recombination
• Option 2:
• mass (genomic) selection on randomly
mated populations
Joost
van Heerwaarden
Justin
Gerke
Sofiane
Mezmouk
Jinliang
Yang
Wageningen
University
Dupont Pioneer KWS U. Nebraska Lincoln
Evolutionary genetics of hybrid maize

Evolutionary genetics of hybrid maize