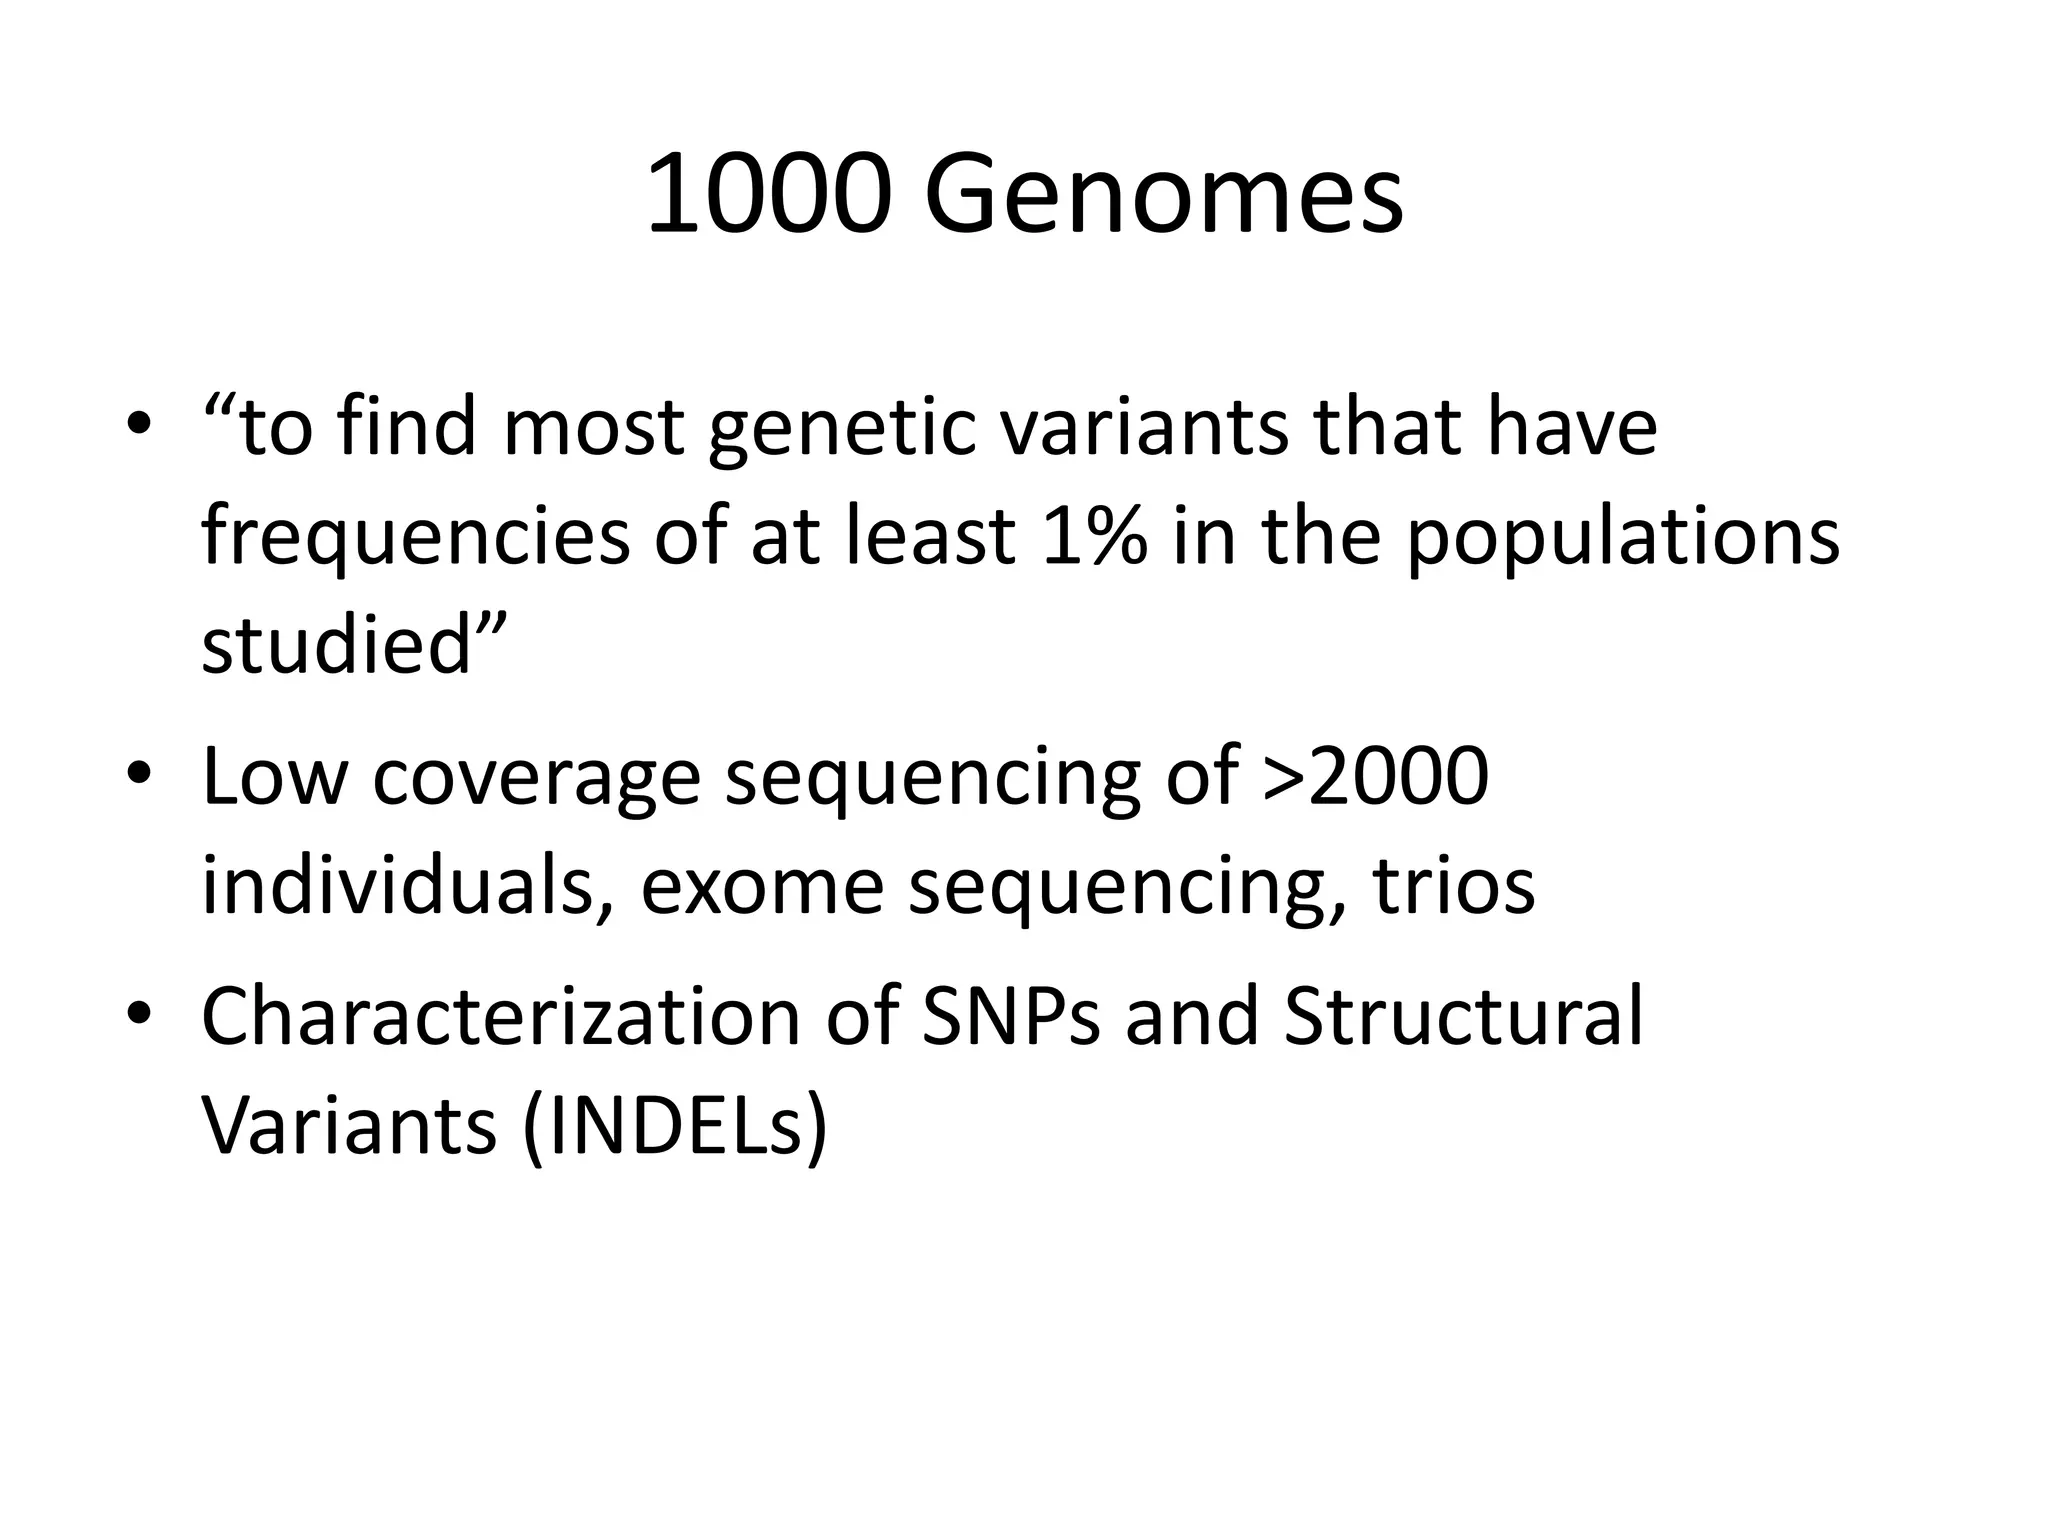
SNPs: the HapMap and 1000
    Genomes Projects
       Joseph Replogle
     Cavalcanti Lab Group
          5/25/2012
Understanding Human Genetic Variation
   Within and Among Populations
Types of Human Genetic Variation
• Individual: de novo and rare variations
• Population: variations which have become
  fixed within a population
  – Single Nucleotide Polymorphisms (SNPs): base
    pair substitutions
     • Transition: purine -> purine (A<->G), pyrimidine ->
       pyrimidine (C<->T)
     • Transversion: purine <-> pyrimidine
     • common ~1-5% minor allele frequency (MAF) in major
       populations
Types of Human Genetic Variation
            (cont.)
– Copy-Number Variations (CNVs):
   • insertions, deletions, duplications of DNA segments
     (>1kb)
– Other Variations:
   • Structural: inversions
   • Repeats: microsatellites (STRs), minisatellites (VNTRs)
   • Frameshift mutations
SNP Distribution throughout the
       HLA!
              Genome
                                  Sachidanandam et al. 2001


• Genetic variability throughout the genome
  reflects function (among other factors)
Factors Affecting SNP Distribution
                         • Intrinsic, Structural:
                           Mutation clusters due to
                           recombination events and
                           sequence context-specific
                           effects [3,4]
                             – a) Time to Most Recent
                               Common Ancestor of
                               genes in population
                               influences SNPs (older
                               genes -> more SNPs in
                               population)
                             – b) base
                               composition, local
                               recombination, gene
                               density, chromatin
                               structure, nucleosome
                               position, replication
                               timing


Lercher and Hurst 2002
Factors Affecting SNP Distribution
                 (cont.)
• Functional: mutation clusters due to natural
  selection (examples include immunoglobulin
  genes)
      a) balancing selection increases diversity
      b) purifying and directional selection
      decrease diversity
      c) transcriptional activity
• Ascertainment bias: better characterization of
  SNPs around genes of interest [5]
Effects of Genetic Variation
• Pathogenic and non-pathogenic heritable traits
• Genetic variation reveals millions of years of
  human history
  – “One can think of selective pressures as natural, in
    vivo human experiments in which we can measure the
    response of human populations to unknown
    perturbations, and these alterations can inform the
    function of genes within a given locus.” Raj et al. 2012
  – Understand the history of mutation, selection and
    recombination within the human genome
Potential Uses of SNP data
Ultimately, synergy of genomics and functional work
  will allow us to understand human traits and disease.

• Association Mapping: Genome Wide
  Association (GWA) studies,
  Pharmacogenomics
• Modeling Mendelian and Complex diseases
• eQTL and functional genomics
• Selection!
Selection: EHH and iHS
• Extended Haplotype Homozygosity (EHH)
• Integrated Haplotype Score (iHS)
                                   Chromosome 2

                                   Voight et al. 2006
Selection of Lassa Fever Susceptibility
             Genes in YRI populations


Andersen et al (2012)
eQTL
                      SLE susceptibility locus
                      (rs11755393; GWAS p= 2.20 x 10 -08 )


           Positive Selection


Slide from Replogle
and Raj
International HapMap Project
• “to identify and catalog genetic
  similarities and differences in
  human beings”
• Haplotype Map: SNPs (genotypes)
  at separate loci whose alleles are
  statistically associated due to
  limited genetic recombination


                                       HapMap Project
Linkage Disequilibrium (LD)
• Alleles at different loci are not independent
  due to
           Linkage equilibrium         Linkage disequilibrium
                   fB        fb                 fB        fb

                                         AB
                                                     Ab
      fA          AB        Ab    fA


      fa                          fa          aB
                 aB         ab                             ab


           Image by Gil McVean
Origin of LD
                  .
                  .
                  .                           .
                                              .
                                              .                         .
                                                                        .
                                                                        .


       The mutation arises on a     If the mutation            Over time the
       particular genetic          increases in                association between the
       background                  frequency, the              new mutation and linked
                                   associated haplotype        mutations will decay by
                                   will also increase in       recombination
                                   frequency.
                                                               Recombination is the
                                   Factors Increasing LD:      only factor which
                                   1) Genetic Drift            decreases LD.
                                       (stochastic sampling)
                                   2) Selection
Image modified from                3) Non-Random
Gil McVean                             Mating
Haplotype
HapMap Project


      •   ~107 common (MAF >1%) SNPs in the human genome
      •   ‘tag SNPs’ allow for identification of an individual’s haplotypes
      •   Estimated 300,000-600,000 tag SNPs in genome
      •   Genotyping: testing tag SNPs
      •   Sequencing: whole genome sequence
HapMap Populations
•   270 total DNA samples
•   Yoruba in Ibadan, Nigeria (YRI)
•   Japanese in Tokyo, Japan (JPT)
•   Han Chinese in Beijing, China (CHB)
•   CEPH (Utah residents with ancestry from
    northern and western Europe) (CEU)
HapMap Methodology
• Genotype individuals for several million SNPs
   – 1 SNP per 5kb or less
   – MAF >1% as estimated by TSC project, JSNP, dbSNP, and
     initial SNP map
   – Random shotgun sequencing to obtain additional SNPs
   – Coding and noncoding SNPs
• Data analysis to identify LD and Haplotype maps
• Tag SNPs are useful with haplotype and recombination
  map
• Data available online in multiple formats
  http://hapmap.ncbi.nlm.nih.gov/downloads/index.htm
  l.en
HapMap Methodology (cont.)
• Data analysis to identify LD and Haplotype
  maps
• Tag SNPs are useful with haplotype and
  recombination map
• Data available online in multiple formats
  http://hapmap.ncbi.nlm.nih.gov/downloads/i
  ndex.html.en
• Phase III data released 2009
Reference
   Genome?
• Mosaic haploid
  DNA sequence
• GRCh37
1000 Genomes
• “to find most genetic variants that have
  frequencies of at least 1% in the populations
  studied”
• Low coverage sequencing of >2000
  individuals, exome sequencing, trios
• Characterization of SNPs and Structural
  Variants (INDELs)
1000 Genomes Populations
•   Yoruba in Ibadan, Nigeria (YRI)
•   Japanese in Tokyo, Japan (JPT)
•   Han Chinese in Beijing, China (CHB)
•   CEPH (Utah residents with ancestry from
    northern and western Europe) (CEU)
•   Luhya in Webuye, Kenya (LWK)
•   Toscani in Italy (TSI)
•   Peruvians in Lima, Peru (PER)
•   Mexican ancestry in Los Angeles, CA (MXL)
•   And many more!
“Low-Coverage” Sequencing
• Sequencing:
1) DNA copies broken into short pieces
2) Each piece is sequenced (random pieces means
   most of genome is covered)
3) Sequenced fragments are aligned and joined to
   determine complete genome
• 28X sequencing coverage necessary for
   complete genome
• Low-coverage sequencing (4X coverage): many
   pieces of individual genomes are missed
1000 Genomes Data
• Latest release:
  – 1092 samples
  – SNP, indel, and large deletion
  – Autosomes and chrX
  – ~38.2 M SNPs from low coverage and exome
    sequencing
• 1000genomes site has a link to a NCBI FTP
  with their latest data
VCF file format
• Variant Call Format 4.1: meta-info followed by
  header and data
• tab-delimited text file
• Compressed .gz
zcat file.vcf.gz| grep -e ^# -e SNP | bgzip -c >
  snps.vcf.gz
• http://www.1000genomes.org/wiki/Analysis/Vari
  ant%20Call%20Format/vcf-variant-call-format-
  version-41
Columns in VCF format
• CHROM: chromosome (no colons)
• POS: numerical reference position, with the 1st base having
  position 1 (some variants have multiple pos records)
• ID: semi-colon separated list of unique identifiers where available
  (ex. dbSNP rs number)
• EF: reference base(s) A,C,G,T,N (case insensitive) for a given variant
• ALT: comma separated list of alternate non-reference alleles called
  on at least one of the samples.
• QUAL: phred-scaled quality score for the assertion made in
  ALT. i.e. -10log_10 prob(call in ALT is wrong)
• FILTER: another quality measure; PASS if this position has passed all
  filters
• INFO: semicolon seperated additional info; ex. AF (allele
  frequency), DB (dbSNP membership), VALIDATED
Durbin et al. 2004
Interested?
• Get Prof. Cavalcanti to buy Human
  Evolutionary Genetics: Origins, Peoples and
  Disease
References
1.    Sachidanandam R et al. (2001) A map of human genome sequence variation containing 1.42 million single
      nucleotide polymorphisms. Nature 409: 928-933.
2.    Lercher MJ and Hurst LD (2002) Human SNP variability and mutation rate are higher in regions of high
      recombination Trends Genet. 18: 337-340.
3.    Rogozin IB and Pavlov YI (2003) Theoretical analysis of mutational hotspots and their DNA sequence context
      specificity. Mutat Res 544(1): 65-85.
4.    Ma X, et al. (2012) Mutation Hot Spots in Yeast Caused by Long-Range Clustering of Homopolymeric
      Sequences.Cell Reports 1(1): 36-42.
5.    Clark AG, et al. (2005) Ascertainment bias in studies of human genome-wide polymorphism. Genome Res
      15: 1496-1502.
6.    Raj T et al. (2012) Alzheimer Disease Susceptibility Loci: Evidence for a Protein Network under Natural Selection.
      AJHG 90 720-726.
7.    Voight BF et al. (2006) A Map of Recent Positive Selection in the Human Genome. PLoS Biology 4(3): e72.
8.    Andersen KG et al. (2012) Genome-wide scans provide evidence for positive selection of genes implicated in
      Lassa fever. Philos Trans R Soc Lond B Biol Sci 367(1590): 868-877.
9.    Hapmap.org
10.   McVean, Gil (2004). Population Genetics of the Human Genome. Oxford Human Genome Lecture Series.
11.   Gibbs RA et al. (2003) The International HapMap Project. Nature 426: 789-796.
12.   1000genomes.org
13.   Durbin R M et al. (2010). A map of human genome variation from population-scale sequencing. Nature
      467(7319): 1061-1073.

SNPs Presentation Cavalcanti Lab

  • 1.
    SNPs: the HapMapand 1000 Genomes Projects Joseph Replogle Cavalcanti Lab Group 5/25/2012
  • 2.
    Understanding Human GeneticVariation Within and Among Populations
  • 3.
    Types of HumanGenetic Variation • Individual: de novo and rare variations • Population: variations which have become fixed within a population – Single Nucleotide Polymorphisms (SNPs): base pair substitutions • Transition: purine -> purine (A<->G), pyrimidine -> pyrimidine (C<->T) • Transversion: purine <-> pyrimidine • common ~1-5% minor allele frequency (MAF) in major populations
  • 4.
    Types of HumanGenetic Variation (cont.) – Copy-Number Variations (CNVs): • insertions, deletions, duplications of DNA segments (>1kb) – Other Variations: • Structural: inversions • Repeats: microsatellites (STRs), minisatellites (VNTRs) • Frameshift mutations
  • 5.
    SNP Distribution throughoutthe HLA! Genome Sachidanandam et al. 2001 • Genetic variability throughout the genome reflects function (among other factors)
  • 6.
    Factors Affecting SNPDistribution • Intrinsic, Structural: Mutation clusters due to recombination events and sequence context-specific effects [3,4] – a) Time to Most Recent Common Ancestor of genes in population influences SNPs (older genes -> more SNPs in population) – b) base composition, local recombination, gene density, chromatin structure, nucleosome position, replication timing Lercher and Hurst 2002
  • 7.
    Factors Affecting SNPDistribution (cont.) • Functional: mutation clusters due to natural selection (examples include immunoglobulin genes) a) balancing selection increases diversity b) purifying and directional selection decrease diversity c) transcriptional activity • Ascertainment bias: better characterization of SNPs around genes of interest [5]
  • 8.
    Effects of GeneticVariation • Pathogenic and non-pathogenic heritable traits • Genetic variation reveals millions of years of human history – “One can think of selective pressures as natural, in vivo human experiments in which we can measure the response of human populations to unknown perturbations, and these alterations can inform the function of genes within a given locus.” Raj et al. 2012 – Understand the history of mutation, selection and recombination within the human genome
  • 9.
    Potential Uses ofSNP data Ultimately, synergy of genomics and functional work will allow us to understand human traits and disease. • Association Mapping: Genome Wide Association (GWA) studies, Pharmacogenomics • Modeling Mendelian and Complex diseases • eQTL and functional genomics • Selection!
  • 10.
    Selection: EHH andiHS • Extended Haplotype Homozygosity (EHH) • Integrated Haplotype Score (iHS) Chromosome 2 Voight et al. 2006
  • 11.
    Selection of LassaFever Susceptibility Genes in YRI populations Andersen et al (2012)
  • 12.
    eQTL SLE susceptibility locus (rs11755393; GWAS p= 2.20 x 10 -08 ) Positive Selection Slide from Replogle and Raj
  • 13.
    International HapMap Project •“to identify and catalog genetic similarities and differences in human beings” • Haplotype Map: SNPs (genotypes) at separate loci whose alleles are statistically associated due to limited genetic recombination HapMap Project
  • 14.
    Linkage Disequilibrium (LD) •Alleles at different loci are not independent due to Linkage equilibrium Linkage disequilibrium fB fb fB fb AB Ab fA AB Ab fA fa fa aB aB ab ab Image by Gil McVean
  • 15.
    Origin of LD . . . . . . . . . The mutation arises on a If the mutation Over time the particular genetic increases in association between the background frequency, the new mutation and linked associated haplotype mutations will decay by will also increase in recombination frequency. Recombination is the Factors Increasing LD: only factor which 1) Genetic Drift decreases LD. (stochastic sampling) 2) Selection Image modified from 3) Non-Random Gil McVean Mating
  • 16.
    Haplotype HapMap Project • ~107 common (MAF >1%) SNPs in the human genome • ‘tag SNPs’ allow for identification of an individual’s haplotypes • Estimated 300,000-600,000 tag SNPs in genome • Genotyping: testing tag SNPs • Sequencing: whole genome sequence
  • 17.
    HapMap Populations • 270 total DNA samples • Yoruba in Ibadan, Nigeria (YRI) • Japanese in Tokyo, Japan (JPT) • Han Chinese in Beijing, China (CHB) • CEPH (Utah residents with ancestry from northern and western Europe) (CEU)
  • 18.
    HapMap Methodology • Genotypeindividuals for several million SNPs – 1 SNP per 5kb or less – MAF >1% as estimated by TSC project, JSNP, dbSNP, and initial SNP map – Random shotgun sequencing to obtain additional SNPs – Coding and noncoding SNPs • Data analysis to identify LD and Haplotype maps • Tag SNPs are useful with haplotype and recombination map • Data available online in multiple formats http://hapmap.ncbi.nlm.nih.gov/downloads/index.htm l.en
  • 19.
    HapMap Methodology (cont.) •Data analysis to identify LD and Haplotype maps • Tag SNPs are useful with haplotype and recombination map • Data available online in multiple formats http://hapmap.ncbi.nlm.nih.gov/downloads/i ndex.html.en • Phase III data released 2009
  • 20.
    Reference Genome? • Mosaic haploid DNA sequence • GRCh37
  • 21.
    1000 Genomes • “tofind most genetic variants that have frequencies of at least 1% in the populations studied” • Low coverage sequencing of >2000 individuals, exome sequencing, trios • Characterization of SNPs and Structural Variants (INDELs)
  • 22.
    1000 Genomes Populations • Yoruba in Ibadan, Nigeria (YRI) • Japanese in Tokyo, Japan (JPT) • Han Chinese in Beijing, China (CHB) • CEPH (Utah residents with ancestry from northern and western Europe) (CEU) • Luhya in Webuye, Kenya (LWK) • Toscani in Italy (TSI) • Peruvians in Lima, Peru (PER) • Mexican ancestry in Los Angeles, CA (MXL) • And many more!
  • 23.
    “Low-Coverage” Sequencing • Sequencing: 1)DNA copies broken into short pieces 2) Each piece is sequenced (random pieces means most of genome is covered) 3) Sequenced fragments are aligned and joined to determine complete genome • 28X sequencing coverage necessary for complete genome • Low-coverage sequencing (4X coverage): many pieces of individual genomes are missed
  • 24.
    1000 Genomes Data •Latest release: – 1092 samples – SNP, indel, and large deletion – Autosomes and chrX – ~38.2 M SNPs from low coverage and exome sequencing • 1000genomes site has a link to a NCBI FTP with their latest data
  • 25.
    VCF file format •Variant Call Format 4.1: meta-info followed by header and data • tab-delimited text file • Compressed .gz zcat file.vcf.gz| grep -e ^# -e SNP | bgzip -c > snps.vcf.gz • http://www.1000genomes.org/wiki/Analysis/Vari ant%20Call%20Format/vcf-variant-call-format- version-41
  • 26.
    Columns in VCFformat • CHROM: chromosome (no colons) • POS: numerical reference position, with the 1st base having position 1 (some variants have multiple pos records) • ID: semi-colon separated list of unique identifiers where available (ex. dbSNP rs number) • EF: reference base(s) A,C,G,T,N (case insensitive) for a given variant • ALT: comma separated list of alternate non-reference alleles called on at least one of the samples. • QUAL: phred-scaled quality score for the assertion made in ALT. i.e. -10log_10 prob(call in ALT is wrong) • FILTER: another quality measure; PASS if this position has passed all filters • INFO: semicolon seperated additional info; ex. AF (allele frequency), DB (dbSNP membership), VALIDATED
  • 27.
  • 28.
    Interested? • Get Prof.Cavalcanti to buy Human Evolutionary Genetics: Origins, Peoples and Disease
  • 29.
    References 1. Sachidanandam R et al. (2001) A map of human genome sequence variation containing 1.42 million single nucleotide polymorphisms. Nature 409: 928-933. 2. Lercher MJ and Hurst LD (2002) Human SNP variability and mutation rate are higher in regions of high recombination Trends Genet. 18: 337-340. 3. Rogozin IB and Pavlov YI (2003) Theoretical analysis of mutational hotspots and their DNA sequence context specificity. Mutat Res 544(1): 65-85. 4. Ma X, et al. (2012) Mutation Hot Spots in Yeast Caused by Long-Range Clustering of Homopolymeric Sequences.Cell Reports 1(1): 36-42. 5. Clark AG, et al. (2005) Ascertainment bias in studies of human genome-wide polymorphism. Genome Res 15: 1496-1502. 6. Raj T et al. (2012) Alzheimer Disease Susceptibility Loci: Evidence for a Protein Network under Natural Selection. AJHG 90 720-726. 7. Voight BF et al. (2006) A Map of Recent Positive Selection in the Human Genome. PLoS Biology 4(3): e72. 8. Andersen KG et al. (2012) Genome-wide scans provide evidence for positive selection of genes implicated in Lassa fever. Philos Trans R Soc Lond B Biol Sci 367(1590): 868-877. 9. Hapmap.org 10. McVean, Gil (2004). Population Genetics of the Human Genome. Oxford Human Genome Lecture Series. 11. Gibbs RA et al. (2003) The International HapMap Project. Nature 426: 789-796. 12. 1000genomes.org 13. Durbin R M et al. (2010). A map of human genome variation from population-scale sequencing. Nature 467(7319): 1061-1073.