Evaluation for Stability Data -ICH Q1E -Dr. A. Amsavel Ph.D.pdf
Stability Study -Introduction
Scope & Purpose
Definition
Stability data requirement
Zone Classification / Countries
Stability Study / data required
Stability Data Evaluation-Decision tree
Extension of Retest period
Statistical Analysis/Approaches
Evaluation for Stability Data -ICH Q1E -Dr. A. Amsavel Ph.D.pdf
1.
1
ICH Q1E :Evaluation for Stability
Data
Dr. A. Amsavel M.Sc., B.Ed., Ph.D.,
2.
An Over View
Stability Study -Introduction
Scope & Purpose
Definition
Stability data requirement
Zone Classification / Countries
Stability Study / data required
Data Evaluation-Decision tree
Extension of Retest period
Statistical Analysis/Approaches
3.
What do weknow?
What is Stability study?
Why do we required stability study?
Why do we perform stability at different condition?
What are the different Zones and how it is classified?
What will happen if stability study not meeting the
acceptance criteria?
4.
ICH -Q1E: Evaluationfor Stability Data
ICH -Q1 E Evaluation for Stability Data guideline
provides the recommendations to establish retest
periods and shelf life for drug substances and drug
products intended for storage.
5.
Scope and Purpose
Evaluation and interpretation to determine the shelf life
It propose rational for retest period or shelf life in a
registration application.
When and how extrapolation can be considered for retest
period or a shelf life can be extended beyond the period
covered by long-term data
Statistical approaches to stability data analysis
6.
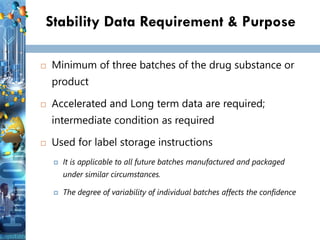
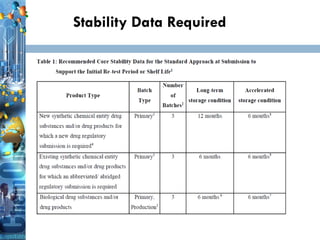
Stability Data Requirement& Purpose
Minimum of three batches of the drug substance or
product
Accelerated and Long term data are required;
intermediate condition as required
Used for label storage instructions
It is applicable to all future batches manufactured and packaged
under similar circumstances.
The degree of variability of individual batches affects the confidence
7.
Definition
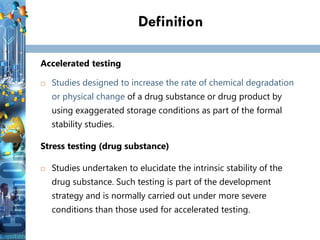
Accelerated testing
Studiesdesigned to increase the rate of chemical degradation
or physical change of a drug substance or drug product by
using exaggerated storage conditions as part of the formal
stability studies.
Stress testing (drug substance)
Studies undertaken to elucidate the intrinsic stability of the
drug substance. Such testing is part of the development
strategy and is normally carried out under more severe
conditions than those used for accelerated testing.
8.
Definition
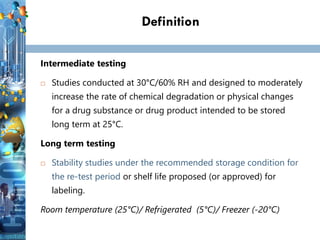
Intermediate testing
Studiesconducted at 30°C/60% RH and designed to moderately
increase the rate of chemical degradation or physical changes
for a drug substance or drug product intended to be stored
long term at 25°C.
Long term testing
Stability studies under the recommended storage condition for
the re-test period or shelf life proposed (or approved) for
labeling.
Room temperature (25°C)/ Refrigerated (5°C)/ Freezer (-20°C)
9.
Definition
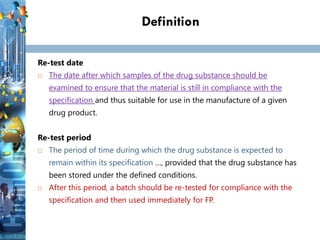
Re-test date
Thedate after which samples of the drug substance should be
examined to ensure that the material is still in compliance with the
specification and thus suitable for use in the manufacture of a given
drug product.
Re-test period
The period of time during which the drug substance is expected to
remain within its specification …, provided that the drug substance has
been stored under the defined conditions.
After this period, a batch should be re-tested for compliance with the
specification and then used immediately for FP.
10.
Definition
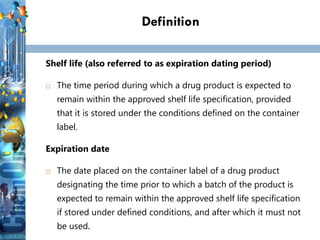
Shelf life (alsoreferred to as expiration dating period)
The time period during which a drug product is expected to
remain within the approved shelf life specification, provided
that it is stored under the conditions defined on the container
label.
Expiration date
The date placed on the container label of a drug product
designating the time prior to which a batch of the product is
expected to remain within the approved shelf life specification
if stored under defined conditions, and after which it must not
be used.
11.
Definition
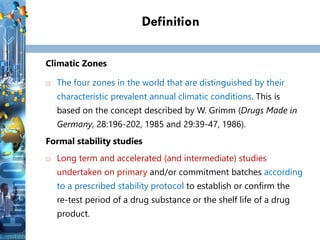
Climatic Zones
Thefour zones in the world that are distinguished by their
characteristic prevalent annual climatic conditions. This is
based on the concept described by W. Grimm (Drugs Made in
Germany, 28:196-202, 1985 and 29:39-47, 1986).
Formal stability studies
Long term and accelerated (and intermediate) studies
undertaken on primary and/or commitment batches according
to a prescribed stability protocol to establish or confirm the
re-test period of a drug substance or the shelf life of a drug
product.
13
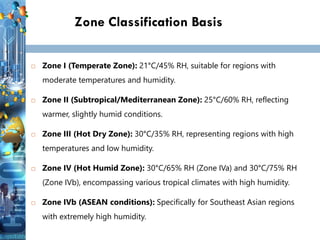
Zone Classification Basis
Zone I (Temperate Zone): 21°C/45% RH, suitable for regions with
moderate temperatures and humidity.
Zone II (Subtropical/Mediterranean Zone): 25°C/60% RH, reflecting
warmer, slightly humid conditions.
Zone III (Hot Dry Zone): 30°C/35% RH, representing regions with high
temperatures and low humidity.
Zone IV (Hot Humid Zone): 30°C/65% RH (Zone IVa) and 30°C/75% RH
(Zone IVb), encompassing various tropical climates with high humidity.
Zone IVb (ASEAN conditions): Specifically for Southeast Asian regions
with extremely high humidity.
13
14.
14
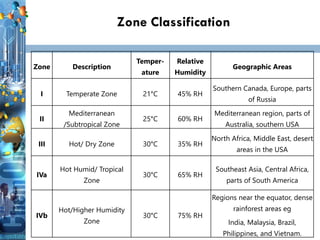
Zone Classification
14
Zone Description
Temper-
ature
Relative
Humidity
GeographicAreas
I Temperate Zone 21°C 45% RH
Southern Canada, Europe, parts
of Russia
II
Mediterranean
/Subtropical Zone
25°C 60% RH
Mediterranean region, parts of
Australia, southern USA
III Hot/ Dry Zone 30°C 35% RH
North Africa, Middle East, desert
areas in the USA
IVa
Hot Humid/ Tropical
Zone
30°C 65% RH
Southeast Asia, Central Africa,
parts of South America
IVb
Hot/Higher Humidity
Zone
30°C 75% RH
Regions near the equator, dense
rainforest areas eg
India, Malaysia, Brazil,
Philippines, and Vietnam.
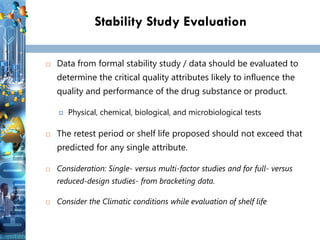
Stability Study Evaluation
Data from formal stability study / data should be evaluated to
determine the critical quality attributes likely to influence the
quality and performance of the drug substance or product.
Physical, chemical, biological, and microbiological tests
The retest period or shelf life proposed should not exceed that
predicted for any single attribute.
Consideration: Single- versus multi-factor studies and for full- versus
reduced-design studies- from bracketing data.
Consider the Climatic conditions while evaluation of shelf life
17.
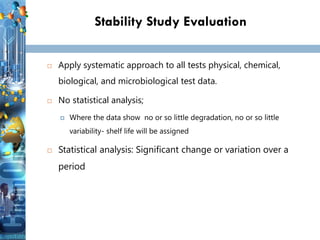
Stability Study Evaluation
Apply systematic approach to all tests physical, chemical,
biological, and microbiological test data.
No statistical analysis;
Where the data show no or so little degradation, no or so little
variability- shelf life will be assigned
Statistical analysis: Significant change or variation over a
period
18.
18
18
18
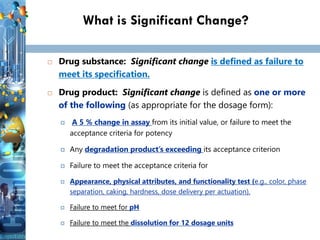
What is SignificantChange?
Drug substance: Significant change is defined as failure to
meet its specification.
Drug product: Significant change is defined as one or more
of the following (as appropriate for the dosage form):
A 5 % change in assay from its initial value, or failure to meet the
acceptance criteria for potency
Any degradation product’s exceeding its acceptance criterion
Failure to meet the acceptance criteria for
Appearance, physical attributes, and functionality test (e.g., color, phase
separation, caking, hardness, dose delivery per actuation).
Failure to meet for pH
Failure to meet the dissolution for 12 dosage units
19.
19
19
19
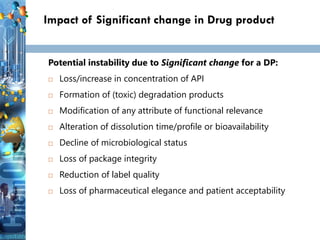
Impact of Significantchange in Drug product
Potential instability due to Significant change for a DP:
Loss/increase in concentration of API
Formation of (toxic) degradation products
Modification of any attribute of functional relevance
Alteration of dissolution time/profile or bioavailability
Decline of microbiological status
Loss of package integrity
Reduction of label quality
Loss of pharmaceutical elegance and patient acceptability
20.
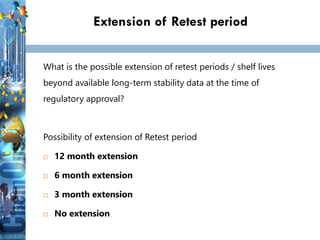
Extension of Retestperiod
What is the possible extension of retest periods / shelf lives
beyond available long-term stability data at the time of
regulatory approval?
Possibility of extension of Retest period
12 month extension
6 month extension
3 month extension
No extension
21.
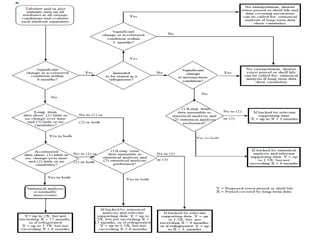
Decision Tree forData Evaluation
Appendix A: Decision tree for data evaluation
What is the possible extension of retest
periods / shelf lives beyond available long-
term stability data at the time of regulatory
approval?
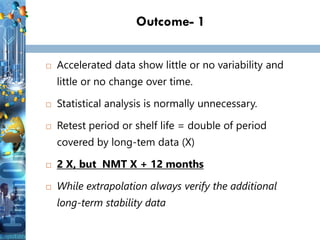
Outcome- 1
Accelerateddata show little or no variability and
little or no change over time.
Statistical analysis is normally unnecessary.
Retest period or shelf life = double of period
covered by long-tem data (X)
2 X, but NMT X + 12 months
While extrapolation always verify the additional
long-term stability data
24.
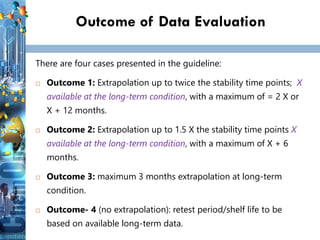
Outcome of DataEvaluation
There are four cases presented in the guideline:
Outcome 1: Extrapolation up to twice the stability time points; X
available at the long-term condition, with a maximum of = 2 X or
X + 12 months.
Outcome 2: Extrapolation up to 1.5 X the stability time points X
available at the long-term condition, with a maximum of X + 6
months.
Outcome 3: maximum 3 months extrapolation at long-term
condition.
Outcome- 4 (no extrapolation): retest period/shelf life to be
based on available long-term data.
25.
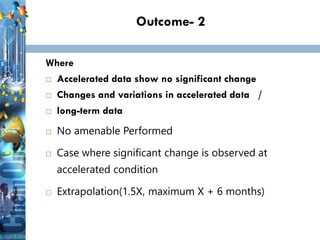
Outcome- 2
Where
Accelerateddata show no significant change
Changes and variations in accelerated data /
long-term data
No amenable Performed
Case where significant change is observed at
accelerated condition
Extrapolation(1.5X, maximum X + 6 months)
26.
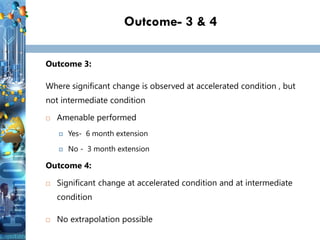
Outcome- 3 &4
Outcome 3:
Where significant change is observed at accelerated condition , but
not intermediate condition
Amenable performed
Yes- 6 month extension
No - 3 month extension
Outcome 4:
Significant change at accelerated condition and at intermediate
condition
No extrapolation possible
27.
27
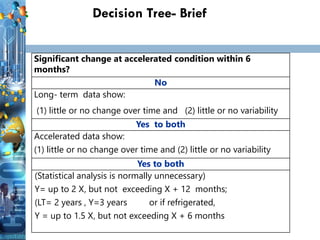
Decision Tree- Brief
27
Significantchange at accelerated condition within 6
months?
No
Long- term data show:
(1) little or no change over time and (2) little or no variability
Yes to both
Accelerated data show:
(1) little or no change over time and (2) little or no variability
Yes to both
(Statistical analysis is normally unnecessary)
Y= up to 2 X, but not exceeding X + 12 months;
(LT= 2 years , Y=3 years or if refrigerated,
Y = up to 1.5 X, but not exceeding X + 6 months
28.
28
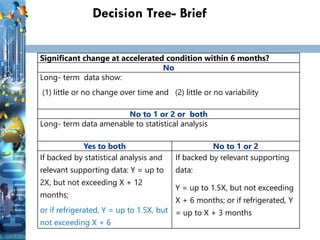
Decision Tree- Brief
28
Significantchange at accelerated condition within 6 months?
No
Long- term data show:
(1) little or no change over time and (2) little or no variability
No to 1 or 2 or both
Long- term data amenable to statistical analysis
Yes to both No to 1 or 2
If backed by statistical analysis and
relevant supporting data: Y = up to
2X, but not exceeding X + 12
months;
or if refrigerated, Y = up to 1.5X, but
not exceeding X + 6
If backed by relevant supporting
data:
Y = up to 1.5X, but not exceeding
X + 6 months; or if refrigerated, Y
= up to X + 3 months
29.
29
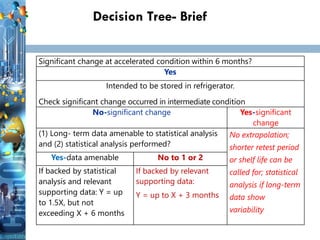
Decision Tree- Brief
29
Significantchange at accelerated condition within 6 months?
Yes
Intended to be stored in refrigerator.
Check significant change occurred in intermediate condition
No-significant change Yes-significant
change
(1) Long- term data amenable to statistical analysis
and (2) statistical analysis performed?
No extrapolation;
shorter retest period
or shelf life can be
called for; statistical
analysis if long-term
data show
variability
Yes-data amenable No to 1 or 2
If backed by statistical
analysis and relevant
supporting data: Y = up
to 1.5X, but not
exceeding X + 6 months
If backed by relevant
supporting data:
Y = up to X + 3 months
30.
30
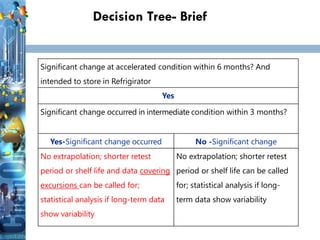
Decision Tree- Brief
30
Significantchange at accelerated condition within 6 months? And
intended to store in Refrigirator
Yes
Significant change occurred in intermediate condition within 3 months?
Yes-Significant change occurred No -Significant change
No extrapolation; shorter retest
period or shelf life and data covering
excursions can be called for;
statistical analysis if long-term data
show variability
No extrapolation; shorter retest
period or shelf life can be called
for; statistical analysis if long-
term data show variability
31.
31
31
31
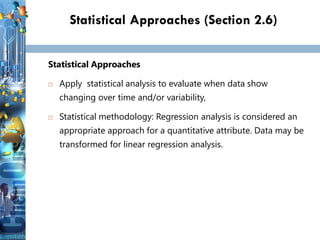
Statistical Approaches (Section2.6)
Statistical Approaches
Apply statistical analysis to evaluate when data show
changing over time and/or variability,
Statistical methodology: Regression analysis is considered an
appropriate approach for a quantitative attribute. Data may be
transformed for linear regression analysis.
32.
32
32
32
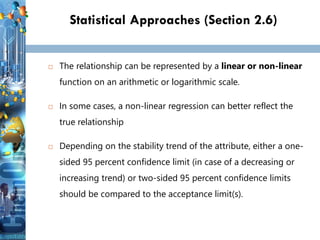
Statistical Approaches (Section2.6)
The relationship can be represented by a linear or non-linear
function on an arithmetic or logarithmic scale.
In some cases, a non-linear regression can better reflect the
true relationship
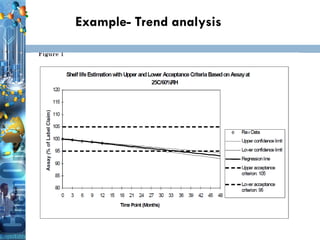
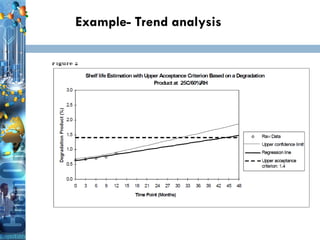
Depending on the stability trend of the attribute, either a one-
sided 95 percent confidence limit (in case of a decreasing or
increasing trend) or two-sided 95 percent confidence limits
should be compared to the acceptance limit(s).
33.
33
33
33
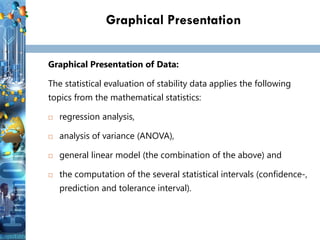
Graphical Presentation
Graphical Presentationof Data:
The statistical evaluation of stability data applies the following
topics from the mathematical statistics:
regression analysis,
analysis of variance (ANOVA),
general linear model (the combination of the above) and
the computation of the several statistical intervals (confidence-,
prediction and tolerance interval).
34.
34
34
34
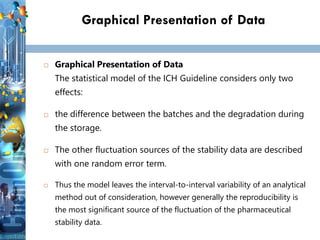
Graphical Presentation ofData
Graphical Presentation of Data
The statistical model of the ICH Guideline considers only two
effects:
the difference between the batches and the degradation during
the storage.
The other fluctuation sources of the stability data are described
with one random error term.
Thus the model leaves the interval-to-interval variability of an analytical
method out of consideration, however generally the reproducibility is
the most significant source of the fluctuation of the pharmaceutical
stability data.