Download as PDF, PPTX


![Using data to prioritise locations
Value Score Value Score Value Score Value Score Value Score Value Score Value Score Value Score
Scheme58 99,733 3 14 2 0.833 3 54,802 2 2.5 29,288 3 0.604 3 1.5 8 3 38 2 1.25 5.25 1
Scheme71 63,769 3 28 3 0 1 30,234 2 2.25 49,370 3 0.609 3 1.5 4 2 54 3 1.25 5 2
Scheme51 66,085 3 20 3 0 1 55,453 3 2.5 25,161 3 0.528 2 1.25 3 1 43 3 1 4.75 3
Scheme60 91,508 3 18 3 0.704 3 54,802 2 2.75 21,598 2 0.613 3 1.25 1 1 40 2 0.75 4.75 3
Scheme1 63,776 3 19 3 0 1 39,178 2 2.25 16,812 2 0.671 3 1.25 2 1 59 3 1 4.5 5
Scheme2 48,945 3 15 2 0 1 20,499 2 2 12,322 2 0.618 3 1.25 7 2 54 3 1.25 4.5 5
Scheme8 42,584 3 14 2 0.004 2 54,802 2 2.25 16,972 2 0.709 3 1.25 10 3 7 1 1 4.5 5
Scheme26 28,029 2 25 3 0.004 2 17,758 1 2 13,756 2 0.675 3 1.25 7 2 42 3 1.25 4.5 5
Scheme49 71,977 3 24 3 0 1 39,178 2 2.25 18,491 2 0.678 3 1.25 6 2 28 2 1 4.5 5
Scheme52 70,495 3 25 3 0 1 55,453 3 2.5 30,744 3 0.505 1 1 3 1 47 3 1 4.5 5
Scheme68 52,914 3 19 3 0 1 20,499 2 2.25 14,168 2 0.611 3 1.25 3 1 58 3 1 4.5 5
Scheme3 77,328 3 23 3 0 1 18,194 2 2.25 18,787 2 0.682 3 1.25 7 2 19 1 0.75 4.25 12
Scheme9 55,717 3 21 3 0 1 7,016 1 2 19,541 2 0.633 3 1.25 8 3 15 1 1 4.25 12
Scheme15 23,655 2 25 3 0 1 20,912 2 2 15,799 2 0.493 1 0.75 11 3 62 3 1.5 4.25 12
Scheme27 42,378 3 13 2 0 1 20,499 2 2 10,593 2 0.621 3 1.25 11 3 9 1 1 4.25 12
Scheme61 32,081 2 2 1 0.013 2 20,006 2 1.75 11,887 2 0.634 3 1.25 7 2 48 3 1.25 4.25 12
Scheme5 52,197 3 10 2 0 1 17,891 1 1.75 14,786 2 0.559 2 1 9 3 34 2 1.25 4 17
Scheme Name
TOTAL
SCORE
TOTAL
SCORE
TOTAL
SCORE
RANK
ORDER
Fatal and
serious
accidents
Slight
accidents
Traffic flows
within 100m
ALL
SCORES
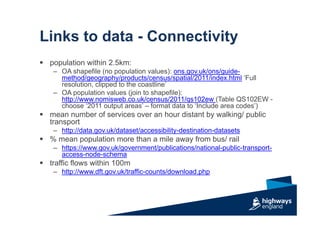
Population
within 2.5km
% Population
within
deprived SOA
% Mean
population
more than a
mile away
from Bus/Rail
Mean no. of
services over
an hour distant
by walking/PT
Jobs within
2.5km [BRES
DATA]
Connectivity Economy Safety](https://image.slidesharecdn.com/esriuktrack3-brucemcdaniel-highwaysengland-150529085124-lva1-app6891/85/Esriuk_track3_bruce-mc-daniel-highways-england-9-320.jpg)
![Links to data - Safety
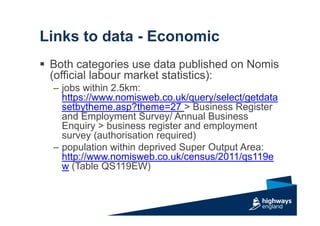
Validated Stats 19 road safety data:
http://data.gov.uk/dataset/road-accidents-
safety-data - tables:
– Road Safety – Accidents [year];
– Road Safety – Casualties [year];
– Road Safety – Vehicles [year]
– Road Accidents and Safety Data Guide](https://image.slidesharecdn.com/esriuktrack3-brucemcdaniel-highwaysengland-150529085124-lva1-app6891/85/Esriuk_track3_bruce-mc-daniel-highways-england-15-320.jpg)


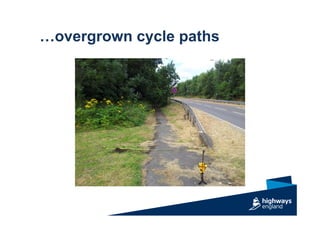
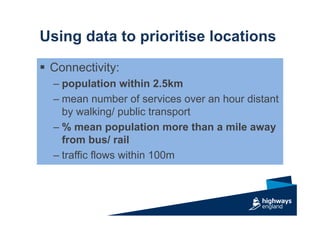
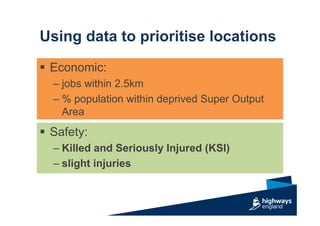
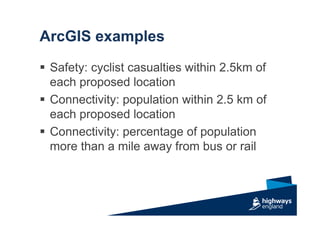
The document discusses Highways England's methods for prioritizing locations for improved cycling facilities on the Strategic Road Network. ArcGIS was used to analyze connectivity, economic, and safety data to score and rank potential scheme locations. This included analyzing population within 2.5km, deprivation levels, distance from public transport, accident rates, and traffic levels. The prioritization process has led to £100 million being allocated over 5 years to implement 200 new cycling facilities and crossings to help cyclists.
![[Urban transportation policy program]city paper presentation jakarta](https://cdn.slidesharecdn.com/ss_thumbnails/urbantransportationpolicyprogramcitypaperpresentationjakarta-160407030049-thumbnail.jpg?width=640&height=640&fit=bounds)
![[English]sae convergence2010 final2](https://cdn.slidesharecdn.com/ss_thumbnails/englishsaeconvergence2010final2-111123080928-phpapp02-thumbnail.jpg?width=640&height=640&fit=bounds)
![[English]sae convergence2010 final2](https://cdn.slidesharecdn.com/ss_thumbnails/englishsaeconvergence2010final2-111123074301-phpapp02-thumbnail.jpg?width=640&height=640&fit=bounds)
![[Urban transportation policy program] action plan jakarta](https://cdn.slidesharecdn.com/ss_thumbnails/urbantransportationpolicyprogramactionplanjakarta-160407023241-thumbnail.jpg?width=640&height=640&fit=bounds)


![Performance Appraisal ppt [hrm]](https://cdn.slidesharecdn.com/ss_thumbnails/newpptofpaautosavedcopyyyyyyyyy-100322114216-phpapp02-thumbnail.jpg?width=640&height=640&fit=bounds)


