Download to read offline

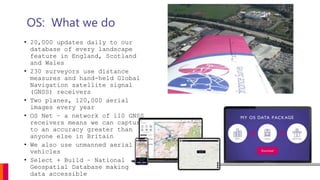
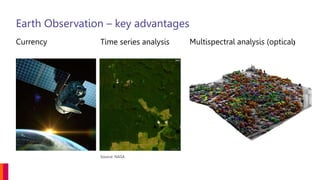
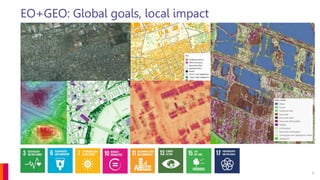
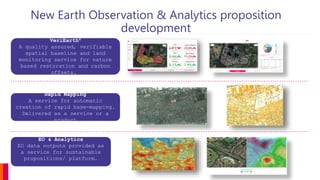


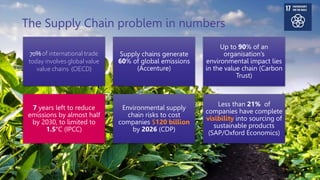


The document discusses Ordnance Survey's use of geospatial information to address sustainability challenges in the UK, particularly focusing on environmental monitoring and the supply chain's impact on emissions. It highlights their technological capabilities, such as GNSS receivers and aerial imagery, as well as partnerships aimed at improving detection of issues like sewage releases and enhancing corporate accountability. The conclusion emphasizes the need for location-based insights to drive climate action and foster sustainable practices.


