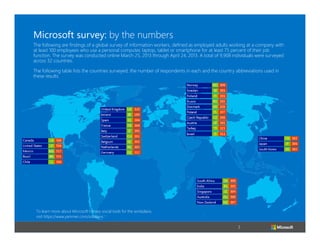
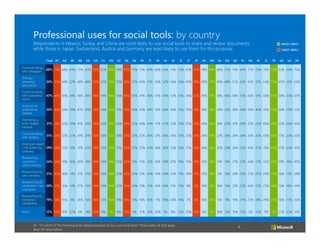
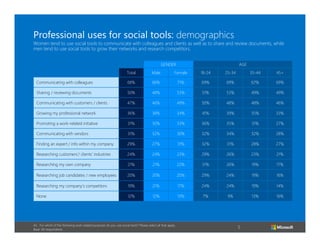
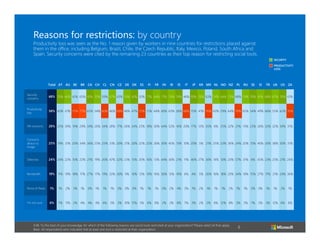
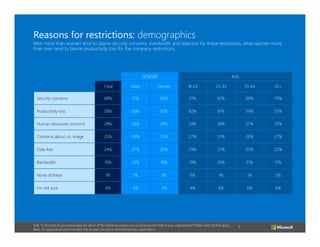
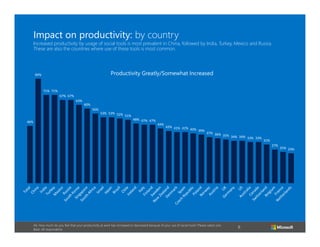
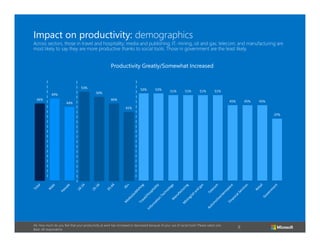
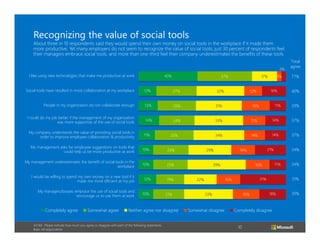
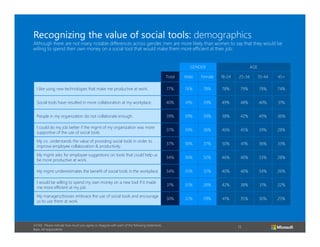
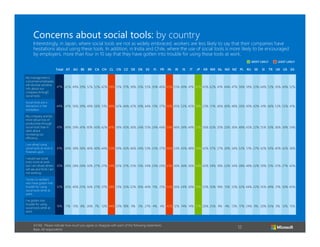
Microsoft conducted a global survey of nearly 10,000 information workers across 32 countries to understand enterprise social tool use. The survey found:
- Communicating with colleagues was the most common use of social tools across countries, while sharing/reviewing documents was also popular.
- Productivity loss was cited as the top reason for social tool restrictions in many countries, while security concerns were most commonly cited overall.
- Increased productivity from social tool use was reported most in China, India, Turkey, Mexico and Russia - countries where use is also most common.
- While many see benefits, over a third feel their company underestimates social tools' value, and only 30% feel managers embrace social tools.
2. The ways in which people connect and the speed with which they
communicate is faster than ever before. Social communication is
nothing new on the personal level, with the sharing of news, images
and status updates. It’s how people keep up with each other’s lives.
On the enterprise level, businesses have to be agile to keep up with
the competition. And since communicating and sharing information
with people is fundamental to the success of any business, many
enterprises are taking measures to employ tools that can provide
that extra edge.
Microsoft wanted to find out more about the uses — or lack of use
— of social tools in business. What social tools were most common,
what tools were restricted and how far would people go to get their
hands on those tools?
These are just a few of the questions Microsoft asked in a major
global survey — and the results from nearly 10,000 respondents may
surprise you.
2
3. Microsoft survey: by the numbers
The following are findings of a global survey of information workers, defined as employed adults working at a company with
at least 100 employees who use a personal computer, laptop, tablet or smartphone for at least 75 percent of their job
function. The survey was conducted online March 25, 2013 through April 24, 2013. A total of 9,908 individuals were surveyed
across 32 countries.
The following table lists the countries surveyed, the number of respondents in each and the country abbreviations used in
these results.
To learn more about Microsoft’s many social tools for the workplace,
visit https://www.yammer.com/solutions
3
4. Professional uses for social tools: by country
Respondents in Mexico, Turkey and China are most likely to use social tools to share and review documents,
while those in Japan, Switzerland, Austria and Germany are least likely to use them for this purpose.
Total AT
AU
BE
BR
CA
CH
CL
CN
CZ
DE
DK
ES
FI
FR
IN
IR
IS
IT
JP
KR
MX
NL
NO
NZ
PL
RU
MOST LIKELY
LEAST LIKELY
SE
SI
TR
UK
US
ZA
Communicating
with colleagues
68% 71% 64% 63% 75% 67% 56% 62% 84% 78% 63% 75% 51% 69% 60% 64% 71% 72% 65% 57% 74% 80% 68% 72% 74% 64% 77% 73% 71% 79% 61% 59% 75%
Sharing /
reviewing
documents
50% 35% 44% 52% 48% 48% 35% 47% 70% 50% 36% 52% 62% 51% 56% 52% 54% 43% 45% 28% 59% 77% 40% 48% 55% 42% 61% 51% 54% 75% 45% 41% 63%
Communicating
with customers/
clients
47% 48% 40% 39% 56% 38% 39% 49% 74% 56% 43% 53% 41% 48% 31% 47% 52% 51% 34% 32% 33% 70% 39% 46% 58% 51% 56% 51% 50% 59% 38% 35% 67%
Growing my
professional
network
36% 26% 34% 29% 47% 29% 25% 40% 43% 31% 18% 56% 30% 39% 19% 60% 36% 41% 25% 18% 16% 43% 29% 35% 39% 45% 50% 40% 41% 50% 26% 29% 51%
Promoting a
work-related
initiative
31% 18% 32% 20% 41% 26% 20% 42% 61% 26% 19% 25% 28% 24% 17% 47% 35% 37% 25% 23% 34% 52% 18% 20% 41% 28% 32% 23% 43% 48% 23% 24% 50%
Communicating
with vendors
31% 25% 22% 22% 41% 20% 25% 36% 51% 39% 24% 32% 25% 26% 21% 46% 24% 35% 23% 14% 28% 57% 22% 30% 26% 34% 41% 35% 43% 45% 17% 20% 43%
Finding an expert
/ info within my 29% 28% 25% 19% 31% 25% 18% 35% 50% 31% 25% 32% 23% 34% 18% 36% 33% 30% 17% 14% 36% 35% 20% 24% 39% 25% 30% 37% 31% 43% 27% 20% 41%
company
Researching
customers’/
clients’ industry
24% 28% 19% 16% 30% 19% 19% 29% 39% 23% 22% 21% 13% 21% 16% 39% 27% 10% 13% 14% 15% 39% 13% 16% 27% 23% 34% 17% 32% 41% 19% 16% 47%
Researching my
own company
21% 20% 16% 14% 31% 17% 13% 33% 38% 22% 22% 25% 12% 20% 14% 39% 23% 11% 30% 11% 23% 28% 5% 16% 20% 25% 27% 25% 24% 25% 16% 13% 29%
Researching job
candidates / new 20% 17% 15% 14% 27% 13% 14% 30% 33% 22% 15% 20% 12% 13% 10% 43% 17% 13% 9%
employees
3% 13% 36% 18% 12% 21% 22% 32% 15% 27% 40% 13% 16% 34%
Researching my
company’s
competitors
19% 18% 15% 9% 26% 13% 14% 23% 35% 18% 18% 15% 16% 16% 11% 39% 24% 14% 7%
6% 16% 34% 5%
None
12% 14% 16% 22% 6% 19% 20% 8%
1%
8% 20% 9% 15% 14% 20% 3%
8% 12% 20% 19% 5%
A5. For which of the following work related purposes do you use social tools? Please select all that apply.
Base: All respondents
9% 19% 27% 22% 18% 29% 41% 16% 13% 35%
1% 18% 13% 10% 15% 5% 12% 7%
4
2% 21% 23% 6%
5. Professional uses for social tools: demographics
Women tend to use social tools to communicate with colleagues and clients as well as to share and review documents, while
men tend to use social tools to grow their networks and research competitors.
GENDER
AGE
Total
Male
Female
18-24
25-34
35-44
45+
Communicating with colleagues
68%
66%
71%
69%
69%
67%
69%
Sharing / reviewing documents
50%
48%
53%
51%
53%
49%
49%
Communicating with customers / clients
47%
46%
49%
50%
48%
48%
46%
Growing my professional network
36%
38%
34%
41%
39%
35%
33%
Promoting a work-related initiative
31%
30%
33%
36%
35%
31%
27%
Communicating with vendors
31%
32%
30%
32%
34%
32%
28%
Finding an expert / info within my company
29%
27%
31%
32%
31%
28%
27%
Researching customers’/ clients’ industries
24%
24%
23%
29%
26%
23%
21%
Researching my own company
21%
21%
22%
31%
26%
19%
17%
Researching job candidates / new employees
20%
20%
20%
29%
24%
19%
16%
Researching my company’s competitors
19%
21%
17%
24%
24%
19%
14%
None
12%
12%
13%
7%
9%
13%
16%
A5. For which of the following work related purposes do you use social tools? Please select all that apply.
Base: All respondents
5
6. Reasons for restrictions: by country
Productivity loss was seen as the No. 1 reason given by workers in nine countries for restrictions placed against
them in the office, including Belgium, Brazil, Chile, the Czech Republic, Italy, Mexico, Poland, South Africa and
Spain. Security concerns were cited by the remaining 23 countries as their top reason for restricting social tools.
SECURITY
PRODUCTIVITY
LOSS
Total AT AU
BE
BR
CA CH
CL
CN CZ
DE DK
ES
FI
FR
IN
IR
IS
IT
JP
KR MX NL NO NZ
PL
RU
SE
SI
TR
UK
US
ZA
Security
concerns
68% 70% 66% 61% 65% 81% 70% 59% 67% 63% 74% 61% 50% 71% 64% 71% 74% 74% 46% 81% 76% 63% 74% 64% 73% 68% 74% 70% 81% 68% 67% 76% 61%
Productivity
loss
58% 60% 61% 72% 77% 65% 54% 60% 46% 69% 48% 47% 73% 51% 64% 60% 63% 36% 68% 15% 41% 76% 43% 29% 64% 78% 65% 34% 49% 66% 55% 62% 76%
HR concerns
28% 25% 39% 19% 29% 34% 26% 34% 28% 17% 26% 34% 25% 18% 30% 44% 52% 16% 20% 17% 12% 35% 8% 35% 32% 21% 13% 23% 36% 33% 32% 39% 31%
Concerns
about co.
image
25% 19% 31% 20% 34% 36% 23% 25% 31% 20% 21% 20% 22% 25% 26% 30% 45% 13% 10% 20% 5% 21% 25% 23% 36% 24% 20% 15% 40% 20% 38% 30% 31%
Data loss
24% 24% 22% 10% 22% 21% 19% 26% 47% 32% 23% 15% 20% 16% 13% 44% 30% 21% 11% 46% 27% 30% 14% 10% 20% 57% 31% 8% 45% 23% 25% 21% 24%
Bandwidth
19% 11% 19% 18% 17% 27% 17% 19% 33% 26% 9% 10% 13% 10% 16% 36% 13% 16% 6% 4% 5% 26% 16% 18% 20% 34% 19% 15% 27% 17% 21% 24% 36%
None of these
1%
1%
I'm not sure
6%
7% 11% 2% 4% 4% 4% 6% 3% 3% 10% 15% 5% 6% 8% 2% 2% 8% 7% 3% 2% 2% 8% 12% 8% 3% 3% 7% 5% 3% 12% 6% 6%
2% 3%
1%
0%
1%
1%
1%
0% 0% 0%
1%
1%
1%
0% 2% 4% 3%
1%
2%
1%
1%
1%
2%
A3B. To the best of your knowledge, for which of the following reasons are social tools restricted at your organization? Please select all that apply.
Base: All respondents who indicated that at least one tool is restricted at their organization
1%
6
1%
3% 0%
1%
1%
2%
1%
7. Reasons for restrictions: demographics
Men more than women tend to blame security concerns, bandwidth and data loss for these restrictions, while women more
than men tend to blame productivity loss for the company restrictions.
GENDER
AGE
Total
Male
Female
18-24
25-34
35-44
45+
Security concerns
68%
71%
65%
51%
62%
69%
75%
Productivity loss
58%
56%
61%
62%
61%
59%
55%
Human resources concerns
28%
28%
28%
29%
28%
27%
29%
Concerns about co. image
25%
26%
25%
27%
23%
26%
27%
Data loss
24%
27%
22%
29%
27%
25%
22%
Bandwidth
19%
22%
16%
19%
20%
21%
17%
None of these
1%
1%
1%
0%
1%
1%
2%
I'm not sure
6%
4%
7%
4%
6%
6%
6%
A3B. To the best of your knowledge, for which of the following reasons are social tools restricted at your organization? Please select all that apply.
Base: All respondents who indicated that at least one tool is restricted at their organization
7
8. Impact on productivity: by country
Increased productivity by usage of social tools is most prevalent in China, followed by India, Turkey, Mexico and Russia.
These are also the countries where use of these tools is most common.
Productivity Greatly/Somewhat Increased
84%
71% 71%
67% 67%
63%
60%
56%
53% 53% 52%
51%
46%
48% 47% 47%
44%
42% 41% 41%
40% 39%
37% 36%
35% 34% 34%
33% 33%
31%
27%
25% 24%
A6. How much do you feel that your productivity at work has increased or decreased because of your use of social tools? Please select one..
Base: All respondents
8
9. Impact on productivity: demographics
Across sectors, those in travel and hospitality; media and publishing; IT; mining, oil and gas; telecom; and manufacturing are
most likely to say they are more productive thanks to social tools. Those in government are the least likely.
Productivity Greatly/Somewhat Increased
53%
52%
50%
49%
46%
52%
51%
51%
51%
51%
46%
45%
44%
45%
45%
41%
37%
A6. How much do you feel that your productivity at work has increased or decreased because of your use of social tools? Please select one..
Base: All respondents
9
10. Recognizing the value of social tools
About three in 10 respondents said they would spend their own money on social tools in the workplace if it made them
more productive. Yet many employers do not seem to recognize the value of social tools; just 30 percent of respondents feel
their managers embrace social tools, and more than one-third feel their company underestimates the benefits of these tools.
3%
I like using new technologies that make me productive at work
40%
37%
17%
3%
Total
agree
77%
Social tools have resulted in more collaboration at my workplace
12%
27%
People in my organization do not collaborate enough
13%
26%
31%
I could do my job better if the management of my organization
was more supportive of the use of social tools
14%
24%
33%
15%
14%
37%
34%
14%
14%
37%
My company understands the value of providing social tools in
order to improve employee collaboration & productivity
11%
My management asks for employee suggestions on tools that
could help us be more productive at work
10%
24%
My management underestimates the benefit of social tools in the
workplace
10%
32%
23%
I would be willing to spend my own money on a new tool if it
made me more efficient at my job
My managers/bosses embrace the use of social tools and
encourage us to use them at work
Completely agree
Somewhat agree
12%
10%
26%
19%
21%
Neither agree nor disagree
A7/A8. Please indicate how much you agree or disagree with each of the following statements.
Base: All respondents
11%
16%
33%
18%
18%
Completely disagree
10
39%
34%
31%
31%
16%
40%
34%
21%
16%
39%
Somewhat disagree
11%
19%
29%
22%
16%
12%
30%
11. Recognizing the value of social tools: demographics
Although there are not many notable differences across gender, men are more likely than women to say that they would be
willing to spend their own money on a social tool that would make them more efficient at their job.
GENDER
AGE
Total
Male
Female
18-24
25-34
35-44
45+
I like using new technologies that make me productive at work.
77%
76%
78%
78%
79%
78%
74%
Social tools have resulted in more collaboration at my workplace.
40%
41%
39%
49%
48%
40%
31%
People in my organization do not collaborate enough.
39%
39%
39%
38%
42%
40%
36%
I could do my job better if the mgmt of my organization was more
supportive of the use of social tools.
37%
39%
36%
46%
45%
39%
28%
My co. understands the value of providing social tools in order to
improve employee collaboration & productivity.
37%
38%
37%
50%
41%
36%
33%
My mgmt asks for employee suggestions on tools that could help us
be more productive at work.
34%
36%
32%
46%
40%
33%
28%
My mgmt underestimates the benefit of social tools in the workplace.
34%
35%
32%
40%
40%
34%
26%
I would be willing to spend my own money on a new tool if it made
me more efficient at my job.
31%
35%
26%
42%
38%
31%
22%
My managers/bosses embrace the use of social tools and encourage
us to use them at work.
30%
32%
29%
41%
35%
30%
25%
A7/A8. Please indicate how much you agree or disagree with each of the following statements.
Base: All respondents
11
12. Concerns about social tools: by country
Interestingly, in Japan, where social tools are not as widely embraced, workers are less likely to say that their companies have
hesitations about using these tools. In addition, in India and Chile, where the use of social tools is more likely to be encouraged
by employers, more than four in 10 say that they have gotten into trouble for using these tools at work.
MOST LIKELY
Total AT
AU BE
BR CA CH CL CN CZ DE DK
ES
FI
FR
IN
IR
IS
IT
JP
KR MX NL NO NZ
PL
RU
SE
SI
LEAST LIKELY
TR
UK US ZA
My management is
concerned employees
will disclose sensitive
47% 42% 49% 39% 52% 52% 42% 58% 55% 37% 38% 33% 55% 30% 46% 63% 55% 49% 41% 42% 43% 62% 41% 44% 47% 36% 58% 33% 64% 53% 50% 49% 52%
info about our
company through
social tools.
Social tools are a
distraction in the
workplace.
44% 41% 56% 39% 49% 56% 51% 48% 42% 44% 45% 39% 44% 13% 37% 56% 45% 53% 45% 18% 23% 51% 46% 40% 48% 26% 49% 43% 41% 46% 53% 55% 41%
My company worries
more about loss of
productivity through
social tools than it
does about
increasing our
efficiency.
41% 49% 39% 41% 60% 43% 42% 61% 38% 43% 36% 24% 55% 24% 44% 59% 46% 39% 44% 21% 36% 62% 20% 20% 36% 48% 45% 22% 55% 50% 36% 39% 54%
I am afraid using
social tools at work is
frowned upon.
41% 44% 38% 36% 46% 40% 44% 55% 49% 43% 46% 24% 53% 23% 37% 48% 33% 45% 48% 24% 42% 57% 27% 30% 34% 52% 51% 27% 42% 50% 40% 42% 38%
I would use social
tools more at work
but I am afraid others 35% 28% 28% 26% 50% 27% 27% 54% 65% 37% 25% 15% 34% 23% 20% 61% 36% 36% 36% 24% 42% 59% 18% 22% 34% 38% 48% 22% 59% 51% 25% 27% 42%
will see and think I am
not working.
I know co-workers
who have gotten into
trouble for using
social tools while at
work.
32% 30% 40% 25% 56% 27% 27% 58% 33% 33% 22% 16% 40% 11% 21% 52% 36% 24% 30% 19% 32% 50% 18% 13% 33% 32% 44% 22% 35% 49% 31% 30% 45%
I've gotten into
trouble for using
social tools while at
work.
16%
11% 13% 8% 26% 7% 12% 44% 23% 18% 9% 5% 27% 4% 4% 42% 12% 14% 14% 17% 26% 25% 4% 4% 13% 17% 24% 9% 20% 35% 9% 12% 15%
A7/A8. Please indicate how much you agree or disagree with each of the following statements.
Base: All respondents
12
13. Concerns about social tools: demographics
Across all age groups, similar proportions agree that social tools are a distraction in the workplace, despite more widespread
usage among younger adults.
GENDER
AGE
Total
Male
Female
18-24
25-34
35-44
45+
My management is concerned that employees
will disclose sensitive information about our
company through social tools.
47%
50%
44%
43%
50%
48%
45%
Social tools are a distraction in the workplace.
44%
44%
43%
44%
44%
45%
42%
My company worries more about loss of
productivity through social tools than it does
about increasing our efficiency.
41%
42%
41%
45%
48%
42%
35%
I am afraid using social tools at work is
frowned upon.
41%
40%
42%
45%
46%
41%
36%
I would use social tools more at work but I am
afraid others will see and think I am not working.
35%
34%
37%
52%
44%
36%
25%
I know co-workers who have gotten into trouble
for using social tools while at work.
32%
32%
33%
40%
38%
31%
27%
I've gotten into trouble for using social tools
while at work.
16%
18%
15%
27%
22%
15%
10%
A7/A8. Please indicate how much you agree or disagree with each of the following statements.
Base: All respondents
13
14. Learning about and adopting social tools
While a majority of respondents rely on their IT departments to show them new technologies that would make their job
easier, nearly as many say they count on their colleagues to do so.
I rely on my organization’s IT department to show me new
technologies that make my job easier
20%
I rely on my colleagues to show me new technologies that
make our jobs easier
14%
I rely more on my colleagues than on our IT department to
show me ways to be more productive at my job
33%
13%
I started using social tools for my job because my co-workers
were using them
Completely agree
Somewhat agree
9%
30%
22%
13%
28%
28%
Neither agree nor disagree
A7/A8. Please indicate how much you agree or disagree with each of the following statements.
Base: All respondents
24%
15%
33%
28%
11%
14%
15%
18%
Somewhat disagree
11%
24%
Completely disagree
14
15. Access to social tools
Though about six out of 10 respondents say that they have full access to the technology and tools they need to do the best
job they can, 40 percent indicate that their IT departments can be a barrier to their access.
Total
agree
I have full access to the technology and tools to do my job to
the best of my abilities
I would like to be more involved in the decisions to add new
technologies and tools at my workplace
I have to convince my organization’s IT department to allow
me to use tools that make me more efficient at my job
I know co-workers who have ignored our organization’s IT
policy and installed social tools on their work
computers/work phones
I’ve ignored my organization’s IT policy and installed social
tools on my work computer/work phone
Completely agree
Somewhat agree
25%
14%
19%
11%
20%
Neither agree nor disagree
A7/A8. Please indicate how much you agree or disagree with each of the following statements.
Base: All respondents
22%
13%
15%
34%
25%
11%
11%
33%
20%
9%
5%
23%
12%
18%
17%
32%
15%
47%
16%
Somewhat disagree
6%
11%
29%
21%
21%
11%
21%
31%
18%
I’ve tried to download an application (app) onto my work
computer or work phone for my job, but couldn’t because I
didn’t have administrative control/authorization
My organization’s IT department can be a barrier to using
social tools
35%
27%
Completely disagree
15
62%
49%
42%
40%
31%
28%
17%