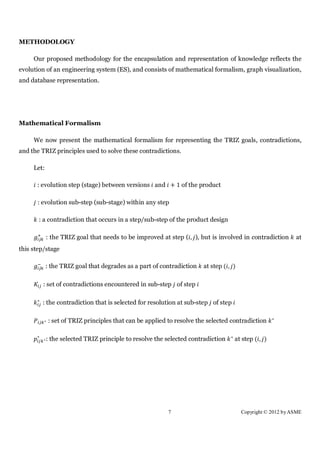
1) The document describes a methodology for encapsulating and representing knowledge about the evolution of an engineering system. It involves mathematical formalism to represent design steps, contradictions, goals and TRIZ principles.
2) A graph visualization is proposed to represent the design process, with nodes as possible TRIZ principles and colored nodes indicating principles selected at each step.
3) A database structure is outlined to store information on contradictions, principles, design steps and which principles were selected, along with explanations. This knowledge representation aims to guide design of similar products.
![ABSTRACT
This paper proposes a cross-disciplinary methodology for a fundamental question in
product development: How can the innovation patterns during the evolution of an
engineering system (ES) be encapsulated, so that it can later be mined through data
analysis methods? Reverse engineering answers the question of which components a
developed engineering system consists of, and how the components interact to make
the working product. TRIZ answers the question of which problem-solving principles
can be, or have been employed in developing that system, in comparison to its earlier
versions, or with respect to similar systems. While these two methodologies have been
very popular, to the best of our knowledge, there does not yet exist a methodology that
reverse-engineers, encapsulates and represents the information regarding the
application of TRIZ through the complete product development process. This paper
suggests such a methodology that consists of mathematical formalism, graph
visualization, and database representation. The proposed approach is demonstrated by
analyzing the design and development process for a prototype wrist-rehabilitation
robot and representing the process as a graph that consists of TRIZ principles.
INTRODUCTION
TRIZ is a methodology for inventive problem solving, and has been used extensively in product
design. TRIZ was formally introduced byAltschuller in 1940s, based onobservations of more than
200,000 patents [1]. Altschullerrecognized that a vast majority of patents involved incremental
improvements on earlier inventions, rather than presenting radical novelties [2]. Furthermore, these
improvements were based majorly on a given set of general principles to solve the contradictions
among a set of conflicting features. Altschuller identified 39 such features and 40 such principles,
which are listed and described in Appendices A&Bof the supplement to this paper [3]. TRIZ theory is
based on three primary postulates [4]:
2 Copyright © 2012 by ASME](https://image.slidesharecdn.com/erteketaltriz24volkan02final-121125055342-phpapp02/85/Encapsulating-And-Representing-The-Knowledge-On-The-Evolution-Of-An-Engineering-System-2-320.jpg)
![1)There exist objective laws that drive the evolution of engineering systems,
2) The evolution of an engineering system is a sequence of contradictions and their resolutions
(Laws of Engineering Systems Evolution, LESE),
3)The peculiarities of a given situation should be taken into consideration during the problem-
solving process.
The focus of this paper is the encapsulation of the knowledge pertaining to LESE, the second
postulate of TRIZ. The milestones of the design process can be recorded in terms of the TRIZ
principles applied during the process itself, or can be reverse-engineered at the end of the process.
The goal is to guide the design process better in similar future projects, based on the path followed in
earlier projects, and based on insights obtained from the analysis of process visualizations. Another
important application of the proposed methodology is the analysis of evolution patterns of a
particular family of finished products in the market through patent analysis [5]. To the best of our
knowledge, there does not exist a formal framework that enables the encapsulation of this evolution
pattern data.
The research question in this paper is the following: How can the innovation patterns during
the evolution of an engineering system (ES) be encapsulated, so that it can later be mined through
data mining methods?
The effective capturing of design process knowledge can help greatly in understanding the
design rationale, which is the explanation of why a product, or some part of a product, is designed the
way it is [6]. Furthermore, this knowledge can also contribute to future product design cycles: 90% of
industrial design activity is based on variant design [7]. During a redesign activity up to 70% of the
information is taken from previous solutions [8]. Hence, effectively capturing and reusing product
design knowledge can enhance or impede greatly the achievement of a robust knowledge
management system for product development [9]. The paper contributes to the literature primarily by
proposing a knowledge encapsulation and representation method that includes mathematical
formalism, graph visualization, and database representation. The information gathering can be
during or after the design process. Furthermore, the developed knowledge representation
methodology is demonstrated using a case study of a wrist rehabilitation robot. This is an important
domain of application, due to the increasing importance of rehabilitation robots in the health sector,
and due to the increasing costs in the health sector. In the case study application, the TRIZ
contradictions and principles encountered during a wrist rehabilitation robot design are revealed,
3 Copyright © 2012 by ASME](https://image.slidesharecdn.com/erteketaltriz24volkan02final-121125055342-phpapp02/85/Encapsulating-And-Representing-The-Knowledge-On-The-Evolution-Of-An-Engineering-System-3-320.jpg)
![serving as a reference for the design of similar robots.
LITERATURE
Rehabilitation Robotics
Physical rehabilitation involves exercising and manipulating the body to improve joint and
muscle function [10], and has traditionally been performed by human therapists, who help and direct
patients with repetitive physical movements.
The costs of health care services are at a steady increase throughout the world. For example, the
cost of medical services alone in US jumped from $961 billion in 2000 to $1,584 trillion in 2007 [11],
showing a 65% increase in those seven years. The demand for and the cost of physical therapy is
increasing as a part of the increased demand for health services. As of 2009, 1,275,000 people in the
United States were living with spinal cord injury alone, requiring physical therapy on hands, limbs
and/or other parts of the body [12]. In 2007, the $600 million share of the US health expenditures
consisted of the aggregate pay to therapists. While the health expenditures are increasing, the number
of therapists in the US stayed the same from 2006 to 2007, and the yearly wage of a therapist has
increased by nearly $8000 [13]. Physical therapists are the second highest paid among all human
therapists, following radiation therapists [14].
Rehabilitation robots can be extremely useful in the treatment of rehabilitation patients
(Appendix C in the supplement [3]), and hence the design of the robots is significant for the
treatment. Critical design criteria for rehabilitation robot design are safety and ergonomy. The
designed device should enable safe and versatile training while patients are attached to the robot, and
the robot should be compatible with the natural movements of the user. Further constraints on design
include light and compact mechanism with a simple user interface and possible artificial intelligence
capabilities [15]. Design requirements for rehabilitation robots can be collected through interviews
and surveys, and the appropriate analysis of such feedback can provide major insights for the design
process [16]. Technical and nontechnical limitations of available robot systems pertain to the inability
of robots to sense, complete safety of the patients, user centered design, and cost and usability [17].
In the literature, several robotic devices have been developed to target wrist rehabilitation
exercises, and these are reviewed in Appendix D of the supplement [3].
4 Copyright © 2012 by ASME](https://image.slidesharecdn.com/erteketaltriz24volkan02final-121125055342-phpapp02/85/Encapsulating-And-Representing-The-Knowledge-On-The-Evolution-Of-An-Engineering-System-4-320.jpg)
![TRIZ
TRIZ technique is a systematic problem solving methodology invented by Russian scientist
GenrichAltshuller, to bring creative solutions to challenging design problems [2]. The acronym TRIZ
stands for “Theory of Inventive Problems Solving” in Russian.
Before the invention of the TRIZ, Altshuller worked on over 200,000 patents with the feature of
revealing general patterns of invention/innovation [1]. His research resulted in three fundamental
findings:
1) Problems and solutions are not unique for industries and sciences.
2)Technical developments are repeated in industries and sciences.
3) Innovations are used outside of the original domain for which they were developed.
Thanks to these findings, Altschuller identified 39 design features, which may contradict with
each other at different steps of the design process, and 40 principles of problem solving that can be
applied to resolve these contradictions. The recipe for the appropriate set of principles that can be
applied to solve each contradiction are provided in the contradiction matrix [18].
Many successful applications of TRIZ in the real world have been reported in literature,
including the design of welding fixture [19] and trend analysis of formwork engineering technologies
in the construction industry [20]. Some of these applications particularly involve rehabilitation and
rehabilitation robots, and will be discussed next.
TRIZ for Rehabilitation
[21]designed and developed a robot for assisting eating, where they applied TRIZ. Specifically,
the segmentation principle of TRIZ is mentioned as a major step of the design process. The
researchers decoupled the robot’s feeding actions, named as self-feeding actions, into two, picking the
food and transferring the picked food to disabled person’s mouth. Therefore, two separate robotic
arms were designed on the robot for two different subsections, so the design was improved in terms of
its usefulness, benefits, convenience and conformance to manufacturing. [22]applied TRIZ to
improve aging in place, to live in one's own home as long and as comfortable as possible.
5 Copyright © 2012 by ASME](https://image.slidesharecdn.com/erteketaltriz24volkan02final-121125055342-phpapp02/85/Encapsulating-And-Representing-The-Knowledge-On-The-Evolution-Of-An-Engineering-System-5-320.jpg)
![[23]describes a rehabilitation robot that assists with disability inspired by passive walk that requires
no actuators, sensors or controllers that able to walk down slopes. Through TRIZ, the researchers
overcame a contradiction through the “inversion” TRIZ principle. [24]also applied TRIZ principles to
resolve contradictions in the design of a rehabilitation robot.
Evolution of an Engineering System
Our study builds upon an earlier idea by [25] and [26], who highlight the necessity to collect the
information during the evolution of an engineering system, within the framework of Laws of
Engineering Systems Evolution (LESE), the second postulate of TRIZ.
Systematic collection of data regarding the evolution of a design of a particular product or a
product family can enable innovative insights. For example, [27] investigates the correlation between
the step of evolution and the contradictions that characterize the behavior of an engineering system,
through a case study on tablet manufacturing technologies. The ultimate goal in [27] is to determine
the maturity stage in the lifecycle of the system.
Knowledge Representation
Knowledge representation can be defined as the application of logic and ontology to the task
ofconstruction of computable models of some domain [28]. A knowledge representation (KR) for a
domain should cover the information in the domain in depth and breadth, and should be consistent,
so as to eliminate redundant or conflicting knowledge. A KR should also be easily understandable,
efficient, and flexible. A KR formalism should ideally allow the representation of knowledge in an
explicit and declarative way, should be logically founded, should allow for structured representation
of knowledge, should have good computational properties, and should allow users to understand and
control every step of the knowledge base building process [29]. [29]presents a thorough discussion of
how knowledge can be represented through graphs, and our research also includes the representation
of knowledge in graphs.
6 Copyright © 2012 by ASME](https://image.slidesharecdn.com/erteketaltriz24volkan02final-121125055342-phpapp02/85/Encapsulating-And-Representing-The-Knowledge-On-The-Evolution-Of-An-Engineering-System-6-320.jpg)
![Graph Visualization
We suggest that the process visualizations be graph visualizations, where nodes represent the
possible contradiction-resolving TRIZ principles that can be applied in each design state, and the
evolution path represents the principles actually selected and applied. The proposed graph
visualization is very simple, and there can be other graph visualizations that can be developed in
future research, based on the mathematical formalism. [30]is one of the rare studies that introduce
visualization of data regarding the application of TRIZ. The authors introduce the concept of
“contradiction clouds” for representing a set of contradictions that are encountered at any step of the
evolution of an engineering system.
The graph visualization creates layers of nodes, where the layers represent steps and sub-steps of
the evolution. The nodes on a layer represent the set of possible TRIZ principles that can be applied to
resolve the contradiction at that (step, sub-step). The TRIZ principle selected at each (step, sub-step)
is shaded with color, and the shaded nodes in successive layers are connected with arcs.
Figure 1 illustrates the graph visualization obtained for the design process in the case study. The
methodology we propose successfully reverse-engineers the design process, and illustrates it in a
graph, which succinctly shows how TRIZ was implicitly applied throughout the design process.
This graph representation has the following benefits:
1) The reverse-engineered design process is represented visually, which provides meta-
information easily accessible.
2) The graph visualization yields immediate insights for the analyzed process; that may be
difficult to read from textual descriptions. For example, Figure 1 clearly illustrates the recurring
appearance of principles 34 and 35 in the last two steps of the process. Also, it shows that the path
followed during the process used principle 34 twice in the last two steps of the design process. This
shows the importance of TRIZ principle 34 (“rejecting and regenerating parts”) in later steps or the
product design process for this robot, and suggests that it may hold true for other similar
rehabilitation robots.
3) The design processes followed in the development of a particular product, such as the
AssistOn-wrist robot in the case study, can guide the development of similar products.
8 Copyright © 2012 by ASME](https://image.slidesharecdn.com/erteketaltriz24volkan02final-121125055342-phpapp02/85/Encapsulating-And-Representing-The-Knowledge-On-The-Evolution-Of-An-Engineering-System-8-320.jpg)
![FIGURE 1. THE VISUALIZED DESIGN PROCESS, WHERE EACH NODE REPRESENTS A TRIZ
PRINCIPLE AND THE SHADED NODES REPRESENT THE SELECTED PRINCIPLES.
TABLE 1. DATABASE STRUCTURE, CONTRADICTION TABLE
ID i j k gp gp_detail gm gm_detail is_k_selected
a 1 1 1 39 … 2 … 1
b 1 2 1 21 … 27 … 1
c 1 3 1 37 … 22 … 1
d 2 1 1 33 … 21 … 1
e 3 1 1 26 … 14 … 1
While the visualization is very simple, it does enable the convenient communication of the
design process, and the derivation of key insights regarding the process. It is highly probable that
similar products with similar design criteria will require a similar design process, even if the design
itself may vary significantly. One future research could be the simultaneous analysis of multiple
design processes, using graph-theoretic concepts, such as graph metrics for characterizing graphs
[31][32].
9 Copyright © 2012 by ASME](https://image.slidesharecdn.com/erteketaltriz24volkan02final-121125055342-phpapp02/85/Encapsulating-And-Representing-The-Knowledge-On-The-Evolution-Of-An-Engineering-System-9-320.jpg)
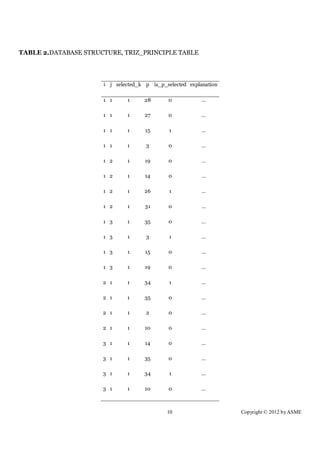
![DatabaseRepresentation
In real world engineering projects, the encapsulated design process knowledge should be stored
in a database, according to a structure, in the form of explicit information/data. We propose a
database structure that directly reflects the mathematical formalism above, and consists of two
database tables. The database tables CONTRADICTION and TRIZ_PRINCIPLE store information
regarding the contradictions and the TRIZ principles that can and have been used to solve those
contradictions. These tables, populated with the information collected during the case study, are
given in Tables 1 and 2.
In implementations, any relational database (MS Access, MySQL) can be used to encapsulate
and store the extracted design process knowledge the established tabular data structure enables the
adoption of standard data analysis/mining techniques that operate on tabular data.
CASE STUDY
AsistOn-Wrist
AssistOn-Wrist (Figure 5) [33][34] is an exoskeleton device for rehabilitation and training, and
is designed as an enhanced version of the RiceWrist[35] (Figure 2).
The mechanism is of hybrid kinematic structure and comprises of a 3RPS parallel wrist in series
with an actuated revolute (R) joint at the base platform of the wrist. It consists of five bodies: a base
platform F, three extensible links R, S, T, and a moving platform W. The end-effector held by the
operator is rigidly attached to the moving platform W. Extensible links are connected to the base
platform via revolute joints whose axes of rotation are oriented along the tangents of F, while the
moving platform is connected to the extensible links by means of spherical joints. Translation degree
of freedom of the device is used for ease of attachment and configuring the device for each patient.
Remaining three rotational degrees of freedom are to apply therapeutic exercises for forearm
supination/pronation, wrist flexion/extension and wrist radial/ulnar deviation.
All of the devices mentioned in the literature (Appendix D, [3])are implemented using serial
kinematic structures, since serial robots are advantageous while targeting for a large workspace, as
demanded by rehabilitation applications. However, with these kinds of mechanisms, it is hard to
11 Copyright © 2012 by ASME](https://image.slidesharecdn.com/erteketaltriz24volkan02final-121125055342-phpapp02/85/Encapsulating-And-Representing-The-Knowledge-On-The-Evolution-Of-An-Engineering-System-11-320.jpg)
![ensure good alignment of the robot axes with human joint axes, another imperative design
requirement for rehabilitation robots. When serial mechanisms are employed, this ergonomic
requirement necessitates use of adjustable linkages and straps, and manual adjustment of these link
lengths may result in cumbersome installation and calibration processes. To this end, parallel
mechanism based exoskeletons, such as AssistOn-Wrist, excel as feasible alternatives, since the
alignment of the rotation axes of these devices with the human joints can be ensured through
kinematic design and/or active control of such devices. Moreover, mechanisms with closed kinematic
chains result in better actuator utilization, and inherently possess compact designs with high stiffness
and low effective inertia, making it easier for them to satisfy the transparency requirement of force
feedback applications. These mechanisms are also advantageous as measurement devices as they do
not superimpose positioning errors.
AssistOn-Wrist makes use of these advantages with an exoskeleton parallel wrist structure and it
has the ability to measure the joint angles and give kinesthetic feedback to human wrist with high
precision. Through optimization, range of motion and manipulability of the device is enhanced with a
singularity-free workspace. Furthermore, dynamic performance of the device is increased in the
design step so that it is back-drivable with minimal joint frictions and backlash. Therefore, negative
effects of the dynamics are kept minimal and in result it is made possible to implement correct
rendering of the virtual environments without additional force sensor integration [36]. Thanks to
passive back-drivability, in the case of an electrical failure, patients can easily move their arms to a
safe and comfortable configuration and detach themselves from the robot, while open ring kinematic
structure along with an asymmetric joint placement enables rapid attachment/detachment.
Device has gone through several design iterations, starting with the first prototype, RiceWrist,
implemented at Rice University. Afterwards, second prototype was designed and implemented at
Sabanci University in one and a half years, where design process itself took approximately six months.
This version possesses major design upgrades with respect to the first prototype. Further design
modifications were carried out in the third version, motivated by the feedback acquired from the
therapists and it was designed and implemented in another year, where this time the design process
was carried out in four months. Fourth version has slight modifications in design while emphasis is
shifted on the controller implementations, which took approximately one year to finalize. A fifth
version is planned to be implemented in one year, which would inherit design modifications
motivated by the observed undesired characteristics at advanced controller implementations.
The imperative requirements of a rehabilitation prototype do also represent the major
bottlenecks in a robotic rehabilitation project. Any design step should be carefully elaborated so that
12 Copyright © 2012 by ASME](https://image.slidesharecdn.com/erteketaltriz24volkan02final-121125055342-phpapp02/85/Encapsulating-And-Representing-The-Knowledge-On-The-Evolution-Of-An-Engineering-System-12-320.jpg)
![TRIZ in the First Step
The first step where TRIZ was applied was the improvement of the robot from version 1 to
version 2. In the first version of the AssistOn-Wrist robot, named RiceWrist, cable-driven motors
were used for linear motion; direct drive motor was used for forearm pronation/supination; universal
bearings combined with a revolute joint were used for spherical joints; and joint space position
controller was used as the controller (Figure 2).
FIGURE 2. FIRST VERSION OF THE ASISTON-WRIST ROBOT. RICEWRIST [35]
FIGURE 3. SECOND VERSION OF THE ASISTON-WRIST ROBOT [37]
14 Copyright © 2012 by ASME](https://image.slidesharecdn.com/erteketaltriz24volkan02final-121125055342-phpapp02/85/Encapsulating-And-Representing-The-Knowledge-On-The-Evolution-Of-An-Engineering-System-14-320.jpg)
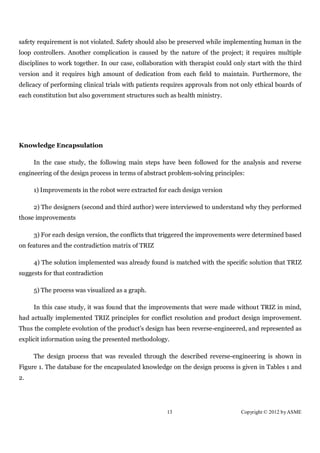
![In the second version of the AssistOn-Wrist robot, linear motors were used for linear motions
(shown with (a) in Figures 2 and 3); capstan-drive (b)was used for forearm pronation/supination;
spherical rolling joint(SRJ) (c) bearings were used instead of universal plus revolute joints. Optimal
dimension synthesis was carried out as well as the implementations of task space controller and
impedance controller with virtual reality environment (Figure 3).
Improvements that were made between versions 1 (Figure 2) and 2 (Figure 3) were the
replacement of cable-driven motor with low friction direct-drive motors, and the combination of
universal and revolute joints with spherical joints. By considering TRIZ technique, first contradiction
for using linear motor instead of cable-driven (a) was found as the following: improving efficiency
(goal 39) is desired feature without having increase in weight of a non-moving object (goal 2). The
solution of this contradiction by TRIZ is found by using the contradiction matrix [18]. Obtained
solution principles by looking at the contradiction of productivity and weight of stationary object were
principles 28, 27, 15 and 3. By analyzing these solutions and looking at the improvements in version 2,
it was discovered that principle 15, which is “Dynamics”, was applied as a solution. This modification
increased quality with higher back drivability and decreased the number of elements by replacing a
combination of 'rotational motor with capstain drive' with a single linear motor for each leg.
Therefore, this principle was selected as the solution principle for this improvement.
Second contradiction was resolved by using capstan-drive for the serial revolute joint near the
base instead of direct-drive motors (b). Improving power (goal 21) was desired without losing
reliability (goal 27), in terms of back drivability. The solution of this contradiction by TRIZ can be
found by again referring to the contradiction matrix. Obtained solution principles with power as
improving one and reliability as worsening one are principles 19, 24, 26, 31. By analyzing these
solutions and looking at the improvements in version 2, principle 26, which is “Copying”, was the
solution because it is defined as using inexpensive, more suitable objects instead of expensive object.
Capstan drive motor is less expensive compared to direct drive motor.
Third contradiction related to using SRJ bearing instead of universal and revolute joints (c).
Here, the difficulty of control complexity (goal 37) was discovered to be the improving feature and
loss of energy (goal 22) was the degrading feature. Improving control was desired without increasing
friction. The solution of this contradiction by TRIZ can be found by using contradiction matrix.
Obtained solution principles by looking at difficulty of detecting and measuring as improving feature
and loss of energy as worsening are principles 35, 3,15,19. By analyzing these solutions and looking at
the improvements in version 2, principle 3, which is “Local Quality”, was found as the solution,
because it aims to make each part of an object function in conditions most suitable for its operation.
15 Copyright © 2012 by ASME](https://image.slidesharecdn.com/erteketaltriz24volkan02final-121125055342-phpapp02/85/Encapsulating-And-Representing-The-Knowledge-On-The-Evolution-Of-An-Engineering-System-15-320.jpg)
![The contradiction in this improvement step was discovered to be the ease of attachment as
improving feature and power (goal 21) as worsening feature. Here, ease of attachment (goal 33) is a
desired feature, but without decreasing power. Obtained solution principles by referring to the
contradiction matrix for the contradiction between ease of operation and power are principles 34, 35,
2, 10. Proper solution is determined as based on principle 34, which is “Rejecting and regenerating
parts”. This principle eliminates an object if it has fulfilled its function. As a result, removing of rolling
bearings from the system and replacing them with curved slides provides much easier attachment (d).
TRIZ in the Third Step
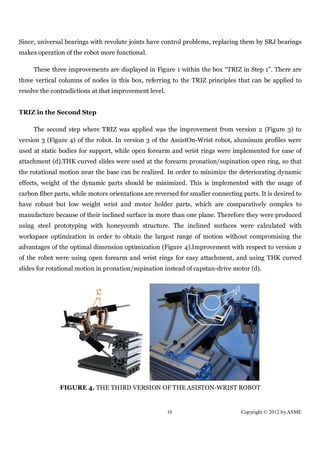
The third step where TRIZ was applied was the improvement of the robot from version 3 (Figure
4) to version 4 (Figure 5). Version 4 of the AssistOn-Wrist robot includes parts that do not contain
any carbon fiber, uses a new designed capstan ring, and implements quaternion control and PVFC
controller. The improvement in this design state is removing of carbon fiber from the system (e).
FIGURE 5. THE FOURTH VERSION OF THE ASISTON-WRIST ROBOT [36]
Therefore, the final contradiction was the amount of substance (goal 26) as improving feature
and strength (goal 14) as worsening feature, because removing carbon fiber is related to reducing
quantity of materials in the robot, whereas carbon fibers are robust materials. Possible solution
principles to resolve this conflict are principles 14, 35, 34, 10.The solution implemented here was
again principle 34, namely “Rejecting and regenerating parts”. As it was explained in previous design
improvement, principle 34 suits for the following situation, since removing carbon fibers from the
17 Copyright © 2012 by ASME](https://image.slidesharecdn.com/erteketaltriz24volkan02final-121125055342-phpapp02/85/Encapsulating-And-Representing-The-Knowledge-On-The-Evolution-Of-An-Engineering-System-17-320.jpg)
![system is crucial in terms of aesthetics. Here, the motivation was the difficulty of processing the
carbon fiber parts with good precision. The design team had initially implemented carbon fibers in
earlier versions because they are robust and low-weight. But the design was then and the carbon fiber
component (e) was removed completely, due to production issues. While the new design is slightly
heavier than the one with carbon fibers, it has a smaller quantity of substance and achieves better
quality resolving the contradiction.
CONCLUSIONS
This paper introduced a knowledge encapsulation and representation methodology, based on
TRIZ principles, for the evolution of an engineering system. A case study was presented, where the
design process for a wrist rehabilitation robot was extracted and represented as a graph and as a
database. The proposed approach and methodology can be used to represent the design process at an
abstract level, in terms of a finite number of TRIZ principles, and can be used in guiding future
product design process.
This research actually has formalized the approach of Altschuller, who discovered TRIZ through
observing 2 million patents. Having an established formal method of capturing how TRIZ is applied
through the successive stages of the design process, product designs can now be expressed not in
terms of the components implanted, but the design processes that were employed.
This research also opens up the opportunity for applying data mining [38] and network research
[39] methods at full scale for analyzing data on the product design process. Hence, much richer
insights can be discovered on design processes, which can improve future product design processes
and the resulting designs.
18 Copyright © 2012 by ASME](https://image.slidesharecdn.com/erteketaltriz24volkan02final-121125055342-phpapp02/85/Encapsulating-And-Representing-The-Knowledge-On-The-Evolution-Of-An-Engineering-System-18-320.jpg)
![REFERENCES
[1] Ideation International. Accessed on Jan 18, 2012.Availableonline at
http://www.ideationtriz.com/history.asp/.
[2] Altschuller, G., Shulyak, L., and Rodman, S., 1997.40 principles: TRIZ keys to innovation. Technical
Innovation Center, Inc.
[3] Ertek, G., Erdogan, A., Patoglu, V., Tunc, M.M., Citak, C., Vanli, T., 2012. Supplement Document for
“Encapsulating and representing the knowledge on the evolution of an engineering system”. Accessed
on May 16, 2012, Available online athttp://people.sabanciuniv.edu/ertekg/papers/supp/05.pdf.
[4] Duran-Novoa, R., Leon-Rovira, N., Aguayo-Tellez, H., Said, D., 2011. “Inventive problem solving based
on dialectical negation, using evolutionary algorithms and TRIZ heuristics”. Computers in Industry,62,
pp. 437-445.
[5] Verhaegen, P.A., D'hondt, J., Vertommen, J., Dewulf, S. and Duflou, J.R., 2009. “Relating properties and
functions from patents to TRIZ trends”. CIRP Journal of Manufacturing Science and Technology, 1(3),
pp. 126-130.
[6] Regli, W. C., X.Hu, Atwood, M., and Sun, W., 2000. “A survey of design rationale systems: Approaches,
representation, capture and retrieval”. Engineering with Computers, 16(3–4), pp. 209–236.
[7] Goa, Y., Zeid, I., and Bardez, T., 1998. “Characteristics
of an effective design plan to support re-use in case-based mechanical design”. Knowledge based systems,
10(??), pp. 337–350.
[8] Khadilkar, D., and Stauffer, L., 1996. “An experimental evaluation of design information reuse during
conceptual design”. Journal of Engineering Design, 7(4), pp. 331–339.
[9] Baxter, D., Gao, J., Case, K., Harding, J., Young, B., Cochrane, S., and Dani, S., 2007. “An engineering
design knowledge reuse methodology using process modelling”.Research in Engineering Design, 18, pp.
37–48.
[10] Merck. The Merck Manual – Home Edition. Accessed on Feb 16, 2012.Available online at
http://www.merck.com/mmhe/.
[11] Organization for Economic Cooperation and Development. “OECD Health Data”.Accessed on Feb 16,
2012.Available online at
http://www.tinyurl.com/yjj8xwq/.
19 Copyright © 2012 by ASME](https://image.slidesharecdn.com/erteketaltriz24volkan02final-121125055342-phpapp02/85/Encapsulating-And-Representing-The-Knowledge-On-The-Evolution-Of-An-Engineering-System-19-320.jpg)
![[12] One Degree of Separation: Paralysis and Spinal Chord Injury in the United States. Accessed on Feb 15,
2012.Available online at
http://www.christopherreeve.org.
[13] United States Bureau of Labor Statistics. Accessed on Feb 16, 2012.Available online at
http://tinyurl.com/ycruhuk/.
[14] Occupational Employment and Wages, 2008. Accessed on Feb 15, 2012.Available online at
http://www.bls.gov/oes/2008/may/chartbcha.pdf/.
[15] Lam, P., Hebert, D., Boger, J., Lacheray, H., Gardner, D., Apkarian, J., and Mihailidis, A., 2008. “A haptic
robotic platform for upper limb reaching stroke therapy: Preliminary design and evaluation results”.
Journal of NeuroEngineering and Rehabilitation, 5,pp. 15-27.
[16] Patoglu, V., Ertek, G., Zoroglu, D., Oz, O., and Kremer, G., 2010. “Design Requirements for a tendon
rehabilitation robot: results from a survey of engineers and health professionals”. In ASME 2010
International Design Engineering Technical Conferences & Computers and Information in Engineering
Conference,Montreal: ASME, pp. 1-10.
[17] Lee, M., Rittenhouse, M., and Abdullah, H., 2005. “Design issues for therapeutic robot systems: results
from a survey of physiotherapists”. Journal of Intelligent and Robotic Systems, pp. 239-252.
[18] TRIZ Contradiction Matrix. Accessed on Feb 15, 2012.Available online at
http://people.sabanciuniv.edu/ertekg/papers/supp/07.xls.
[19] Changqing, G., Kezheng, H. and Yong, Z., 2005. “Creative conceptual design ideas can be gotten with
TRIZ methodology”. TRIZ Journal.
[20] Cheng, S.T., Yu, W.D., Wu, C.M., and Chiu, R.S., 2006. “Analysis of Construction Inventive Patents Based
on TRIZ”. In Proceedings of International Symposium on Automation and Robotics in Construction,
ISARC, pp.3-5.
[21] Song, W. K., Kim, J., An, K. O., Lee, I. H., Song, W. J. and Lee, B. S. New Dual-Arm Assistive Robot for
Self-Feeding.Accessed on Feb 15, 2012. Available online at short urlhttp://tinyurl.com/7e3hkvs.
[22] Chen, C. K., Shea, A. J., Wang, K.M., and Yu, C.H., 2009. “Developing a TRIZ-Based Service System
Diagnostic Model for Aging in Place”. In APIEMS, Kitakyushu: APIEMS,pp. 2107-2112.
[23] Bosecker, C. J., and Krebs, H. I., 2009. “MIT-Skywalker”.In IEEE, International Conference on
Rehabilitation Robotics, Kyoto: IEEE, pp. 542-550.
20 Copyright © 2012 by ASME](https://image.slidesharecdn.com/erteketaltriz24volkan02final-121125055342-phpapp02/85/Encapsulating-And-Representing-The-Knowledge-On-The-Evolution-Of-An-Engineering-System-20-320.jpg)
![[24] Coelho, D. A., 2009. “Matching TRIZ Engineering parameters to human factors issues in
manufacturing”.Wseas Transactions on Business and Economics, 6(11),pp. 547-556.
[25] Cavallucci D., Rousselot F., 2007. “Evolution Hypothesis as a means for linking system parameters and
laws of engineering system evolution”. In the Proceedings of the 7th ETRIA TRIZ Future Conference,
Frankfurt, Germany, 6-8 November 2007, ISBN 978-3-89958-340-3 Kassel University Press, pp. 31-40.
[26] Kucharavy D., De Guio R., 2008.“Technological forecasting and assessment of barriers for emerging
technologies”.In the Proceedings of the International Association for Management of Technology
(IAMOT), 6-10 April 2008, pp. 20.
[27] Becattini, N., Cascini, G. and Rotini, F. 2011. “Correlations between the evolution of contradictions and
the law of identity increase”. Procedia Engineering, 9, pp. 236-250.
[28] Sowa JF (2000) Knowledge representation: logical philosophical, and computational foundations.
Brooks Cole, Pacific Grove.
[29] Chein, M., Mugnier, M-L., 2009. Graph-based Knowledge Representation: Computational
foundations of Conceptual Graphs. Springer.
[30] Cavallucci, D., Rousselot, F. and Zanni, C., 2011. “On contradiction clouds”.Procedia Engineering, 9, pp.
368-378.
[31] Opsahl, T., Agneessens, F. and Skvoretz, J., 2010. “Node centrality in weighted networks: Generalizing
degree and shortest paths”, Social Networks, 32 (3), pp. 245-251.
[32] Christensen, C. P., 2007. Inference, simulation, modelling, and analysis of complex networks, with
special emphasis on complex networks in systems biology.ProQuest.
[33] AssistOn-Wrist. Accessed on Feb 15, 2012. Available online
athttp://people.sabanciuniv.edu/ertekg/papers/supp/06.wmv .
[34] Satici, A.C., Erdogan A., and Patoglu, V., 2011. “A multi-lateral rehabilitation system”.Turkish Journal of
Electrical Engineering and Computer Sciences, 19(5), pp. 715-723.
[35] Gupta, A., O’Malley, M.K., Patoglu V.,andBurgar C., 2010. “Design,Control and Performance of
RiceWrist: A force feedback wrist exoskeleton for rehabilitation andtraining”. The International Journal
of Robotics Research, 27,pp. 233-251.
doi: 10.1177/0278364907084261.
21 Copyright © 2012 by ASME](https://image.slidesharecdn.com/erteketaltriz24volkan02final-121125055342-phpapp02/85/Encapsulating-And-Representing-The-Knowledge-On-The-Evolution-Of-An-Engineering-System-21-320.jpg)
![[36] Erdogan, A., Satici, A.C., and Patoglu, V., 2011. “Passive velocity field control of a forearm-wrist
rehabilitation robot”, In IEEE International Conference on Rehabilitation Robotics.
[37]Unal, R., 2008. Design optimization and control of a
parallel lower-arm exoskeleton. M.Sc. Thesis, Sabanci University, Istanbul, Turkey.Available online at
http://research.sabanciuniv.edu/14271.
[38] Han, J. and Kamber, M. 2006. Data Mining: Concepts and Techniques, Morgan Kaufmann.
[39] Christensen, C. and Albert, R. 2007. “Using graph concepts to understand the organization of complex
systems”, International Journal of Bifurcation and Chaos, 17(7), pp. 2201-2214.
22 Copyright © 2012 by ASME](https://image.slidesharecdn.com/erteketaltriz24volkan02final-121125055342-phpapp02/85/Encapsulating-And-Representing-The-Knowledge-On-The-Evolution-Of-An-Engineering-System-22-320.jpg)