This paper presents a novel methodology for linking behavioral patterns to personal attributes using data re-mining, specifically in the context of the retail industry. The method, called assocgraphrm, integrates association mining and graph visualization techniques to derive actionable insights from consumer transaction data and personal attributes. The effectiveness of this methodology is demonstrated through a case study involving market basket analysis and consumer surveys.

![Linking Behavioral Patterns to Personal Attributes
through Data Re-Mining
G¨ rdal Ertek1 , Ayhan Demiriz2 , and Fatih Cakmak3
u
1Sabancı University, Faculty of Engineering and Natural Sciences
Orhanli, Tuzla, 34956, Istanbul, Turkey. ertekg@sabanciuniv.edu
2 Department of Industrial Engineering
Sakarya University, 54187, Sakarya, Turkey. ademiriz@gmail.com
3 Sabancı University, Faculty of Arts and Social Sciences
Orhanli, Tuzla, 34956, Istanbul, Turkey.
Abstract. A fundamental challenge in behavioral informatics is the development
of methodologies and systems that can achieve its goals and tasks, including be-
havior pattern analysis. This study presents such a methodology, that can be con-
verted into a decision support system, by the appropriate integration of existing
tools for association mining and graph visualization. The methodology enables
the linking of behavioral patterns to personal attributes, through the re-mining
of colored association graphs that represent item associations. The methodology
is described and mathematically formalized, and is demonstrated in a case study
related with retail industry.
1 Introduction
This study aims at understanding the behavioral patterns exhibited by people in relation
to their personal attributes. The research is conducted in the context of retail indus-
try, where consumers engage in purchase transactions at retail shops and stores. The
traditional data mining technique for identifying the patterns in these transactions is
association mining, which enables the discovery of interpretable and actionable results
related with item associations. However, straightforward application of association min-
ing returns only item purchase patterns. An important question, whose answer has been
ignored in literature, is how these patterns are related to consumer attributes, such as
demographic attributes and physical state of the consumer during the purchase. In other
words, the link between the behavioral pattern (consumer purchase behavior) and the
person (consumer) him/herself is missing. Establishing this link requires a methodol-
ogy, as well as domain knowledge to enable domain-driven data mining [5].
A graph-based visualization methodology, namely AssocGraphRM, is proposed for
presenting association mining results, together with summary statistics regarding the
associations. The methodology suggests a visual data re-mining process, based on the
results generated by association mining. In the graph-representation, items and itemsets
are represented as vertices, set membership are represented through edges, and attribute
statistics are linearly mapped to the colors of vertices. The applicability and useful-
ness of the methodology is demonstrated through a market basket analysis (MBA) case
study where data from a consumer survey is analyzed. The survey contains a multitude](https://image.slidesharecdn.com/erteketalstarbucksbookchapterlncs-121125053343-phpapp02/85/Linking-Behavioral-Patterns-to-Personal-Attributes-through-Data-Re-Mining-2-320.jpg)
![of personal attributes, as well as preferences for items at Starbucks coffee stores. Sev-
eral actionable insights are derived regarding the relationship between the behavioral
patterns (item purchases) and the personal attributes, and their policy implications are
discussed.
The remainder of the chapter is organized as follows: In Section 2, an overview of
the basic concepts in related studies is presented through a concise literature review. In
Section 3, the AssocGraphRM methodology for visual re-mining on colored association
graphs is described, and framed as an algorithm using mathematical formalism. The
methodology and its applicability is then demonstrated in Section 4, using survey data
from food retail industry. The validity of the methodology is discussed in Section 5.
Finally, in Section 6, the study is summarized and future directions are discussed.
2 Literature
2.1 Behavior Informatics
The field of behavior informatics is introduced by Cao [4], and suggests the analysis of
behavioral patterns and impacts following behavior explicitation, through the extraction
of behavior elements masked in transactional data. The main goals and tasks of behav-
ior informatics are listed in [4] as behavior modeling and representation, construction
of behavioral data, behavior impact modeling, behavior pattern analysis, and behavior
presentation. The main idea in behavioral informatics is to organize the transactional
data into a new form that is constructed in terms of behavior, rather than entity relation-
ships. With the explosion of data that is collected electronically in massive amounts,
the main challenge in behavioral informatics is the development of methodologies and
systems that can achieve its goals and tasks. This study presents such a methodology,
that can be converted into a decision support system, by the appropriate integration of
existing tools for association mining and graph visualization.
2.2 Association Mining
Association mining is an increasingly used data mining and business tool among prac-
titioners and business analysts [10], due to the interpretable and actionable results it
generates. Association mining results can be classified based on several criteria, as out-
lined in [18]. In this chapter, we focus on frequent itemset, which are the sets that define
single-dimensional, single-level boolean association rules. Efficient algorithms such as
Apriori [1] enable the analysis of very large transactional data, frequently from trans-
actional sales data, resulting in a large collection of frequent itemsets.
Association mining is typically presented and discussed in the context of one of
its most common applications, namely market basket analysis (MBA), which can be
used in product recommender systems [10]. Let I = {i1 , i2 , ..., im } be a set of items
considered in MBA. Each transaction (basket) t will consist of a set of items where
t ⊆ I. Let D = ∪ t be the database of all transactions. The support sup( f ) of an itemset
(and also of the rule that contains the items in that itemset) is defined as the percentage
of the transactions in D that contain all the items of the itemset f :](https://image.slidesharecdn.com/erteketalstarbucksbookchapterlncs-121125053343-phpapp02/85/Linking-Behavioral-Patterns-to-Personal-Attributes-through-Data-Re-Mining-3-320.jpg)
![∑ 1{ f ⊆t}
t∈D
sup( f ) = (1)
|D|
A frequent itemset is an itemset that has support value greater than or equal to a
given minimum support threshold: sup( f ) ≥ min sup.
2.3 Visualizing Frequent Itemsets
Commonly, finding the frequent itemsets and association rules from very large data sets
is heavily emphasized, since it is considered as the most challenging step in associa-
tion mining [6, 17, 41, 42]. Results are typically presented in a text (or table) format
with certain degree of querying and sorting functionalities. However, the real objective
of the association mining analysis is to foster the discovery of insights, and there ex-
ists considerably less work that focuses on the interpretation of the association mining
results [14, 14].
Information visualization is the branch of computer science that investigates how
data and information can be visualized to obtain significant, deep, actionable insights
[9, 19, 23, 27]. Within information visualization, graph visualization can be a signifi-
cant source of insights, as demonstrated by numerous case studies in a multitude of
disciplines [8, 26, 30–33, 35, 38, 36]. There is a broad literature on graph visualization,
including the literature on graph drawing, but the use of graphs for the visualization
of association mining results is not well-formalized in academic literature. Still, data
analysis systems such as MS SQL Server [28] and SAS [34] can generate association
graphs.
This study is an extension of earlier work by Ertek and Demiriz [14], where a graph-
based methodology is proposed to visualize and interpret the results of well-known as-
sociation mining algorithms as directed graphs. According to the methodology in [14],
the items (also referred to as 1-itemsets) and the itemsets are represented as vertices
on an association graph. The vertices that represent the items are shown with no color,
whereas the vertices that represent the itemsets are colored reflecting the cardinality of
the itemsets. The sizes (the areas) of the vertices show the support levels. The directed
edges symbolize which items constitute a given frequent itemset.
The main idea in the methodology is to exploit already existing graph drawing algo-
rithms [37] and software in the information visualization literature [19] for visualizing
association mining results which are generated by already existing algorithms and soft-
ware in the data mining literature [18].
In the current study, the methodology in [14] is extended to incorporate additional
attributes, and mathematical formalism is introduced for describing the methodology.
Color is now used to represent the values of a selected additional attribute, instead of
the cardinality of the itemset. The cardinality of the itemset is instead reflected by the
thickness of the vertices. So, this extended study enables linking association mining
results with attributes of the person that carried out the transaction. In the context of
behavior informatics, the methodology establishes the critical link between behavioral
patterns and personal attributes.](https://image.slidesharecdn.com/erteketalstarbucksbookchapterlncs-121125053343-phpapp02/85/Linking-Behavioral-Patterns-to-Personal-Attributes-through-Data-Re-Mining-4-320.jpg)
![2.4 Re-Mining
The re-mining methodology was first introduced by Demiriz et al. [11]. Re-mining pro-
cess is defined as “combining the results of an original data mining process with a
new additional set of data and then mining the newly formed data again”. Re-mining
is fundamentally different from post-mining [7, 22, 25, 43, 44]: post-mining only sum-
marizes the data mining results, such as visualizing the association mining results [14,
21]. The re-mining methodology extends and generalizes post-mining. Re-mining can
be considered as an additional data mining step of Knowledge Discovery in Databases
(KDD) process [24] and can be conducted in explanatory/exploratory, descriptive, and
predictive manners.
In another study, Demiriz et al. [12] elaborate on the re-mining concept, introduce
mathematical formalism and present the algorithm for the methodology. [12] also ex-
tends the application of predictive re-mining in addition to exploratory and descriptive
re-mining, and presents a complexity analysis.
Quantitative and multi-dimensional association mining (QAM&MAM) are well-
known techniques within association mining [18] that can integrate additional attribute
data into the association mining process. The associations among the additional at-
tributes, and among them and itemsets are computed. However, both techniques intro-
duce significant additional complexity, since association mining is carried out with the
complete set of attributes rather than just the market basket data. The techniques work
directly towards the generation of multi-dimensional rules. They relate all the possible
categorical values of all the attributes to each other, which is NP-hard.
Re-mining, on the other hand, conveniently expands single dimensional rules with
additional attributes. In re-mining, attribute values are investigated and computed only
for the associated item pairs, with much less computational complexity that can be
solved in polynomial running time. Running time of QAM&MAM increase exponen-
tially with the number of additional attributes and the number of transactions, and re-
mining is even more preferable in such situations.
Demiriz et al. [11, 12] propose a practical and effective methodology that efficiently
enables the incorporation of attribute data (e.g. price, category, sales timeline) in ex-
plaining positive and negative item associations, which respectively indicate the com-
plementarity and substitution effects.
The work closest to re-mining is by Yao et al. [40], where a framework of a learning
classifier is proposed to explain the mined results. Unlike in [40], the re-mining [11, 12]
and visual re-mining approaches (this study) are applied to real world datasets as a proof
of their applicability.
3 Methodology: Re-Mining on Association Graphs
The fundamental idea in re-mining is to exploit the domain specific knowledge in a
new analysis step. Thus, re-mining is a recipe for domain-driven data mining [5]. The
AssocGraphRM methodology proposed and described in this chapter is a special type of
re-mining: Re-mining is conducted through visually mining colored association graphs.
By introducing mathematical formalism the methodology is presented in the form of an
algorithm.](https://image.slidesharecdn.com/erteketalstarbucksbookchapterlncs-121125053343-phpapp02/85/Linking-Behavioral-Patterns-to-Personal-Attributes-through-Data-Re-Mining-5-320.jpg)
![function that creates a clone of graph G
compute color(δ )
function that computes color based on darkness δ ∈ [0, 1]. Besides the argument δ ,
the RGB value for the computed color depends on the base RGB values for δ = 0
and δ = 1.
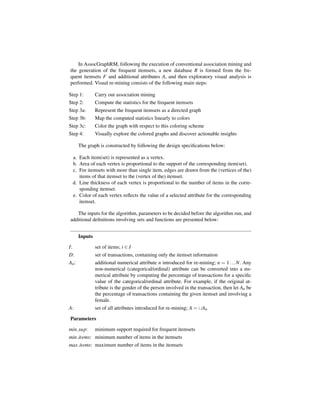
The complete methodology is formalized as an algorithm below:
Algorithm: AssocGraphRM
1. Perform association mining.
F = apriori(D, 1, max items, min sup)
2. Define frequent items and itemsets.
F1 = { f ∈ F : | f | = 1}
F>1 = F − F1
3. Label the item associations accordingly and append them as new records.
R = {r : r = ( f ), ∀ f ∈ F}
4. Expand the records with the cardinality value for the itemsets, and additional at-
tributes for re-mining.
for all r = ( f ) ∈ R
r = ( f , | f |)
for n = 1 . . . N
r = (r, ψ(An , f ))
5. Create the vertices of the graph, with area being linearly proportional to the sup-
port, and thickness being proportional to the cardinality of the itemset.
V = {}
for all f ∈ F
create new vertex(v)
v.itemset = f
v.record = record of( f )
sup( f )
v.diameter = min diameter min sup
v.thickness = | f |
vertex of( f ) = v
V v
6. Create the edges of the graph, emanating from the items in the itemsets and termi-
nating at the itemsets.
E = {}
for all f ∈ F>1
for all i ∈ f
create new edge(e)
e. f rom = vertex of(i)
e.to = vertex of( f )
E e](https://image.slidesharecdn.com/erteketalstarbucksbookchapterlncs-121125053343-phpapp02/85/Linking-Behavioral-Patterns-to-Personal-Attributes-through-Data-Re-Mining-8-320.jpg)
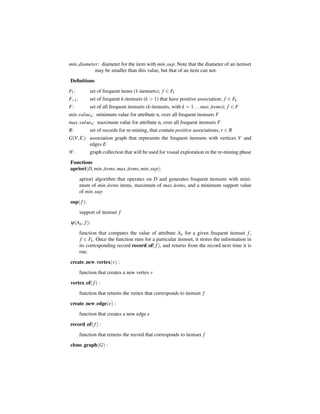
![7. Apply organic layout on G.
8. Compute the minimum and maximum values for each of the attributes.
min valuen = minn=1...N, f ∈F ψ(An , f )
max valuen = maxn=1...N, f ∈F ψ(An , f )
9. Color the vertices in G with respect to each additional attribute, and add to the
graph collection G . The closer the value for attribute n gets to the maximum value
of that attribute max valuen , the darker the vertex will be colored.
for n = 1 . . . N
G = clone graph(G)
for all v ∈ V
f = v.itemset
ψ(An , f )−min
v.darkness = max valuen −minvaluen n ∈ [0, 1]
value
v.color = compute color(v.darkness)
G G
10. Perform visual re-mining through human-involved exploratory examination of the
graphs in G .
4 Case Study
The proposed methodology is demonstrated through a case study using a survey dataset
collected from coffee retail industry. Several insights are discovered regarding the rela-
tionships among the frequent itemsets and personal attributes, and suggestions are made
on how these actions might be used used as operational policies.
4.1 Retail Industry
Recent research has positioned association mining as one of the most popular tools in
retail analytics [3]. Market basket analysis is considered as a motivation, and is used
as a test bed for these algorithms. Additional data are readily available either within
the market basket data or as additional data, thanks to loyalty cards in retailing, which
enable linking transactions to personal data, such as age, gender, county of residence,
etc.
As of November 2010, the retail industry in US alone runs on a monthly sales of
$377.5 billion, with food services and food retail industry constituting %10 share in
it [39]. Due to its gigantic size, retail industry has been selected as the domain of the
case study. Starbucks is one of the best-known brands in food retail, and the best-known
brand in coffee retail / specialty eateries industry, with 137,000 employees and a global
monthly revenue of nearly $1 billion [39]. Due to the company’s visibility, the products
of Starbucks have been considered for constructing the survey data.
4.2 The Data
A survey has been conducted with 644 respondents, that contain nearly equal distribu-
tion of working people vs. students (all students were assumed non-working), women](https://image.slidesharecdn.com/erteketalstarbucksbookchapterlncs-121125053343-phpapp02/85/Linking-Behavioral-Patterns-to-Personal-Attributes-through-Data-Re-Mining-9-320.jpg)
![vs. men, and a multitude of universities and working environments. Each respondent
was questioned for 22 attributes that reflect their demographic characteristics and life
style preferences.
The fields in the dataset include demographic attributes (YearOfBirth, Gender,
EmploymentStatus, IncomeType, etc.), attributes related with life style (FavoriteColor,
SoccerTeam, FavoriteMusicGenre, etc.), educational background (University, En-
glishLevel, FrenchLevel, etc.), perceptional and intentional information (ReasonForGoing,
etc.), and physical status at the time the survey was conducted (HungerLevel, ThirstLevel).
The number of additional attributes to be used in Step 8 of the algorithm totalled to 21.
As the transaction data, each respondent was also asked which items they would
prefer from the menu of Starbucks Turkey stores if they had 15 TL Turkish Liras (ap-
proximately $10). The menu considered was the menu as of October 2009, and the
respondents were limited to select at most four items without exceeding the budget
limit. While the original survey distinguished between the different sizes (tall, grande,
venti), in the data cleaning and preparation phase, the sizes for each type of item (such
as Cafe Latte or Capuchino) were aggregated and considered as a single item (group).
The original survey also contained preferences under a budget of 20 TL, but those pref-
erences were not analyzed in the case study.
Even though market basket analysis is carried out in retail industry with transactions
data that is logged through sales, preference data was collected in the survey and used
instead of the transactions data. This is due to the well-known difficulty of obtaining
real world transactions data from companies, which they consider highly confidential,
even when masked.
4.3 The Process
Data was assembled in MS Excel and cleaned following the guidelines in the taxonomy
of dirty data by Kim et al. [20]. The transactions were given as input into Borgelt’s
apriori software [2], and the apriori algorithm was run with a support value of 2%.
The sizes of the vertices (based on the support values), the statistics for the frequent
itemsets, and the corresponding vertex colors were computed in MS Excel spreadsheet
software through distributed manual processing by 30 Sabancı University students, and
assembled through the EditGrid [13] online spreadsheet service. The association graph
was manually drawn in yEd Graph Editor software and an organic layout was applied.
yEd implements several types of graph drawing algorithms, including those that cre-
ate hierarchical, organic, orthogonal, and circular layouts, and allows customization of
the layouts through structure and parameter selections. Past experience with the soft-
ware in applied research projects has shown that in Classic Organic Layout in yEd
is especially suitable for displaying associations. Organic layout is generated based on
force-directed placement algorithms [16] in graph drawing. This layout selection ends
up placing items that belong to similar frequent itemsets and in close proximity of each
other. After constructing the base graph in yEd, the yEd graphml file was cloned, and
each copy was colored manually according to a different additional attribute. Then the
resulting collection of graphs were analyzed through brain-storming sessions and ac-
tionable insights, together with their policy implications, were determined.](https://image.slidesharecdn.com/erteketalstarbucksbookchapterlncs-121125053343-phpapp02/85/Linking-Behavioral-Patterns-to-Personal-Attributes-through-Data-Re-Mining-10-320.jpg)
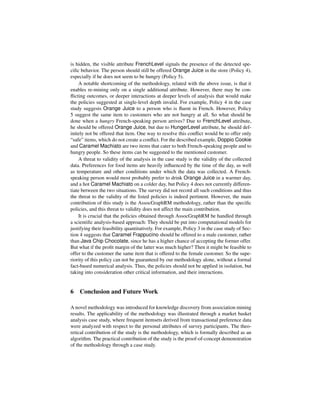
![of the k-itemsets with k > 1 have white color. This is consistent with what would be
expected, since a person who is not hungry is unlikely to order many items. The items
that can be offered to a person, even if he is not hungry at all, are suggested in the next
policy:
Policy 5: “If, at the point of sale (POS), a customer does not seem to be hungry,
suggest Iced White Chocolate Mocha, Java Chip or Orange Juice.”
The coloring of the vertices revealed insights on the behavioral patterns, explaining
them through personal attributes. The fact that the association graphs can be interpreted
even by the least technical analysts is a big advantage and a great motivation for using
the methodology in the real world.
5 Validity
A fundamental question, regarding the validity of the proposed AssocGraphRM method-
ology, can be posed in the line of the classical dilemma of statistical data analysis [29]:
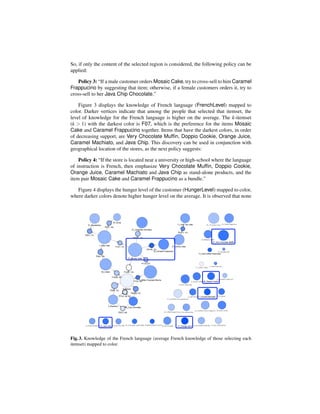
“Is the discovered relation a result of causality, or is it just correlation?” For example,
considering Policy 4 in Section 4, does a person who is fluent in French order Or-
ange Juice due to his knowledge of French, or due to some other reason, which would
explain both his language proficiency and preference for Orange Juice? For practi-
cal purposes, this is not a problem. Even if the underlying attribute for the behavior
Fig. 4. Hunger level attribute (average hunger level for those selecting each itemset) mapped to
color.](https://image.slidesharecdn.com/erteketalstarbucksbookchapterlncs-121125053343-phpapp02/85/Linking-Behavioral-Patterns-to-Personal-Attributes-through-Data-Re-Mining-14-320.jpg)
![In every industry, especially food retail industry, new products emerge and con-
sumer preferences change at a fast pace. Thus one would be interested in laying the
foundation of an analysis framework that can fit to the dynamic nature of retailing data.
The presented methodology can be adapted for analysis of frequent itemsets and as-
sociation rules over time by incorporating latest research on evolving graphs [15] and
statistical tests for measuring the significance of changes over time.
The main motivation of the chapter is the discovery of behavioral patterns in relation
to the human that exhibited the behavior. The methodology can be applied to similar
data from different fields that study the behavior of agents individually and in relation
to each other, including psychology, sociology, behavioral economics, behavior-based
robotics, and ethology.
Acknowledgement
˙
The authors thank Ilhan Karabulut for her work that inspired this research, Ahmet
Sahin¨ z for creating colored graphs with the earlier datasets, that inspired the final
¸ o
form of the graphs. The authors thank Samet Bilgen, Dilara Naibi, Ahmet Memiso˜ lu,
¸ g
and Namık Kerenciler for collecting the data used in the study, and to Didem Cansu
Kurada for her insightful suggestions regarding the study.
References
1. R. Agrawal and R. Srikant. Fast algorithms for mining association rules in large databases. In
Proceedings of the 20th International Conference on Very Large Data Bases, pages 487–499.
Morgan Kaufmann Publishers Inc., 1994.
2. C. Borgelt. http://fuzzy.cs.uni-magdeburg.de/˜borgelt/apriori.
html, 2011.
3. T. Brijs, G. Swinnen, K. Vanhoof, and G. Wets. Building an association rules framework to
improve product assortment decisions. Data Mining and Knowledge Discovery, 8(1):7–23,
2004.
4. L. Cao. Behavior informatics and analytics: Let behavior talk. In Data Mining Workshops,
2008. ICDMW ’08. IEEE International Conference on, pages 87 –96, 2008.
5. L. Cao and C. Zhang. The evolution of KDD: towards domain-driven data mining. Interna-
tional Journal of Pattern Recognition Artificial Intelligence, 21(4):677 – 692, 2007.
6. A. Ceglar and J.F. Roddick. Association mining. ACM Computing Surveys (CSUR), 38(2):5,
2006.
7. S. W. Changchien and T.-C. Lu. Mining association rules procedure to support on-line rec-
ommendation by customers and products fragmentation. Expert Systems with Applications,
20(4):325 – 335, 2001.
8. M. Chatti, M. Jarke, T. Indriasari, and M. Specht. NetLearn: Social Network Analysis and
Visualizations for Learning. Learning in the Synergy of Multiple Disciplines, pages 310–324,
2009.
9. C. Chen. Information visualization. Wiley Interdisciplinary Reviews: Computational Statis-
tics, 2(4):387–403, 2010.
10. A. Demiriz. Enhancing product recommender systems on sparse binary data. Data Mining
and Knowledge Discovery, 9(2):147–170, 2004.](https://image.slidesharecdn.com/erteketalstarbucksbookchapterlncs-121125053343-phpapp02/85/Linking-Behavioral-Patterns-to-Personal-Attributes-through-Data-Re-Mining-16-320.jpg)