This paper presents a novel approach to re-mining item associations in apparel retailing, which integrates price, time, and domain attributes into association mining results. The proposed methodology enhances the understanding of both positive and negative item associations, facilitating a more comprehensive analysis compared to traditional methods. A case study demonstrates its applicability and advantages over existing data mining techniques within the retail context.

![1. Introduction
Association mining is a data mining technique which generates rules
in the form of X ⇒ Y , where X and Y are two non-overlapping discrete
sets. A rule is considered as significant if it is satisfied by at least a cer-
tain percentage of cases (minimum support) and its confidence is above a
certain threshold (minimum confidence). Conventional association mining
considers “positive” relations in the form of X ⇒ Y . However, negative
associations in the form of X ⇒ ¬Y , where ¬Y represents the negation
(absence) of Y , can also be discovered through association mining.
Recent research has positioned association mining as one of the most
popular tools in retail analytics [7]. Association mining primarily generates
positive association rules that reveal complementary effects, suggesting that
the purchase of an item can generate sales of other items. Yet, association
mining can also be used to reveal substitution effects, where substitution
means that a product is purchased instead of another one. Although posi-
tive associations have traditionally been an integral part of retail analytics,
negative associations have not.
Numerous algorithms have been introduced to find positive and nega-
tive associations, following the pioneering work of Agrawal et al. [3]. Market
basket analysis is considered as a motivation, and is used as a test bed for
these algorithms. Price data are readily available within the market bas-
ket data and one would expect to observe its usage in various applications.
Conceptually quantitative association mining (QAM) [14, 22] can handle
pricing data and other attribute data. However, pricing data have not been
utilized before as a quantitative attribute in quantitative association mining
except in [9, 18]. Korn et al. [18] explore a solution with the help of singular
2](https://image.slidesharecdn.com/demirizetal-121125070220-phpapp01/85/Re-Mining-Item-Associations-Methodology-and-a-Case-Study-in-Apparel-Retailing-3-320.jpg)
![value decomposition (SVD) and Demiriz et al. [9] extend the results from
SVD to find item associations depending on SVD rule similarities. Quan-
titative association mining is not the only choice for analyzing attribute
data within existing frameworks. Multidimensional association mining [14]
is methodology that can be adapted in analyzing such data. The complexity
of association mining increases with the usage of additional attribute data,
which may include both categorical and quantitative attributes in addition
to the transaction data [4]. Even worse, the attribute data might be denser
compared to transaction data.
The main contribution of this paper is a practical and effective method-
ology that efficiently enables the incorporation of attribute data (e.g. price,
category, sales timeline) in explaining positive and negative item associa-
tions, which respectively indicate the complementarity and substitution ef-
fects. To the best of our knowledge, there exists no methodological research
in the data mining or information science literature that enables such a
multi-faceted analysis to be executed efficiently and is proven on real world
data. The core of the proposed methodology is a new secondary data mining
process to discover new insights regarding positive and negative associations.
As a novel and broadly applicable concept, we introduce and define data
re-mining as the mining of a newly formed data that is constructed upon
the results of an original data mining process. The newly formed data will
contain additional attributes joined with the original data mining results.
In the case study presented in this paper, these attributes are related to
price, item, domain and time. The methodology combines pricing as well as
other information with the original association mining results through a new
mining process, generating new rules to characterize, describe and explain
the underlying factors behind positive and negative associations. Re-mining
3](https://image.slidesharecdn.com/demirizetal-121125070220-phpapp01/85/Re-Mining-Item-Associations-Methodology-and-a-Case-Study-in-Apparel-Retailing-4-320.jpg)
![is fundamentally different from post-mining: post-mining only summarizes
the data mining results, such as visualizing the association mining results
[11]. The re-mining methodology extends and generalizes post-mining.
Our work contributes to the field of data mining in four ways:
1. We introduce a new data mining concept and its associated process,
named as Re-Mining, which enables an elaborate analysis of both pos-
itive and negative associations for discovering the factors and explain-
ing the reasons for such associations.
2. We enable the efficient inclusion of price data into the mining process,
in addition to other attributes of the items and the application domain.
3. We illustrate that the proposed methodology is applicable to real world
data, through a case study in apparel retailing industry.
4. Different ways of re-mining, namely exploratory, descriptive and pre-
dictive re-mining, are applied to real world data.
The re-mining framework was first introduced in [10]. This paper elab-
orates on the concept, introduces mathematical formalism and presents the
algorithm for the methodology. The work in this paper also extends the ap-
plication of predictive re-mining in addition to exploratory and descriptive
re-mining, and presents a complexity analysis.
The remainder of the paper is organized as follows. In Section 2, an
overview of the basic concepts in related studies is presented through a
concise literature review. In Section 3, Re-Mining is motivated, defined,
and framed. The methodology is put into use with apparel retail data in
Section 4 and its applicability is demonstrated. In Section 5, the limitations
of quantitative association mining (QAM) are illustrated with regards to
the retail data used in this paper. In Section 6, the complexity of re-mining
4](https://image.slidesharecdn.com/demirizetal-121125070220-phpapp01/85/Re-Mining-Item-Associations-Methodology-and-a-Case-Study-in-Apparel-Retailing-5-320.jpg)
![is compared to QAM, illustrating its significant advantage against QAM.
Finally, Section 7 summarizes the study and discusses future directions.
2. Related Literature
One of the most common applications of association mining is literally
market basket analysis (MBA), which can be used in product recommenda-
tion systems [8]. Following the notation used in [14], let I = {I1 , I2 , ..., Im }
be a set of items considered in MBA. Then each transaction (basket) T
will consist of a set of items where T ⊆ I. Each item in transaction T
will have a corresponding price p, which might change from time to time
i.e. p is not necessarily constant over the time span. Let X and Y be two
non-overlapping sets of items, where X ⊂ I and Y ⊂ I, contained in some
transactions. An association rule is an implication of the following form
X ⇒ Y . Assume D is the set of all transactions, then the support (s) of the
rule is defined as the percentage of the transactions in D that contain both
X and Y i.e. the itemset X ∪ Y . Recall that X ∩ Y = ∅. The confidence (c)
of the rule X ⇒ Y is defined as the percentage of transactions within D con-
taining X, that also contain Y . In other words, confidence is the percentage
of transactions containing Y , given that those transactions already contain
X. Notice that this is equivalent to the definition of conditional probability.
Quantitative and multi-dimensional association mining are well-known
techniques [14] that can integrate attribute data into the association min-
ing process, where the associations among these attributes are also found.
However, these techniques introduce significant additional complexity, since
association mining is carried out with the complete set of attributes rather
than just the market basket data. In the case of QAM, quantitative at-
5](https://image.slidesharecdn.com/demirizetal-121125070220-phpapp01/85/Re-Mining-Item-Associations-Methodology-and-a-Case-Study-in-Apparel-Retailing-6-320.jpg)
![tributes are transformed into categorical attributes through discretization,
transforming the problem into multi-dimensional association mining with
only categorical attributes. This is an NP-Complete problem as shown by
Angiulli et al. [4], meaning that the running time increases exponentially as
the number of additional attributes increases linearly.
Multi-dimensional association mining works directly towards the genera-
tion of multi-dimensional rules. It relates all the possible categorical values
of all the attributes to each other. Re-mining, on the other hand, expands
single dimensional rules with additional attributes. In re-mining, attribute
values are investigated and computed only for the positively and negatively
associated item pairs, with much less computational complexity that can be
solved in polynomial running time.
2.1. Negative Association Mining
In research and practice, association mining commonly refers to posi-
tive association mining. Since positive association mining has been studied
extensively, only (some of) the approaches for finding negative associations
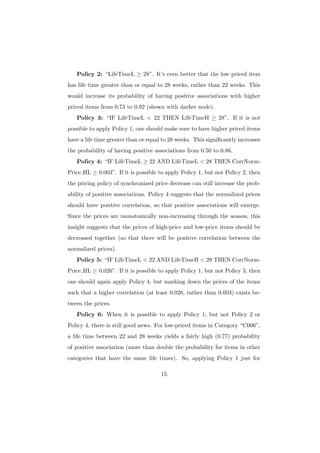
are reviewed. One innovative approach [21] utilizes the domain knowledge
of item hierarchy (taxonomy), and seeks negative association between items
in a pairwise way. Authors in [21] propose the rule interestingness measure
(RI) based on the difference between expected support and actual support:
E[s(XY )]−s(XY )
RI = s(X) . A minimum threshold is specified for RI for the candi-
date negative itemsets, besides the minimum support threshold. Depending
on the taxonomy (e.g. Figure 1(a)) and the frequent itemsets, candidate
negative itemsets can be generated. For example, assuming that the itemset
{CG} is frequent in Figure 1(a), the dashed curves represent some of the
candidate negative itemsets.
6](https://image.slidesharecdn.com/demirizetal-121125070220-phpapp01/85/Re-Mining-Item-Associations-Methodology-and-a-Case-Study-in-Apparel-Retailing-7-320.jpg)
![Tan et al. [24] find negative associations through indirect associations.
Figure 1(b) depicts such an indirect association {BC} via item A. In Figure
1(b) itemsets {AB} and {AC} are both assumed to be frequent, whereas
the itemset {BC} is not. The itemset {BC} is said to have an indirect
association via the item A and thus is considered as a candidate negative
association. Item A in this case is called as a mediator for the itemset
{BC}. Just like the aforementioned method in [21], indirect association
mining also uses an interestingness measure -dependency in this case- as a
threshold. Indirect mining selects as candidates the frequent itemsets that
have strong dependency with their mediator.
Both methods discussed above are suitable for retail analytics and the
approach in [24] is selected in this study to compute negative associations
due to convenience of implementation.
2.2. Quantitative and Multi-Dimensional Association Mining
The traditional method of incorporating quantitative data into associa-
tion mining is to discretize (categorize) the continuous attributes. An early
work by Srikant and Agrawal [22] proposes such an approach where the con-
tinuous attributes are first partitioned and then treated just like categorical
data. For this, consecutive integer values are assigned to each adjacent par-
tition. In case the quantitative attribute has few distinct values, consecutive
integer values can be assigned to these few values to conserve the ordering
of the data. When there is not enough support for a partition, the adjacent
partitions are merged and the mining process is rerun. [22] emphasizes rules
with quantitative attributes only on the left hand side (antecedent) of the
rules. However, since each partition is treated as if it were categorical, it is
also possible to obtain rules with quantitative attributes on the right hand
7](https://image.slidesharecdn.com/demirizetal-121125070220-phpapp01/85/Re-Mining-Item-Associations-Methodology-and-a-Case-Study-in-Apparel-Retailing-8-320.jpg)
![side (consequent) of the rules.
An alternative statistical approach is followed by Aumann and Lindell
[6] for finding association rules with quantitative attributes. The rules found
in [6] can contain statistics (mean, variance and median) of the quantitative
attributes, as in our methodology.
In comparison to the aforementioned approaches, re-mining does not
investigate every combination of attribute values, and is much faster than
QAM. For the sake of completeness, QAM is also carried out and is compared
against re-mining in Section 5.
Korn et al. [18] summarize the expenses made on the items through ratio
rules. An example ratio rule would be “Customers who buy bread:milk:butter
spend 1:2:5 dollars on these items.” This is a potentially useful way of
utilizing the price data for unveiling the hidden relationships among the
items in sales transactions. According to this approach, one can basically
form a price matrix from sales transactions and analyze it via singular value
decomposition (SVD) to find positive and negative associations. Ensuring
the scalability of SVD in finding the ratio rules is a significant research
challenge. Demiriz et al. [9] use ratio rule similarities based on price data
to find both positive and negative item associations.
2.3. Learning Association Rules
Yao et al. [27] propose a framework of a learning classifier to explain the
mined results. However, the described framework considers and interprets
only the positive association rules and requires human intervention for la-
beling the generated rules as interesting or not. The framework in [27] is
the closest work in the literature to the re-mining methodology proposed
here. However re-mining is unique in the sense that it also includes negative
8](https://image.slidesharecdn.com/demirizetal-121125070220-phpapp01/85/Re-Mining-Item-Associations-Methodology-and-a-Case-Study-in-Apparel-Retailing-9-320.jpg)
![associations and is suitable for the automated rule discovery to explain the
originally mined results. Meanwhile, unlike in [27], the proposed approach is
applied to a real world dataset as a proof of its applicability, and a through
complexity analysis is carried out.
Finally, based on correlation analysis, Antoine and Za¨ [5] propose an
ıne
algorithm to classify associations as positive and negative. However learning
is only based on correlation data and the scope is limited to labelling the
associations as positive or negative.
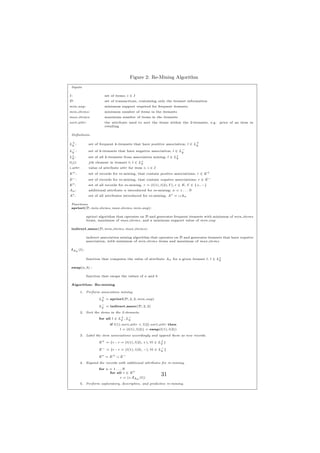
3. The Methodology
The proposed re-mining methodology, which transforms the post-mining
step into a new data mining process, is introduced in this section. A math-
ematical formalism is introduced and the methodology is presented in the
form of an algorithm in Figure 2. Re-mining can be considered as an addi-
tional data mining step of Knowledge Discovery in Databases (KDD) process
[12] and can be conducted in explanatory, descriptive, and predictive man-
ners. Re-mining process is defined as “combining the results of an original
data mining process with a new additional set of data and then mining the
newly formed data again”.
The methodology consists of the following five steps (Figure 2):
1. Perform association mining.
2. Sort the items in the 2-itemsets.
3. Label the item associations accordingly and append them as new
records.
4. Expand the records with additional attributes for re-mining.
5. Perform exploratory, descriptive, and predictive re-mining.
9](https://image.slidesharecdn.com/demirizetal-121125070220-phpapp01/85/Re-Mining-Item-Associations-Methodology-and-a-Case-Study-in-Apparel-Retailing-10-320.jpg)
![mining process by introducing new attributes. However, there might be
certain cases that adding such information would increase the complexity of
the underlying model [4] and diminish the strength of the algorithm. To be
more specific, it might be necessary to find attribute associations when the
item associations are also present, which requires constraint-based mining
[20]. Re-mining may help with grasping the causality effects that exist in
the data as well, since the input of the causality models may be an outcome
of the another data mining process.
4. Case Study
In this section, the applicability of the re-mining process is demonstrated
through a real world case study that involves the store level retail sales
data originating from an apparel retail chain. In the case study, there was
access to complete sales, stock and transshipment data belonging to a single
merchandise group (men’s clothes line) coming from all the stores of the
retail chain (over 200 of them across the country) for the 2007 summer
season. A detailed description of the retail data can be found in [10].
In this section, the application of the re-mining methodology on the
retail dataset is presented. Re-mining reveals the profound effect of pricing
on item associations and frequent itemsets, and provides insights that the
retail company can act upon.
4.1. Conventional Association Mining
As the first step of the re-mining methodology, conventional association
mining has been conducted. Apriori algorithm was run to generate the fre-
quent itemsets with a minimum support count of 100. All the 600 items were
found to be frequent. In re-mining, only the frequent 2-itemsets have been
11](https://image.slidesharecdn.com/demirizetal-121125070220-phpapp01/85/Re-Mining-Item-Associations-Methodology-and-a-Case-Study-in-Apparel-Retailing-12-320.jpg)
![investigated and 3930 such pairs have been found. Thus frequent itemsets
were used in the analysis, rather than association rules. For the illustration
purposes, the top-5 frequent pairs can be found in Table 1 of [10].
The frequent pairs were then used in finding the negatively related pairs
via indirect association mining. Negative relation is an indicator of product
substitution. Implementing indirect association mining resulted in 5,386
negative itemsets, including the mediator items. These itemsets were re-
duced to a set of 2,433 unique item pairs when the mediators were removed.
This indeed shows that a considerable portion of the item pairs in the dataset
are negatively related via more than one mediator item.
4.2. Re-Mining the Expanded Data
Following the execution of conventional positive and negative association
mining, a new data set E ∗ (see Figure 2) was formed from the item pairs and
their additional attributes A∗ for performing exploratory, descriptive and
predictive re-mining. Supervised classification methods require the input
data in table format, in which one of the attributes is the class label. The
type of association, positive (‘+’) or negative (‘-’), was selected as the class
label in the analysis.
An item pair can generate two distinct rows for the learning set - e.g.
pairs AB and BA, but this representation ultimately yields degenerate rules
out of learning process. One way of representing the pair data is to order
(rank) items in the pair according to a sort criterion, which is referred to
as sort attr in the re-mining algorithm (Figure 2). In the case study, sort
attribute was selected as the price, which marks the items as higher and
lower priced items, respectively.
For computing price-related statistics (means and standard deviations)
12](https://image.slidesharecdn.com/demirizetal-121125070220-phpapp01/85/Re-Mining-Item-Associations-Methodology-and-a-Case-Study-in-Apparel-Retailing-13-320.jpg)
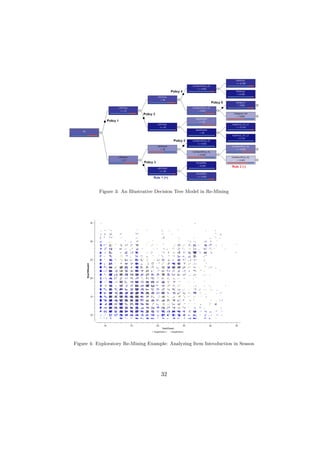
![points indicate positive associations, and light grey points indicate negative
associations. It is easy to see the very heavy concentration of blue dots in
the region where the initial (maximum) item price is between 14 and 18 TL
(Turkish Liras) (14 < MaxPriceL < 18). The concentration of grey dots in
that region is very dense, suggesting Policy 5. Also, when scanning the y axis
(MaxPriceL), one can observe that items with an initial price tag greater
than 70 TL almost always have positive associations with lower-priced items
in the price range of 38 to 42 TL, suggesting Policy 6.
Policy 7: Keep the initial price of low-priced items in the range of 14 to
18 TL. This will enable them to generate new sales, thanks to their positive
associations with many higher priced items.
Policy 8: Position the items with price tag between 38 to 42 TL together
with (related) items that have an initial price tag over 70 TL.
It is clear that the policies generated by the visual analysis of the decision
tree and a sample colored scatter plot complement each other. This suggests
that one should carry out a variety of analyses in the re-mining stage.
4.4. Predictive Re-Mining
In predictive re-mining, the aim is to predict (based on their attributes)
whether two items have positive or negative associations. To show the ap-
plicability of re-mining, various predictive methods in SAS Enterprise Miner
are used in this study. Support Vector Machines (SVM) [23], Memory Based
Reasoning (MBR), Neural Networks (NN) [26], Gradient Boosting [13], Au-
toNeural and Decision Tree [28] nodes are utilized in predictive analysis.
The data set is partitioned to training set (50%), validation set (20%) and
test set (30%) before predictive methods.
The accuracy results are reported in Table 1. NN model is the clear
17](https://image.slidesharecdn.com/demirizetal-121125070220-phpapp01/85/Re-Mining-Item-Associations-Methodology-and-a-Case-Study-in-Apparel-Retailing-18-320.jpg)
![winner among the predictive models. Accuracy rates of the test set from
four different models over 0.70 are an indication of accurate item association
predictions based on the attribute data. Both positive and negative asso-
ciations can be predicted accurately by utilizing attribute data, suggesting
that re-mining approach can be successfully used for predictive purposes.
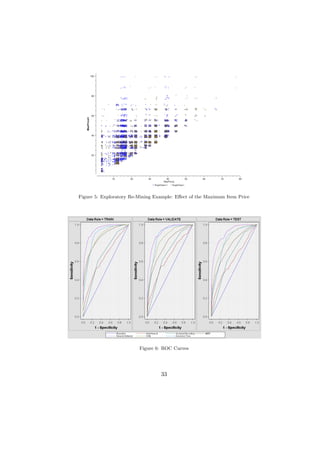
In addition to accuracy rates, receiver operating characteristic (ROC)
curves (see [28]) are given in Figure 6. Sensitivity and specificity are defined
as the true positive rate and the true negative rate, respectively. By defini-
tion, better classifiers have ROC curves towards the upper left of the plots.
Therefore NN model has the best ROC curve and the decision tree model
has the second best ROC curve among the predictive models. Similarly the
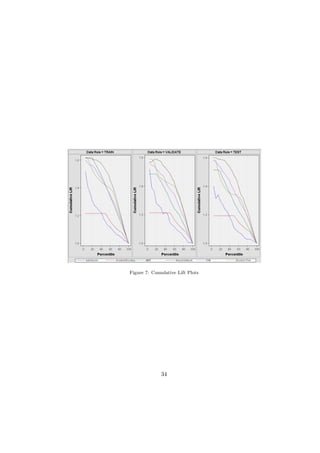
cumulative lift plots [17] are depicted in Figure 7. The most upper right plot
represents the best classifier in terms of lift. NN is again the best classifier
and SVM performs as the next best model.
Variable importance is another statistic regarding classification models.
Table 2 reports importance statistics of training and validation sets sepa-
rately from the decision tree model. In light of Table 2 one can conclude
that the correlation-based attributes play important roles along with the
price-related attributes. Nevertheless, item attributes have predictive prop-
erties in terms of item associations. The attribute data can and should be
used in determining the item associations. The plain transaction data might
be less informative in terms of item associations.
The evidence presented in this section suggests that the use of classifica-
tion models is justified and Policy 9 presents an algorithm for incorporating
classification models into retail markdown planning for the next season:
Policy 9: For every item, compute the values of the important variables
in Table 2. Then put these into the classification model and predict the
18](https://image.slidesharecdn.com/demirizetal-121125070220-phpapp01/85/Re-Mining-Item-Associations-Methodology-and-a-Case-Study-in-Apparel-Retailing-19-320.jpg)
![sign of association between every item pair. For items that are predicted to
have positive associations, create clusters based on merchandise group, start
time, and initial price. Present the clusters of items together in marketing
campaigns and in stores.
5. Comparison with Quantitative Association Mining
As mentioned earlier, as an alternative to re-mining, additional attribute
data used can also be incorporated through QAM. This alternative analy-
sis has also been conducted to illustrate its limitations on analyzing retail
data. Quantitative association mining has been studied extensively in the
literature and some of its major applications, such as [22], were reviewed
in Section 2.2. In the case study, an initial analysis of the price data sug-
gested that there are few price levels for each of the products. Therefore a
straight-forward discretization, which does not require a complex transfor-
mation, was possible. One of the most important steps in the QAM is the
discretization step. Instead of utilizing a more complex scheme for QAM,
in the re-mining case study, the item and price information were conjoined
into a new entity.
The two main seasons in apparel retailing, winter and summer, have
approximately equal length. As a common business rule, prices are not
marked down too often. Usually, at least two weeks pass by between sub-
sequent markdowns. Thus, there exist a countable set of price levels within
each season. There might be temporary sales promotions during the season,
but marked down prices remain the same until the next price markdown.
Prices are set at the highest level in the beginning of each season, falling
down by each markdown. If the price data of a product is normalized by
19](https://image.slidesharecdn.com/demirizetal-121125070220-phpapp01/85/Re-Mining-Item-Associations-Methodology-and-a-Case-Study-in-Apparel-Retailing-20-320.jpg)
![dividing by the highest price, normalized prices will be less than or equal
to one. When two significant digits are used after the decimal point, prices
can be easily discretized. For example, after an initial markdown of 10%,
the normalized price will be 0.90. Markdowns are usually computed on the
original highest price. In other words, if the second markdown is 30% then
the normalized price is computed as 0.70.
After using this discretization scheme, 3,851 unique product-normalized
price pairs have been obtained for the 600 unique products of the original
transaction data. Each product has six price levels on the average. The
highest number of price levels for a product is 14 and the lowest number of
price levels is two. This shows that markdowns were applied to all the prod-
ucts and no product has been sold at its original price throughout the whole
season. Technically, a discretized price can be appended to a corresponding
product name to create a new unique entity for the QAM. For example ap-
pending 0.90 to the product name ‘A’ after an underscore will create the new
entity ‘A 0.90’. One can easily utilize the conventional association mining
to conduct a discretized QAM after this data transformation.
The top-10 frequent pairs and their support counts can be found in Table
2 of [10]. As can be observed from that table, a large portion of the frequent
purchases occurs at the discounted prices. Among the top-10 frequent item
pairs, only the sixth one has full prices for both of the items. The remaining
pairs are purchased at marked down prices.
The retail company does not allow price differentiations by locations. In
other words, an item will have the same price across all the stores. Quan-
titative association mining can identify negative associations between items
for value combinations that actually never occur. For example, even though
an item A is sold only at the normalized price of 0.70 in the time interval
20](https://image.slidesharecdn.com/demirizetal-121125070220-phpapp01/85/Re-Mining-Item-Associations-Methodology-and-a-Case-Study-in-Apparel-Retailing-21-320.jpg)
![that B is sold, QAM can still suggest other price combinations of A and B,
such as (A 1.00, B 1.00) as negative item pairs. Thus, many item-price com-
binations will have negative associations due to the nature of the business
and the way QAM operates, yielding misleading results.
Even though both positive and negative QAM can be run on any given
dataset conceptually, it is not guaranteed to yield useful outcomes. Alter-
natively, re-mining operates only on the confirmed positive and negative
quantitative associations and does not exhibit the discussed problem.
6. Complexity Analysis
In this section, the complexity of the re-mining algorithm is analyzed
in comparison to the conventional QAM. First, the complexity of re-mining
is discussed, based on results from the literature on the Apriori algorithm.
Then, the complexity of QAM is discussed, based on two milestone papers
[4, 25], and results from the computational complexity literature.
Before proceeding with the complexity analysis, it should be remarked
that QAM computes detailed itemsets/rules, that contain specific informa-
tion that contain atomic conditions, such as “Attribute A1 taking the value
of u1j , and attribute A2 taking the value of u2j ”. An atomic condition is
in the form Ai = uij for attribute Ai , for categorical attributes, and in the
form Ai ∈ [l, u] for numeric attributes. A frequent itemset in the context of
QAM is as a condition C on a set of distinct attributes A1 , . . . , AN , where
N is the total number of attributes. C is in the form C = C1 ∧ C2 . . . ∧ CN ,
where is Ci is an atomic condition on Ai , for each i = 1, . . . N [4]. In [25]
the term pattern is used instead of condition. An association rule in the
context of QAM is an expression in the form Antecedent ⇒ Consequent,
21](https://image.slidesharecdn.com/demirizetal-121125070220-phpapp01/85/Re-Mining-Item-Associations-Methodology-and-a-Case-Study-in-Apparel-Retailing-22-320.jpg)
![where both Antecedent and Consequent are conditions. However, this type
of an output still requires aggregating the results to obtain the summary
statistics that re-mining provides. Alternatively, re-mining starts with only
the interesting rules (frequent itemsets in the case study) obtained through
Apriori, and then enriches these results with statistics computed for the
itemsets through database queries. So re-mining eliminates the computa-
tion of specific detailed rules, and computes only the interesting itemsets
and their statistics.
6.1. Complexity of Re-mining
The problem of finding the frequent itemsets (and the related association
rules), itemsets that appear in at least s percent of the transactions, is the
most fundamental analysis in association mining. The standard algorithm
for this problem is the Apriori algorithm, first proposed in [3], and then
improved in numerous succeeding studies, including [2, 15].
A new line of research approaches the frequent itemset discovery prob-
lem from a graph-theoretic perspective, achieving even further efficiency in
running times. [19] extends earlier work in [16], posing the problem as a
frequent subgraph discovery problem. The goal is finding all connected sub-
graphs that appear frequently in a large graph database. The authors report
that their algorithm scales linearly with respect to the size of the data set.
Even though new algorithms are continuously being developed with effi-
ciency increases, the reference complexity result regarding the Apriori algo-
rithm (considering its numerous variants) is that it has an upper bound of
O(|C| · |D|) and a lower bound of O(k · log(|I|/k)) on running time [1]. In
these expressions, |C| denotes the sum of sizes of candidates considered, |D|
denotes the size of the transactions database D, |I| is the number of items,
22](https://image.slidesharecdn.com/demirizetal-121125070220-phpapp01/85/Re-Mining-Item-Associations-Methodology-and-a-Case-Study-in-Apparel-Retailing-23-320.jpg)
![and k is the size of the largest set.
Now the complexity of re-mining will be analyzed following a fixed-
schema complexity perspective [25], where the set of attributes A is fixed
(with size N ) and the complexity is derived relative to the number of tuples
in the set of items I. In the presentation of the re-mining methodology,
only the itemsets of size 2 were selected. Thus the total number of frequent
itemset candidates is |I|(|I|−1)/2, and its order is O(|I|2 ). Hence |C| is also
by O(|I|2 ), and the upper bound for the running of the Apriori algorithm
is O(|I|2 · |D|). In the re-mining phase, the data is enriched with statistics
for the two-itemsets. There are N attributes for which statistics will be
computed. For each of these attributes, there will be a query that filters
the transactions with the itemset of interest, which will take O(|D|). Then
there will be the computation of the statistic, which will require a single pass
over the selected transactions for computing the mean, and two passes for
computing the standard deviation. So the upper bound for the computation
of each statistic is O(|D|2 ), and this overrides the time for the filter query.
Since there are N attributes, the running time for the computation of the
statistics is O(N · |D|2 ). When this is combined with the running time of
the Apriori, the upper bound for the whole re-mining process with k = 2 is
O(|I|2 · |D| + N · |D|2 ).
6.2. Complexity of Quantitative Association Mining
The alternative to re-mining is carrying out quantitative association min-
ing (QAM), and aggregating the results to obtain statistics for the itemsets.
The two most comprehensive studies in the literature regarding the com-
plexity of QAM are [4, 25].
The most fundamental result in both papers is that QAM is NP-complete,
23](https://image.slidesharecdn.com/demirizetal-121125070220-phpapp01/85/Re-Mining-Item-Associations-Methodology-and-a-Case-Study-in-Apparel-Retailing-24-320.jpg)
![behind positive and negative association mining and to predict the type of
associations based on attribute data. It is shown that not only categorical
attributes (e.g. category of the product), but also quantitative attributes
such as price, lifetime of the products in weeks and some derived statistics,
can be included in the study while avoiding NP-completeness.
The re-mining methodology has been demonstrated through a case study
in apparel retail industry and its practicality has been proven for the prob-
lem at hand. Descriptive, exploratory and predictive re-mining can be im-
plemented to reveal interesting patterns previously hidden in data. The case
study revealed interesting outcomes such as “negative associations are usu-
ally seen between fashion items” and “the price of an item is an important
factor for the item associations in apparel retailing.”
As a future study, re-mining can be applied for different merchandise
groups and for successive seasons, testing its robustness w.r.t. sampling
bias and temporal change, respectively. Data coming from other retailers,
with diverse characteristics, can be used for further experimental evidence.
Finally, data coming from different domains can be used for conforming the
applicability of the re-mining process in those domains.
Acknowledgement
This work is financially supported by the Turkish Scientific Research Council
under Grant TUBITAK 107M257.
[1] R. Agrawal, H. Mannila, R. Srikant, H. Toivonen, and A. Inkeri
Verkamo. Fast discovery of association rules. In U. Fayyad and et al,
editors, Advances in Knowledge Discovery and Data Mining, pages 307–
328. AAAI Press, Menlo Park, CA, 1996.
25](https://image.slidesharecdn.com/demirizetal-121125070220-phpapp01/85/Re-Mining-Item-Associations-Methodology-and-a-Case-Study-in-Apparel-Retailing-26-320.jpg)
![[2] R. Agrawal and R. Srikant. Fast algorithms for mining association
rules. In Proceedings of the 20th VLDB Conference,Santiago, Chile,
pages 487–499, 1994.
[3] Rakesh Agrawal, Tomasz Imielinski, and Arun N. Swami. Mining asso-
ciation rules between sets of items in large databases. In Peter Buneman
and Sushil Jajodia, editors, SIGMOD Conference, pages 207–216. ACM
Press, 1993.
[4] Fabrizio Angiulli, Giovambattista Ianni, and Luigi Palopoli. On the
complexity of inducing categorical and quantitative association rules.
Theoretical Computer Science, 314(1-2):217–249, February 2004.
[5] Maria-Luiza Antonie and Osmar R. Za¨
ıane. An associative classifier
based on positive and negative rules. In Gautam Das, Bing Liu, and
Philip S. Yu, editors, DMKD, pages 64–69. ACM, 2004.
[6] Yonatan Aumann and Yehuda Lindell. A statistical theory for quanti-
tative association rules. J. Intell. Inf. Syst., 20(3):255–283, 2003.
[7] Tom Brijs, Gilbert Swinnen, Koen Vanhoof, and Geert Wets. Building
an association rules framework to improve product assortment deci-
sions. Data Min. Knowl. Discov., 8(1):7–23, 2004.
[8] Ayhan Demiriz. Enhancing product recommender systems on sparse bi-
nary data. Journal of Data Mining and Knowledge Discovery, 9(2):147–
170, September 2004.
[9] Ayhan Demiriz, Ahmet Cihan, and Ufuk Kula. Analyzing price data
to determine positive and negative product associations. In Chi Leung,
26](https://image.slidesharecdn.com/demirizetal-121125070220-phpapp01/85/Re-Mining-Item-Associations-Methodology-and-a-Case-Study-in-Apparel-Retailing-27-320.jpg)
![Minho Lee, and Jonathan Chan, editors, Neural Information Process-
ing, volume 5863 of LNCS, pages 846–855. Springer, 2009.
[10] Ayhan Demiriz, Gurdal Ertek, Tankut Atan, and Ufuk Kula. Re-mining
positive and negative association mining results. In Petra Perner, ed-
itor, Advances in Data Mining. Applications and Theoretical Aspects,
volume 6171 of LNCS, pages 101–114. Springer, 2010.
[11] G¨rdal Ertek and Ayhan Demiriz. A framework for visualizing asso-
u
ciation mining results. In Albert Levi, Erkay Savas, H¨sn¨ Yenig¨n,
u u u
Selim Balcisoy, and Y¨cel Saygin, editors, ISCIS, volume 4263 of Lec-
u
ture Notes in Computer Science, pages 593–602. Springer, 2006.
[12] U. M. Fayyad, G. Piatetsky-Shapiro, and P. Smyth. From data min-
ing to knowledge discovery: An overview. In Advances in Knowledge
Discovery and Data Mining, pages 1–34, Menlo Park, CA, 1996. AAAI
Press.
[13] Jerome H. Friedman. Stochastic gradient boosting. Computational
Statistics & Data Analysis, 38(4):367 – 378, 2002.
[14] Jiawei Han and Micheline Kamber. Data Mining Concepts and Tech-
niques. Morgan Kaufmann, 2nd edition, 2006.
[15] Jiawei Han, Jian Pei, and Yiwen Yin. Mining frequent patterns without
candidate generation. In Weidong Chen, Jeffrey F. Naughton, and
Philip A. Bernstein, editors, SIGMOD Conference, pages 1–12. ACM,
2000.
[16] Akihiro Inokuchi, Takashi Washio, and Hiroshi Motoda. An apriori-
based algorithm for mining frequent substructures from graph data.
27](https://image.slidesharecdn.com/demirizetal-121125070220-phpapp01/85/Re-Mining-Item-Associations-Methodology-and-a-Case-Study-in-Apparel-Retailing-28-320.jpg)
![In Djamel A. Zighed, Henryk Jan Komorowski, and Jan M. Zytkow,
editors, PKDD, volume 1910 of Lecture Notes in Computer Science,
pages 13–23. Springer, 2000.
[17] YongSeog Kim and W. Nick Street. An intelligent system for cus-
tomer targeting: a data mining approach. Decision Support Systems,
37(2):215 – 228, 2004.
[18] Flip Korn, Alexandros Labrinidis, Yannis Kotidis, and Christos Falout-
sos. Quantifiable data mining using ratio rules. VLDB J., 8(3-4):254–
266, 2000.
[19] Michihiro Kuramochi and George Karypis. An efficient algorithm
for discovering frequent subgraphs. IEEE Trans. Knowl. Data Eng.,
16(9):1038–1051, 2004.
[20] Raymond T. Ng, Laks V. S. Lakshmanan, Jiawei Han, and Alex Pang.
Exploratory mining and pruning optimizations of constrained associa-
tions rules. In SIGMOD ’98: Proceedings of the 1998 ACM SIGMOD
international conference on Management of data, pages 13–24, New
York, NY, USA, 1998. ACM.
[21] A. Savasere, E. Omiecinski, and S.B. Navathe. Mining for strong neg-
ative associations in a large database of customer transactions. In
Proceedings of the 14th International Conference on Data Engineering,
pages 494–502, 1998.
[22] Ramakrishnan Srikant and Rakesh Agrawal. Mining quantitative as-
sociation rules in large relational tables. In H. V. Jagadish and Inder-
28](https://image.slidesharecdn.com/demirizetal-121125070220-phpapp01/85/Re-Mining-Item-Associations-Methodology-and-a-Case-Study-in-Apparel-Retailing-29-320.jpg)
![pal Singh Mumick, editors, SIGMOD Conference, pages 1–12. ACM
Press, 1996.
[23] Aixin Sun, Ee-Peng Lim, and Ying Liu. On strategies for imbalanced
text classification using svm: A comparative study. Decision Support
Systems, 48(1):191 – 201, 2009. Information product markets.
[24] Pang-Ning Tan, Vipin Kumar, and Harumi Kuno. Using sas for min-
ing indirect associations in data. In Western Users of SAS Software
Conference, 2001.
[25] Jef Wijsen and Robert Meersman. On the complexity of mining quanti-
tative association rules. Data Min. Knowl. Discov., 2(3):263–281, 1998.
[26] Bo K. Wong, Thomas A. Bodnovich, and Yakup Selvi. Neural network
applications in business: A review and analysis of the literature (1988-
1995). Decision Support Systems, 19(4):301 – 320, 1997.
[27] Yiyu Yao, Yan Zhao, and R. Brien Maguire. Explanation-oriented as-
sociation mining using a combination of unsupervised and supervised
learning algorithms. In Yang Xiang and Brahim Chaib-draa, editors,
Canadian Conference on AI, volume 2671 of Lecture Notes in Computer
Science, pages 527–531. Springer, 2003.
[28] Huimin Zhao. A multi-objective genetic programming approach to
developing pareto optimal decision trees. Decision Support Systems,
43(3):809 – 826, 2007. Integrated Decision Support.
29](https://image.slidesharecdn.com/demirizetal-121125070220-phpapp01/85/Re-Mining-Item-Associations-Methodology-and-a-Case-Study-in-Apparel-Retailing-30-320.jpg)
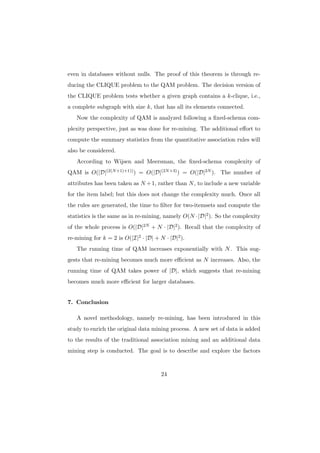
![Table 1: Classification Results
Test Set Training Set Validation Set
Accuracy Accuracy Accuracy
Model Node Rate Rate Rate
Neural Networks 0.82 0.86 0.83
Decision Tree 0.79 0.84 0.85
SVM 0.76 0.79 0.78
MBR 0.70 0.77 0.72
Gradient Boosting 0.62 0.62 0.62
AutoNeural 0.59 0.61 0.60
Figure 1: (a) Taxonomy of Items and Associations [21]; (b) Indirect Association
Table 2: Decision Tree Model: Variable Importance
Variable Number of Validation
Name Rules Importance Importance
CorrNormPrice HL 5 1.00 1.00
LifeTimeH 3 0.90 0.82
CategoryL 2 0.81 0.78
StdDevPriceL H0 L1 1 0.48 0.45
CorrWeeklySales HL 2 0.46 0.52
LifeTimeL 2 0.45 0.31
StdDevPriceH H0 L1 1 0.39 0.23
CategoryH 2 0.37 0.24
EndWeekL 2 0.33 0.32
MerchSubGrpH 1 0.23 0.18
MaxPriceH 1 0.21 0.00
AvgPriceL H1 L0 1 0.18 0.19
30](https://image.slidesharecdn.com/demirizetal-121125070220-phpapp01/85/Re-Mining-Item-Associations-Methodology-and-a-Case-Study-in-Apparel-Retailing-31-320.jpg)