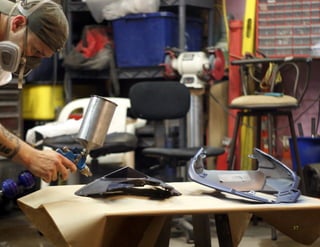
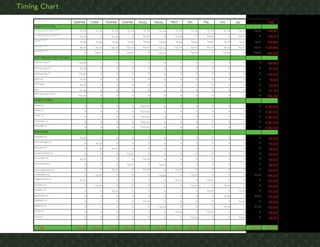
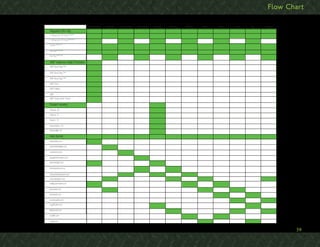
Post Stroke Upper Extremity Rehabilitation - A Clinical PerspectivePhinoj K Abraham
Guest Speak at 3rd Annual national conference of Indian Federation of Neurorehabilitation (IFNRCON 2015) at Mumbai by Phinoj K. Abraham, Neuro Occupational Therapy on "Post Stroke Upper Extremity rehabilitation - A Clinical Perspective"
For Video: http://youtu.be/uCnwdzLtPSQ
This is a simple and easy to follow powerpoint presentation I had completed for an ICT class at my college. Its purpose was to showcase a basic knowledge of a topic within our field of study, as well as, create a presentation with animation and transitions to prove understanding of how to optimize presentation effectiveness.
Brian Mulligan described novel concept of the simultaneous application of therapist applied accessory mobilizations and patient generated active movements
Demal facial fillers Market PPT: Trends and Dynamics, Drivers, Competitive la...IMARC Group
As per the latest report by IMARC Group,the global dermal facial fillers market reached a value of US$ 2.64 Billion in 2020.
Dermal facial fillers are natural or synthetic injectable solutions which aid in restoring the smooth appearance of the skin by reducing facial wrinkles and combating other signs of aging such as fine lines and spots.
Government SectorNonprofit SectorPrivate SectorLocal Lev.docxwhittemorelucilla
Government Sector
Nonprofit Sector
Private Sector
Local Level
Job 1
Job 1
Job 1
Job 2
Job 2
Job 2
National Level
Job 1
Job 1
Job 1
Job 2
Job 2
Job 2
Global Level
Job 1
Job 1
Job 1
Job 2
Job 2
Job 2
Proctor & Gamble Strategic Analysis
1
Outline
Introduction
History of P&G
SWOT Analysis
Balanced Scorecard
Communication
Marketing
PEST Analysis
Ethics
Conclusion
Outline of Power Point Presentation
2
Introduction
Looking at internal and external strategies
Developing Markets
Competitive advantage
This report provides a thorough internal as well as external analysis of P&G, identifies its mandate, along with certain strategies that would help it increase its profitability, profit growth and sustain its competitive advantage in both developed and developing markets. Although, P&G has world renowned brands, P&G needs to adopt strategies that enable it to maintain its competitive advantage over its rival.
3
History of P&G
William Procter & James Gamble were founders in 1837.
Total assets at that time:$7,192.24
William A. Procter became first president in 1890.
Ivory soap was first branded product launched in 1879.
(Procter & Gamble, 2012)
Procter & Gamble is a US Global company that provides consumer products in the areas of pharmaceuticals goods founded in 1837.P&G processes operations in more than 80 countries thanks to 300 brands on market
Procter & Gamble is a multinational corporation with more than 300 successful brands worldwide. The company is earning trust of its clients in every part of the world and famous for its steady innovations in all areas of the company. More than 4 billion people use the products of Procter & Gamble daily.
The company has offices in Johannesburg and Cape Town. P& G has its Headquarters in Ohio, US.
4
SWOT Analysis
Strengths:
Diversified brand portfolio
Research and Development
Global Operation
Strong Distribution Network
Weakness:
Online media & Leadership
Dependency
Missing Opportunity
Weakness in beauty care division
Opportunity:
Diversification
Capitalizing on online media
Environment concern
Threats:
Competition
No new innovation
Government regulation
SWOT analysis serves to summarize all of the key findings from the entire situation analysis process including important information about the company’s
internal strengths and weaknesses and important information about external opportunities and threats in the form of consumer trends, competition, and macro
environmental trends.
Strengths: include diverse portfolios, global operations, and strong distribution in which P&G uses to distribute their products and stay ahead of the competition.
Weakness: include a poor online presence, missing opportunity from lack of internet resources, and improvement needed in beauty products.
Opportunity: include P&G’s ability to reach out to ...
Personal Care Electrical Appliances Market PPT: Demand, Trends and Business O...IMARC Group
According to the latest report by IMARC Group, the global personal care electrical appliances market size reached US$ 26.1 Billion in 2020.
Personal care electrical appliances comprise plaque removers, electric toothbrushes, shavers, epilators, hair straighteners, trimmers, and dryers. These appliances assist in maintaining oral and hair care and personal hygiene of the users.
Nielsen Case Competition 2019 _ Round 2 _ Lâm Tiên KhảiKhải Tiên
This proposal conducted by @TienKhai @TamLai @NgocTran @ThuyNgan. We learned from this time that presentation is really important. It could ruin your whole efforts of 48hourse on the content decks. Yeah, a lesson!
Integrated marketing communication plan of Chevrolet Camaro.Discussion on the target audience, Communication Objective, implementation plan of advertising, Public relations use, statement, Print ad, concept story of the print ad and media objective and strategy
The complete Building An FMCG Social Brand whitepaper. This publication explores content across the three key phases of the consumer decision journey:
1) Initial Consideration – Trigger
2) Active Evaluation – Information Gathering, Shopping and Buying
3) Post Purchase Experience and Advocacy
1
Running Header: Monster Beverage Corporation 3
Contents
Executive Summary 3
1.0 Organization Background 4
1.1 Product profile 5
2.0 Industry Analysis 5
2.1 Size 5
2.2 Environmental influence 6
2.3 Trends 6
3.0 Competitive analysis 6
3.1 Market approach 6
3.2 Customer evaluation 7
4.0 Financial analysis 8
5.0 SWOT Analysis 9
5.1 Strengths 9
5.2 Weaknesses 10
5.3 Opportunities 10
5.4 Threats 11
6.0 Strategic Objectives 11
6.1 Short term growth goals 11
6.2 Long term growth goals 12
6.3 Communication objectives 13
7.0 Strategies 14
7.1 Use of Quick Response codes Advertisement 14
7.2 Use of Print Advertisement 15
8.0 Strategies Implementation 16
9.0 Review and Evaluation Strategies 17
Reference 18
Executive Summary
This is a company analysis project that examines the company profile of the Monster
Energy Company. The Monster energy drink brand is the second largest seller of energy
drinks in the world with Monster Energy, Java Energy, Rehab, and Killer Flavor as their leading
brands. The continued desire of Monster Energy to dominate the world energy drink market is
driven by their continued effort to unleash new energy in the teens and the youths. Monster
Energy has targeted advertisements to the 18 to 26-year male consumer group. This has
seen Monster Energy control over 27.9% of the energy drink market in just over half a decade
since Hansen Beverage Corporation introduced it to the world.
Attributed to its growth is its competitive ability in market approach and diverse product development that increase and presents the initiating flavors of the drink in the market. The firm has developed a great team of experts and continues to grow the great relationship with its customer who offers great and new opportunities to the attainment of the monster energy brand short and long term goals. Monster Energy uses short, targeted advertisements to attract their young users and keep them engaged on their product. In this regard, the paper provides the organizational background, industry analysis, competitive analysis, financial analysis, a detailed SWOT Analysis, strategic objectives, strategies, strategies implementation, plan, review and evaluation strategies. This evaluation of the monster energy brand culminates in realizing the firm's objectives.
Strategic Plan Monster Beverage Corporation1.0 Organization Background
Monster Beverage Corporation is a subsidiary company of the Hansen Natural Corporation. It produces 34 different energy drinks Monster Energy, Java energy, Rehab, and Killer flavor as the leading brands. The monster energy drinks was introduced in April 2002 to the American market becoming the leading brand in America and second leading brand in the world (Hansen’s Natural Corporation). The energy brand comes with a natural black flavor that is characterized with a neon green claw that forms the letter M as its logo. The caffeine content of most Monster Energy drinks is approximately 10 ...
12. Industry Overview
The energy drink craze began in 1995 when PepsiCo released the first nationally
branded energy drink Josta. Since then more than 500 different energy drinks have
entered the market worldwide.
In 2001 the energy drink market totaled $8 million in annual sales, by 2008 sales had
grown to $5.7 billion and by 2011 the industry is expected to be worth $18 billion.
Energy drinks are made with natural stimulants that provide the user with a burst of
energy. Most energy drinks on the market use ingredients such as caffeine, herbal
extract such as guarana, ginseng, and ginkgo bloba, B vitamins, amino acids such as
taurine, amino acid derivatives such as camitine and sugar derivatives.
Strategic Challenge
AMP’s current need is to differentiate itself from its competitors Red Bull and Monster.
Red Bull, Monster, and AMP have similar marketing strategies such as sponsoring
events and extreme athletes. All three brands are targeting the same audience.
Red Bull, Monster, and AMP may have the same market strategies however each
brand has a vastly different media budget. Of the three brands, Red Bull has spent
the largest amount of money, $51.3 million on media placement and sponsorships in
2008. AMP followed spending $18.3 million on media placement. Monster spent the
least amount on media placement at only $1.3 million. Monster devoted the majority
of its budget on event sponsorships and aggressive retail distribution.
14. Current Market
AMP’s current target audience is males between the ages 13 and 34. These men have
an average household income between $10,000-$20,000. They participate in or
are fans of, extreme activities such as motocross or bmx biking and they live on the
edge.
Creative History
AMP’s current market strategy focuses on NASCAR enthusiasts by creating
advertisements and promotions with Dale Ernheart Jr as the spokesperson.
In the last two years, AMP has spent $30 million on advertising and promotions.
Most recently, they have focused on event sponsorships for extreme sports like
snowboarding and NASCAR as well having strategic heavy national distribution.
16. Objectives
AMP must distinguish itself from its competitors, Monster and Red Bull.
Quantifiable Goal: Over the next 12 months AMP wishes to raise brand awareness
by 10%.
Behavioral Goal: Over the next 12 months AMP wishes to raise brand awareness
within the AMP Man Market Segmentation.
18. Future Energy Drink Market Segment
Target Audience: THE AMP MAN
User Profile: The 2009 AMP man is between the ages 18-34. He is employed either
part time or full time and has an annual household income ranging from $20,000 -
$75,000. He is educated and has graduated from college, a technical institute or is
currently in the process of getting a degree. MRI data confirms these characteristics
with high index numbers.
The AMP man is a hands-on learner. He enjoys participating in group activities and has
a competitive spirit. The AMP man has a hectic schedule. This busy schedule leaves
him completely drained at the end of the day. MRI data suggests that the AMP
man is under a great deal of stress. He needs an energy drink that will boost
his energy as well as help him focus so he is able to get the job done.
Market Segments: The AMP Man can be broken into two different market segments:
The AMP Tech Student and The AMP Professional.
20. Market Segment: AMP TECH STUDENT
Demographics
The AMP Tech student is male between the ages 18-24. He is a college student
and has a part time job.
He is currently going to the Universal Technical Institute (UTI), Motorcycle Mechanic
Institute (MMI), or NASCAR Tech and lives on or near the campus. UTI, MMI, and
NASCAR Tech campuses are located in California, Arizona, Texas, Illinois, Florida,
or North Carolina.
Motivations
Career: These men are pursuing a career in the auto mechanic field. They are
specifically interested in the mechanics behind extreme sports such as motorcycle
racing and NASCAR
Motorcycles: MRI data shows that these men frequently own or have recently
purchased a new or used motorcycle for recreational purposes.
Hands On: AMP Tech Students are hands on; they do their own auto maintenance.
MRI data shows high index numbers for AMP drinkers who have purchased
maintenance materials for their vehicles such as oil filters, tires, sprockets etc.
Claritas PRIZM Lifestyle Analysis Reports: Market Potential Map of the Food and
Beverages: Energy Drink shows high index numbers of occupants who live on the West
Coast
22. Market Segment: AMP TECH STUDENT
Preferences
Internet: These men use the Internet a few times a day and uses auto tech websites
such as alldatapro.com.
Television: When relaxing they watch cable programs like FX & Comedy Central.
Auto Magazines: The AMP Tech Student is always trying to better his trade. They
read magazines such as 4 Wheel Off Road, Hot Rod, Road & Track, and Trucking.
Radio: When they are working in the garage they listen to alternative rock radio
stations like Arrow 93.1, The Best Classic Rock Channel, and Howard 93.7
Challenges
Stress: The 2009 Tech Student is stressed out from balancing work, school and
recreational activities. His hectic schedule sometimes leads to anxiety; MRI data
shows high numbers for AMP drinkers who have experienced anxiety within the last
30 days.
Sleep Deprivation: Not only is the AMP Tech Student overwhelmed, he is sleep
deprived. A recent survey of Energy Drink Consumption Patterns Among College
Students by Nutrition Journal, found the majority of college students drink energy
drinks because of lack of sleep. 67% of respondents confirmed that the primary
reason they drink energy drinks is because they are sleep deprived.
Short Attention Span: The AMP Tech Student may have trouble focusing due to a
short attention span. MRI data shows high index numbers for AMP drinkers who have
been diagnosed with ADD or ADHD as well as high index numbers for those who
have treated ADD or ADHD with herbal or home remedies.
24. Market Segment: AMP PROFESSIONAL
Demographics
The AMP Professional is Male between the ages 25-34 with an annual household
income between $50,000 - $70,000. He owns his own home and lives on the West
Coast. The AMP Professional is currently in the nesting period of his life. MRI data
shows high index numbers for energy drink drinkers who are newlywed, in a serious
relationship or have recently had a baby.
He has chosen a profession where he can use his hands and be active. He is
employeed in the mechanical or construction industry.
Motivations
Career Advancement: The AMP Professional is college educated and has chosen
a career that requires him to use his hands such as working in the construction
or maintenance industry. He enjoys his job and is motivated by the opportunity
to advance within his field. MRI data confirms that he is college educated and is
motivated by his job with high index numbers.
Building a Home: He has a monthly mortgage and works hard to ensure a comfortable
life style for himself and his family. He is always working on home projects such as
remodeling the basement or fixing his car. MRI data shows high index numbers for
purchases made by energy drink drinkers from hardware and auto stores.
Claritas PRIZM Lifestyle Analysis Reports: Market Potential Map of the Food and Beverages: Energy
Drink shows high index numbers of occupants who live on the West Coast
26. Market Segment: AMP PROFESSIONAL
Preferences
TV: He enjoys watching extreme sports on TV as well as watching shows such as
West Coast Choppers on TLC. He also rates Discovery channels number one in
entertainment value, bold new ideas, orginal series and high quality.
Auto Magazines: The AMP Professional keeps up on his trade by reading auto
magaizines such as 4 Wheeler and Off Road and Hot Rod Magazine. MRI data shows
that AMP Professionals read these periodicals.
Internet: The AMP Professional uses professional websites like Alldata.com daily.
Challenges
Getting Older: He is getting older and settling down. He is no longer able to
participate in the extreme recreational activities of his youth.
New Home: The AMP Professional is a first time homeowner. When the work week
ends, the AMP Professional heads home to begin a weekend full of remodeling and
home maintanence, leaving him no time to relax.
30. Promotion Kick Off
To kick off the campaign AMP Student Street Teams will flood the campuses of UTI,
MMI, and NASCAR Tech on the first day of classes. The Amp student street teams
will be handing out cans of AMP, AMP pens, AMP Notebooks, and AMP school
bags.
To show the AMP Tech Students that AMP understands how stressful school can
be the AMP Student Street Team will distribute cans of AMP to all campuses during
midterms and finals for the whole year.
Not only will the AMP Student Street Team fuel the student’s energy, they will also
offer tutoring services during midterms and finals.
Since UTI, MMI, and NASCAR tech have classes year round, the AMP Student Street Teams will run the promotions year round.
32. Web Banners
MRI data shows us that the AMP Tech Student is online a few times a day. According
to quantcast.com, AMP Tech Students frequently access sites such as alldatapro.
com, library.alldatatpro.com, and autozonepro.com.
We will run web banner ads on these three web sites during the 12-month period.
Print Ads
Both The AMP Professional and AMP Tech Student read specific trade magazines.
According to MRI data the AMP Man reads magazines such as 4 Wheeler and Off
Road, Trucking and Hot Rod Magazine.
We will run print ads on the back cover of Hot Rod and 4 Wheeler and Off Road.
34. AMP Branded Experience
The AMP branded experience will be co-branded with TLC. TLC will televise the
students from the moment they enter the house up until the moment they leave.
The show will air in January on Thursday nights at 8pm. TLC will be the perfect
channel to air the AMP Branded Experience because TLC is a network for men and
women who have outgrown the antics of MTV but are not quite ready for A&E. TLC
demographics are consistent with the demographics of the AMP Professional as well
as the AMP Tech Students. TLC currently airs shows such as American Chopper,
BBQ Pit Masters, LA Ink and Street Customs, shows that are currently watched by
our target audience.
The AMP Branded Experience has two parts.
36. PHASE ONE: Targeted at the AMP Tech Student,
AMP will purchase five homes: House #1: Near UTI campus in Sacramento CA, House
#2: Near UTI campus in Houston Texas. House #3: Near MMI campus in Phoenix
Arizona, House #4: Near MMI campus in Orlando Florida House #5: Near NASCAR
Tech in Mooresville North Carolina
Each of the five homes will be completely revamped into the total AMP experience.
Every room in the AMP home will be inspired by a different AMP flavor. Each location
will either have a state of the art garage attached or near by. The AMP garage will be
equipped with everything needed to run an auto shop. This will be a very functional
garage.
PHASE TWO: targeted at the AMP Tech Student and AMP Professional
MMI, UTI, and NASCAR TECH students will be given the opportunity to live in the
AMP house. Only students who are over the age of 21 and whose GPA is over a 3.0
will be allowed to participate. There will be an application process where students
will have to fill out the proper forms and provide recommendations from teachers or
employers. 25 lucky students will be given an opportunity to move into the houses.
In order to stay in the AMP house the students will have to maintain a 3.0 GPA as
well as generate an income and fan basis using the AMP shop. The students living in
the AMP house will be given full access to the AMP garage and they will be expected
to create a shop that involves their specific trade.
At the end of the quarter (12 weeks) each house will be judged by the following
criteria
1. Total amount of sales made at AMP shop
2. House GPA and teacher comments
3. Viewer fan votes
The house with the highest total will win $1.5 million dollars ($300,000 each) to
invest in a shop when they graduate.
45. More Than Cardboard
Client: People Serving People
- Media Strategy: Erin Mulligan -
- Project Manager: Melody Vitzthum -
- Art Director: Jennifer Hulst -
- Copywriter: Michelle Karch -
Photography by Erin Leigh Mulligan
46.
47. Table of Contents
Brand History.......................................................................... 48
Challenges.............................................................................. 50
Target Audience...................................................................... 52
Objectives.............................................................................. 54
The Big Idea............................................................................ 56
Logo Redesign......................................................................... 58
Print Media: Pully.................................................................... 60
Print Media: Wheel................................................................. 62
Out Of Home Media: Billboards............................................. 64
Out Of Home Media: Mural................................................... . 66
Micro-site................................................................................ 68
Timing/Budget......................................................................... 70
Flow Chart............................................................................... 71
Work Cited ............................................................................. 72
47
48. Brand History
People Serving People, a homeless shelter in Minneapolis first opened its doors in 1982.
It was originally a temporary shelter for chemically dependent or mentally unstable
homeless men. In 1987 People Serving People started to shelter families and children. In
the ‘90s they created more beneficial programs for the growing homeless population
In 2002, to accommodate the needs of the homeless families seeking out shelter, PSP
moved into a new building in downtown Minneapolis. The building is a 10 floor space
featuring a full-service dinning hall, childhood development center, medical center,
technology and library center, 99 emergency housing units and 10 two bedroom apartments
reserved for long term guests. People Serving People also added new collaborative
programs that offer help on building family advocacy and workforce development.
Homeless Minnesota Stats
The number of homeless families with children
increased 27 percent for 1,318 in 2006 to 1,670 in
2009
Children, youth and young adults 21 and younger make
up 45% of total homeless people in Minnesota
Out of 9,000 homeless individuals 7,000 are fortunate
enough to receive shelter
50. Challenges
The external forces facing the homeless community and People Serving People are the
economy, politics, and technology.
Economy: As unemployment, poverty and high foreclosure rates continue to increase
in the Twin Cities, it brings new struggles for both People Serving People and the
homeless community. For the last twenty years unemployment rates in Minnesota
have ranged between 3 and 5 percent. Since the recent recession the unemployment
rates has reached 7 percent. Foreclosures in Minnesota jumped from 20,00 in 2007
to 26,265 in 2008. This has increased the demand for public assistance like People
Serving People.
Politics: In 2008 Governor Tim Pawlenty passed a law regarding un-allotted funding for
General Assistance Medical Care. This put an estimated 30,000 low income Minnesotans
at risk for not receiving disability or Medicare and Medical Assistance.
Technology: As society turns more tech savvy the daily tasks of paying bills and looking
for jobs are moving primarily to the Internet. This has made it difficult for low-income
or at risk homeless Minnesotans to access these services. Having a computer and
Internet access is becoming a necessity rather than a luxury.
The economy, politics, and technology have lead to the decrease of donations to People
Serving People. The main challenge this campaign is trying to solve is the lack of
donations, time, and money, to People Serving People.
52. Target Audience
The target audience we are focusing on is the Millennial Moms.
Overview: These women are 25-35, married with young children and they own their
households. They are primarily caucasian and living in the suburbs of Minneapolis and
St Paul. Millennial Moms possess a college education and works in a professional
job setting. They are motivated by the ability to multitask, build communities, and
live goal-oriented lifestyles. They are well versed in technology and keep up by using
blogs and social medias.
Key Insight: The key-insight to Millennial Moms is they value word of mouth via social
networking, blogs, and technology. They use social medias to gain knowledge and
keep up-to-date with the community.
54. Objectives
Quantifiable : In the course of one year to:
Raise $61,000 (26% increase) in non-corporate donations.
According to the Ten Year Plan to End Homelessness in Minneapolis and Hennepin
County, it costs approximately $900 a month to house a family in supportive housing,
the increase donation would in turn house approximately 65 families.
Increase the number of volunteer hours by 18,000.
Last year, volunteers served 29,000 hours. The increase for an extra 18,000 would fill
all open shifts needed at People Serving People.
Behavioral : In the course of one year to:
Gain awareness of People Serving People and the programs offered.
People Serving People is not listed on the Hennepin County website as a resource for
those in need. The estimated 2.6k visitors to the People Serving People website is small
in comparison to the 4.2k visitors to Hope Street Shelter site (another homeless shelter
in Minneapolis) and the 370k to the Salvation Army.
56. Big Idea
Message: By donating your time and money to People Serving People, you are helping
the homeless while bettering your Twin Cities community.
Rationale: The target audience thrives on building community and this is a simple,
relevant way for them to be involved. It gives the audience an opportunity to make
a positive impact on their Twin Cities community and helps people at the same time.
It takes it beyond asking for money; it shows them it will help the community as a
whole.
Concept: Using cardboard signs to display the positive effect your donation to People
Serving People will have.
Rationale: The cardboard signs are an easily recognizable symbol of the homeless.
Placing a more uplifting and hopeful message of cardboard signs will connect better with
the target audience and show them the posititve impact their donations will have on the
homeless community.
58. Logo Redesign
We decided to redesign the logo to something more simplistic that would be able to
work across multiple platforms. We chose to add the image of people holding hand to
symbolize the connections that are made in the community thanks to People Serving
People. We changed the tagline to Helping Families Find Community, to emphasize that
People Serving People does more than temporarily help the homeless.
60. Print Media
Print media will be placed in Minneapolis St Paul Magazine, Minnesota Monthly, and
Family Ties. The print media is focused on local magazines in Minneapolis area that
feature articles about family connections, growing community and community.
Pully
This execution is an interactive print layout that allows the audience to have the ability
to make the change. By pulling the tab from one word to the next, the audience will
see the positive effect their donation can make. This is then followed by body copy that
explains in depth the programs offered at People Serving People.
62. Print Media
Wheel
This execution is another interactive layout that allows the audience to see the cause
and effect their donation creates at People Serving People. By rotating the wheel from
one word to the next the audience will see the positive effect their donation can make.
The body re-enforces the cycle created by the story that is told by the wheel.
64. Out Of Home Media
Billboards will be placed along freeways, traveling in and out of the Twin Cities. We have
chosen Interstate 94, 394 and 35W. These women are business professionals and use
the freeway to commute into the city, making this a beneficial area to gain awareness.
Billboards: The three billboards are read in succession, HOMELESS, DONATE, HELP
THEM FIND COMMUNITY. This shows the positive effect their donations can have on
the homeless community.
66. Murals
Murals will be painted along building of Nicollet Mall. Again, to focus on a high-traffic
street in Minneapolis, where many working professionals travel during business hours.
Murals: The Murals are to show where the homeless used to exist but feature a
message of how they received help at People Serving People.
68. Micro-site
Millennial Moms use blogs and social media on a daily basis. They find their information
and stay connected through the web.
Micro-Site: This execution will be used to connect the audience to People Serving
People by presenting information about events, programs, and success stories of People
Serving People. The site also answers questions regarding donating and the progress of
People Serving People participants.
72. Work Cited
1. “History: People Serving People. ”. People Serving People 2008. PSP, Web January 2010. www.peopleservingpeople.org/
about/history.php
2. Boston, David. “Poverty Rates in Minnesota: Poor Residents in Inner Cities and Rural Areas Hit Hardest.” Suite 101. 20 July
2008. Suite 101. 24 Jan 2010. <http://poverty.suite101.com/article.cfm/poverty_in_minnesota>.
3. ECN. “2008 Foreclosure Rate in Minnesota”. Minnesota Home Ownership Center. 5 March 2009. Minnesota Home Ownership Center.
24 Jan 2010. http://hocmn.blogspot.com/2009/03/2008-foreclosure-rates-in-minnesota.html
4. Devorak, Petula. “On D.C. Streets, the Cell phone as Lifeline”. The Washington Post. 23 March 2009. The Washington Post Company.
23 January 2010. <http://www.washingtonpost.com/wpdyn/content/article/2009/03/22/AR2009032201835. html
5. .”White Picket Fences.” My Best Segments. 2008. Nielsen, Web. 15 Jan 2010. http://www.claritas.com/MyBestSegments/Con
tent/tabs/filterMenuFrameWork.jsp?page=../Segments/snapshot.jsp&menuid=91&submenuid=911
6. “Millennial Moms 101” Mr.Youth Mr Youth, web. January 2010. http://www.mryouth.com/#HowWeSeeIt
7. “People Serving People 2008 Annual Report”. People Serving People 2008. PSP, Web January 2010. http://www.peopleservingpeople.
org/news/annual_report.php
8. ”Salvation Army-Quantified.” Quantcast. 2009. QuantCast, Web. 15 Jan 2010. http://www.quantcast.com/salvationarmyusa.org
9. Hennepin County and City of Minneapolis Commission to End Homelessness. The Ten-Year Plan to End Homelessness in Minneapolis
and Hennepin County. Minneapolis: Hennepin Co. 2006