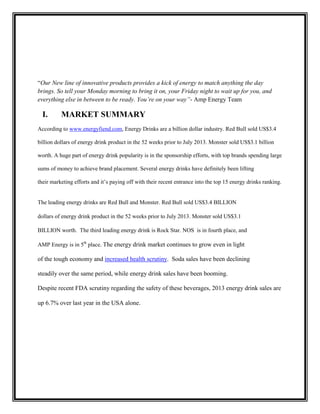
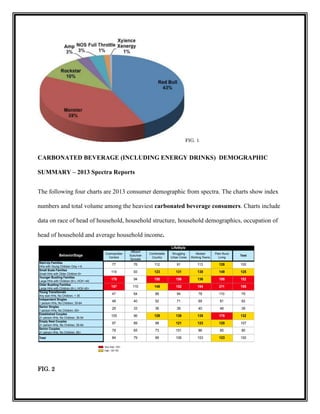
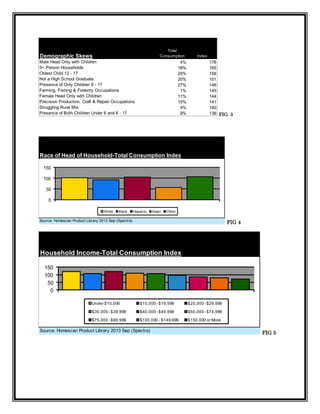
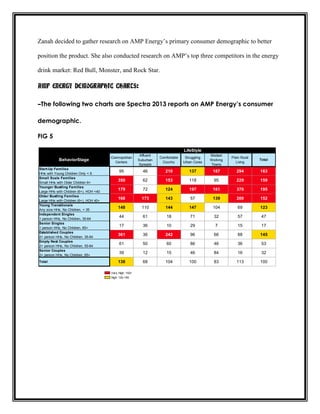
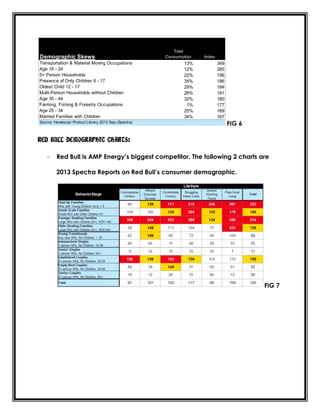
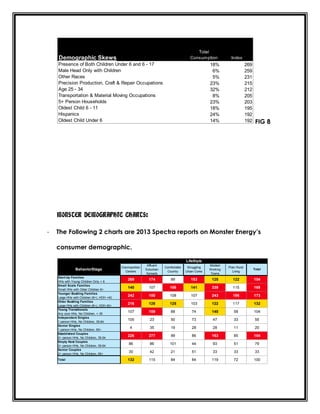
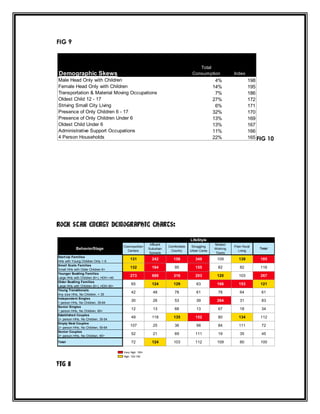
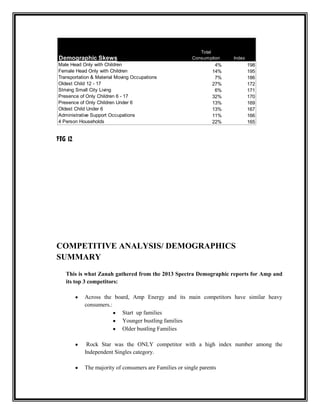
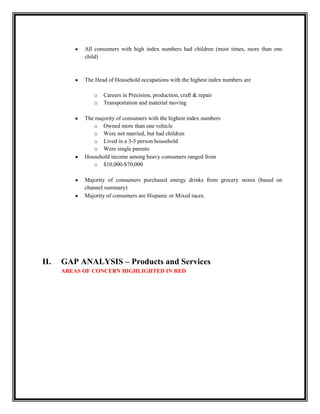
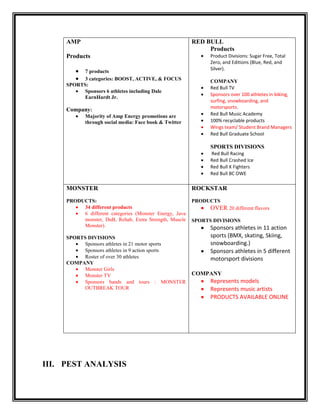
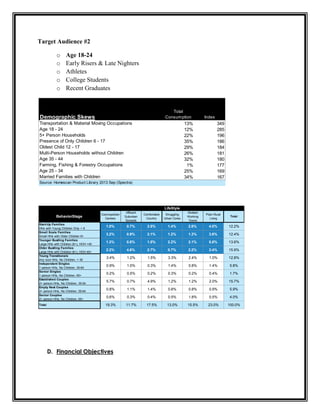
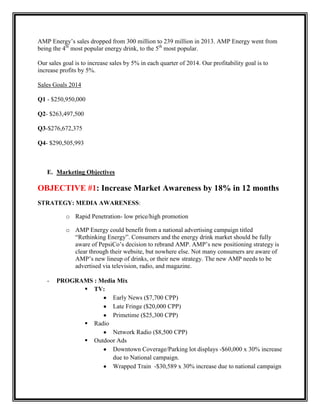
AMP ENERGY
Case Study Analysis
Product Positioning

Zanah Thirus
11/24/13
Columbia College Chicago
The positioning decision:
The AMP Energy team had completely revamped AMP’s brand. After falling behind NOS, and
Rock Star in sales over the last year, it was apparent that something had to be done. AMP has
Eliminated all 15 of its well-known drinks, and created a new line of three innovative products.
Amps new product line consists of Amp Boost, Amp Focus, and Amp Active.
Amp Focus
o Keep your head on track. Even when everything else isn't. Give your day a boost
with AMP Energy Focus, with Caffeine + Choline + Theanine. And be ready to
shrug it off anytime someone asks to "borrow you for a second."

Amp Boost
o Elevate your energy with a 16-Ounce can of "Get it done." AMP Energy Boost,
with Caffeine and B-Vitamins, gives you the kick you need to tackle the early
morning meeting. And that 3-hour working lunch. And don’t forget your kid's
after-school recital. Now, get out there and make us proud.
Amp Active
o This ain't no ordinary lemonade drink. It's got caffeine and electrolytes †. Like
you, it's a full-on multi-tasking, no-friend-of-fatigue dynamo. AMP Energy Active
hydrates and helps you power through the day. Seriously, it's no sweat.
“Our New line of innovative products provides a kick of energy to match anything the day
brings. So tell your Monday morning to bring it on, your Friday night to wait up for you, and
everything else in between to be ready. You’re on your way”- Amp Energy Team
With the new brand strategy in mind, the AMP marketing team began to generate ideas for an
upcoming national media campaign. Although AMP’s new and improved brand seemed like the
answer to many problems, the AMP team was still struggling with positioning. Zanah, AMP’s
marketing manager, was split between the opinions of the staff.

Amp’s sales director, Harry, believed that AMP should be positioned against the leading
competitive energy drink brands. “Our new line up of products is better than Red Bull, Rock
Star, and Monster when it comes to providing energy. We need to emphasize this through our
extreme sports athletes, and show the market how they use our drinks to fuel their game!”

Amp’s brand manager, Rachel, thought otherwise. “We need to position AMP as a unique brand.
We don’t need to focus our marketing efforts on making our brand like our competitors, because
we offer something that they can’t. Our new line up of drinks helps fuel every day passions. Red
Bull and Monster focus on extreme sports athletes, we need to focus on the everyday consumer.”

The decision was up to Zanah. Should AMP be positioned against its competitors (better,
stronger, cheaper)? Or should AMP be positioned to emphasize the uniqueness of the products
(offering something completely new and innovative)?
History of Amp: A PepsiCo Brand
Amp Energy is the energy drink version of Mountain Dew, created by PepsiCo, and
released in 2001. AMP Energy is the premier energy brand of Purchase, N.Y.-based Pepsi-Cola
North America Beverages (PCNAB). With its energizing blend of B-vitamins and a specially
formulated intense combination of taurine, ginseng, and guarana, AMP Energy provides the
power needed to tackle everything in life, day or night. PCNAB is a division of PepsiCo, which
offers the world's largest portfolio of billion-dollar food and beverage brands
Amp Energy was launched by PepsiCo in 2001. PepsiCo is one of the world’s leading
food and beverage companies with over 65 billion in net revenue in 2012. Pepsi Co has a global
portfolio of diverse and beloved brands including Pepsi, Gatorade, Lays, Amp, and Quaker.
Pepsi Co employs over 250,000 employees in 200 countries across the globe, and the reported
revenue growth in the beverage division was 4.5% in 2012. According to Pepsi Co’s website,
80% of the current executive team was promoted from within. The company headquarters is
located in Purchase, NY. The current CEO is Indra Nooyi. Pepsi Co Brands are organized into
the four global business units:
Pepsi Co American Foods
Pepsi Co American Beverages (Including Amp)
Pepsi Co Europe
Pepsi Co Asia, Middle East, and Africa (AMEA)
According to Pepsi Co’s 2012 annual report, the company objectives include:
Building and retaining top talent
To focus on driving cost savings and other productivity enhancements derived from our
complimentary food and beverage portfolio.
Reinforce our existing value drivers (refocusing efforts on most popular global brands).
PepsiCo’s original strategy for Amp was to position it to compete with leading energy drink
brands like Red Bull and Monster.

PepsiCo repositions AMP:
In 2008, AMP was America’s 4th most popular Energy drink (behind Red Bull and
Monster). That year, PepsiCo decided to “amp up” Amp’s media budget and positioning
strategy. PepsiCo launched a massive campaign starring Nascar driver dale Earnheardt Jr., three
new flavors, a high profile summer promotion, and a slew of packaging variations. This was all
in an attempt to increase Amp’s presence in the Energy Drink market, and to compete with the
leading brands, Red Bull and Monster.
Since the major campaign in 2008, Sales for Amp have taken a major drop. In the last
year, PepsiCo’s CSD dollar sales have declined 1.4% amounting to “The Worst performance of
PepsiCo in over a year”, according to Wells Fargo’s senior analyst, Bonnie Herzog.
Amp is now sitting below Rockstar, NOS, and Starbucks Double Shot. Those three
brands are sitting below Red Bull, and Monster. Something had to be done. This year, PepsiCo
decided to rebrand and reposition Amp Energy. PepsiCo eliminated all 15 of Amps categories
and created a product line of 3 with all new formulations and designs.
“Our New line of innovative products provides a kick of energy to match anything the day
brings. So tell your Monday morning to bring it on, your Friday night to wait up for you, and
everything else in between to be ready. You’re on your way”- Amp Energy Team

I.

MARKET SUMMARY

According to www.energyfiend.com, Energy Drinks are a billion dollar industry. Red Bull sold US$3.4
billion dollars of energy drink product in the 52 weeks prior to July 2013. Monster sold US$3.1 billion
worth. A huge part of energy drink popularity is in the sponsorship efforts, with top brands spending large
sums of money to achieve brand placement. Several energy drinks have definitely been lifting
their marketing efforts and it’s paying off with their recent entrance into the top 15 energy drinks ranking.

The leading energy drinks are Red Bull and Monster. Red Bull sold US$3.4 BILLION
dollars of energy drink product in the 52 weeks prior to July 2013. Monster sold US$3.1
BILLION worth. The third leading energy drink is Rock Star. NOS is in fourth place, and
AMP Energy is in 5th place. The energy drink market continues to grow even in light

of the tough economy and increased health scrutiny. Soda sales have been declining
steadily over the same period, while energy drink sales have been booming.
Despite recent FDA scrutiny regarding the safety of these beverages, 2013 energy drink sales are
up 6.7% over last year in the USA alone.
FIG. 1

CARBONATED BEVERAGE (INCLUDING ENERGY DRINKS) DEMOGRAPHIC
SUMMARY – 2013 Spectra Reports
The following four charts are 2013 consumer demographic from spectra. The charts show index
numbers and total volume among the heaviest carbonated beverage consumers. Charts include
data on race of head of household, household structure, household demographics, occupation of
head of household and average household income.
LifeStyle
BehaviorStage
Start-Up Families
HHs with Young Children Only < 6
Small Scale Families
Small HHs with Older Children 6+
Younger Bustling Families
Large HHs with Children (6+), HOH <40
Older Bustling Families
Large HHs with Children (6+), HOH 40+
Young Transitionals
Any size HHs, No Children, < 35
Independent Singles
1 person HHs, No Children, 35-64
Senior Singles
1 person HHs, No Children, 65+
Established Couples
2+ person HHs, No Children, 35-54
Empty Nest Couples
2+ person HHs, No Children, 55-64
Senior Couples
2+ person HHs, No Children, 65+
Total

Cosmopolitan
Centers

Affluent
Suburban
Spreads

Comfortable
Country

77

76

114

93

176
157
47
48

Modest
Working Towns

Plain Rural
Living

Total

112

91

113

128

100

123

131

138

149

125

94

150

156

136

195

152

110

145

152

184

211

155

64

88

94

78

110

79

40

52

71

69

81

62

29

33

36

39

40

46

39

105

96

129

138

135

176

132

97

89

98

121

123

120

107

78

65

73

101

86

85

80

84

79

99

106

103

123

100

Very High: 150+
High: 120-150

FIG. 2

Struggling
Urban Cores
Total
Consumption

Demographic Skews
Male Head Only with Children
5+ Person Households
Oldest Child 12 - 17
Not a High School Graduate
Presence of Only Children 6 - 17
Farming, Fishing & Forestry Occupations
Female Head Only with Children
Precision Production, Craft & Repair Occupations
Struggling Rural Mix
Presence of Both Children Under 6 and 6 - 17

4%
18%
25%
20%
27%
1%
11%
15%
4%
9%

Index

178
165
158
151
146
145
144
141
140
138 FIG. 3

Race of Head of Household-Total Consumption Index
150
100
50

0
White

Black

Hispanic

Asian

Other

FIG 4

Source: Homescan Product Library 2013 Sep (Spectra)

Household Income-Total Consumption Index
150
100
50
0
Under $10,000

$10,000 - $19,999

$20,000 - $29,999

$30,000 - $39,999

$40,000 - $49,999

$50,000 - $74,999

$75,000 - $99,999

$100,000 - $149,999

$150,000 or More

Source: Homescan Product Library 2013 Sep (Spectra)

FIG 5
Zanah decided to gather research on AMP Energy’s primary consumer demographic to better
position the product. She also conducted research on AMP’s top three competitors in the energy
drink market: Red Bull, Monster, and Rock Star.
AMP ENERGY DEMOGRAPHIC CHARTS:
-The following two charts are Spectra 2013 reports on AMP Energy’s consumer
demographic.
FIG 5
LifeStyle
BehaviorStage
Start-Up Families
HHs with Young Children Only < 6
Small Scale Families
Small HHs with Older Children 6+
Younger Bustling Families
Large HHs with Children (6+), HOH <40
Older Bustling Families
Large HHs with Children (6+), HOH 40+
Young Transitionals
Any size HHs, No Children, < 35
Independent Singles
1 person HHs, No Children, 35-64
Senior Singles
1 person HHs, No Children, 65+
Established Couples
2+ person HHs, No Children, 35-54
Empty Nest Couples
2+ person HHs, No Children, 55-64
Senior Couples
2+ person HHs, No Children, 65+
Total

Cosmopolitan
Centers

Affluent
Suburban
Spreads

Comfortable
Country

Struggling
Urban Cores

Modest
Working
Towns

Plain Rural
Living

Total

95

46

210

137

187

294

163

350

62

153

118

95

229

159

179

72

124

197

161

370

195

168

173

143

57

139

200

152

148

110

144

147

104

69

123

44

61

18

71

32

57

47

17

36

10

29

7

15

17

361

36

242

96

66

88

145

61

50

60

86

46

36

53

39

12

15

46

84

16

32

138

68

104

100

83

113

100

Very High: 150+
High: 120-150
Demographic Skews
Transportation & Material Moving Occupations
Age 18 - 24
5+ Person Households
Presence of Only Children 6 - 17
Oldest Child 12 - 17
Multi-Person Households without Children
Age 35 - 44
Farming, Fishing & Forestry Occupations
Age 25 - 34
Married Families with Children
Source: Homescan Product Library 2013 Sep (Spectra)

Total
Consumption

13%
12%
22%
35%
29%
26%
32%
1%
25%
34%

Index

349
285
196
186
184
181
180
177
169
167

FIG 6

RED BULL DEMOGRAPHIC CHARTS:
-

Red Bull is AMP Energy’s biggest competitor. The following 2 charts are
2013 Spectra Reports on Red Bull’s consumer demographic.

FIG 7
Total
Consumption

Demographic Skews
Presence of Both Children Under 6 and 6 - 17
Male Head Only with Children
Other Races
Precision Production, Craft & Repair Occupations
Age 25 - 34
Transportation & Material Moving Occupations
5+ Person Households
Oldest Child 6 - 11
Hispanics
Oldest Child Under 6

Index

18%
6%
5%
23%
32%
8%
23%
18%
24%
14%

269
259
231
215
212
205
203
195
192
192

FIG 8

MONSTER DEMOGRAPHIC CHARTS:
-

The Following 2 charts are 2013 Spectra reports on Monster Energy’s
consumer demographic.
LifeStyle
BehaviorStage
Start-Up Families
HHs with Young Children Only < 6
Small Scale Families
Small HHs with Older Children 6+
Younger Bustling Families
Large HHs with Children (6+), HOH <40
Older Bustling Families
Large HHs with Children (6+), HOH 40+
Young Transitionals
Any size HHs, No Children, < 35
Independent Singles
1 person HHs, No Children, 35-64
Senior Singles
1 person HHs, No Children, 65+
Established Couples
2+ person HHs, No Children, 35-54
Empty Nest Couples
2+ person HHs, No Children, 55-64
Senior Couples
2+ person HHs, No Children, 65+
Total

Cosmopolitan
Centers

Affluent
Suburban
Spreads

Comfortable
Country

Struggling
Urban Cores

Modest
Working
Towns

Plain Rural
Living

Total

269

174

99

153

125

122

154

140

107

166

141

339

115

169

242

150

108

107

243

195

173

216

126

125

103

122

117

132

107

159

88

74

140

58

104

105

23

50

73

47

33

55

4

35

19

28

28

11

20

226

277

99

86

163

85

154

86

86

101

44

93

51

79

30

42

21

51

33

33

33

132

115

84

84

119

72

100
FIG 9

Total
Consumption

Demographic Skews
Male Head Only with Children
Female Head Only with Children
Transportation & Material Moving Occupations
Oldest Child 12 - 17
Striving Small City Living
Presence of Only Children 6 - 17
Presence of Only Children Under 6
Oldest Child Under 6
Administrative Support Occupations
4 Person Households

Index

4%
14%
7%
27%
6%
32%
13%
13%
11%
22%

198
195
186
172
171
170
169
167
166
165 FIG 10

ROCK STAR ENERGY DEMOGRAPHIC CHARTS:
LifeStyle
BehaviorStage
Start-Up Families
HHs with Young Children Only < 6
Small Scale Families
Small HHs with Older Children 6+
Younger Bustling Families
Large HHs with Children (6+), HOH <40
Older Bustling Families
Large HHs with Children (6+), HOH 40+
Young Transitionals
Any size HHs, No Children, < 35
Independent Singles
1 person HHs, No Children, 35-64
Senior Singles
1 person HHs, No Children, 65+
Established Couples
2+ person HHs, No Children, 35-54
Empty Nest Couples
2+ person HHs, No Children, 55-64
Senior Couples
2+ person HHs, No Children, 65+
Total

Cosmopolitan
Centers

Affluent
Suburban
Spreads

Comfortable
Country

Struggling
Urban Cores

Modest
Working
Towns

Plain Rural
Living

Total

131

242

158

349

109

139

185

132

164

95

155

82

82

116

273

688

316

203

120

103

267

65

124

129

63

166

153

121

42

48

78

61

78

64

61

30

26

53

39

264

31

83

12

13

68

13

67

18

34

49

118

135

152

80

134

112

107

25

36

98

84

111

72

52

21

69

111

19

35

45

72

124

103

112

109

80

100

Very High: 150+
High: 120-150

FIG 11
Demographic Skews
Male Head Only with Children
Female Head Only with Children
Transportation & Material Moving Occupations
Oldest Child 12 - 17
Striving Small City Living
Presence of Only Children 6 - 17
Presence of Only Children Under 6
Oldest Child Under 6
Administrative Support Occupations
4 Person Households

Total
Consumption

Index

4%
14%
7%
27%
6%
32%
13%
13%
11%
22%

198
195
186
172
171
170
169
167
166
165

FIG 12

COMPETITIVE ANALYSIS/ DEMOGRAPHICS
SUMMARY
This is what Zanah gathered from the 2013 Spectra Demographic reports for Amp and
its top 3 competitors:
Across the board, Amp Energy and its main competitors have similar heavy
consumers.:
Start up families
Younger bustling families
Older bustling Families
Rock Star was the ONLY competitor with a high index number among the
Independent Singles category.
The majority of consumers are Families or single parents
All consumers with high index numbers had children (most times, more than one
child)

The Head of Household occupations with the highest index numbers are
o
o

Careers in Precision, production, craft & repair
Transportation and material moving

The majority of consumers with the highest index numbers
o Owned more than one vehicle
o Were not married, but had children
o Lived in a 3-5 person household
o Were single parents
Household income among heavy consumers ranged from
o $10,000-$70,000
Majority of consumers purchased energy drinks from grocery stores (based on
channel summary)
Majority of consumers are Hispanic or Mixed races.

II.

GAP ANALYSIS – Products and Services
AREAS OF CONCERN HIGHLIGHTED IN RED
AMP

RED BULL
Products

Products
7 products
3 categories: BOOST, ACTIVE, & FOCUS
SPORTS:
Sponsors 6 athletes including Dale
EarnHardt Jr.

Company:
Majority of Amp Energy promotions are
through social media: Face book & Twitter

Product Divisions: Sugar Free, Total
Zero, and Editions (Blue, Red, and
Silver).
COMPANY
Red Bull TV
Sponsors over 100 athletes in biking,
surfing, snowboarding, and
motorsports.
Red Bull Music Academy
100% recyclable products
Wings team/ Student Brand Managers
Red Bull Graduate School

SPORTS DIVISIONS
Red Bull Racing
Red Bull Crashed Ice
Red Bull X Fighters
Red Bull BC OWE

MONSTER

ROCKSTAR

PRODUCTS:
34 different products
6 different categories (Monster Energy, Java
monster, DuB, Rehab, Extra Strength, Muscle
Monster).

PRODUCTS

SPORTS DIVISIONS
Sponsors athletes in 21 motor sports
Sponsors athletes in 9 action sports
Roster of over 30 athletes
COMPANY
Monster Girls
Monster TV
Sponsors bands and tours : MONSTER
OUTBREAK TOUR

III. PEST ANALYSIS

OVER 20 different flavors
SPORTS DIVISIONS

Sponsors athletes in 11 action
sports (BMX, skating, Skiing,
snowboarding.)
Sponsors athletes in 5 different
motorsport divisions
COMPANY

Represents models
Represents music artists
PRODUCTS AVAILABLE ONLINE
Political Factor:
Regulation about content of energy drinks from US Food and Drug
Administration (FDA)
Economic Factor:
According to Spectra Product Reports , the vast majority of energy drink
consumers are in families of 3-5 and may be price sensitive when shopping
for beverages.
Social Factor:
Consumers are now becoming more health conscious, and may lean toward
healthier choices such as:
o Vitamin water
o Coffee
o Low calorie energy shots
o Energy bars
o Protein shakes
Online Shopping is becoming very popular. Majority of energy drinks do not
offer their products online/via their website.
Technological Factor:
Social Media Era:
o In order to keep up with the competition, the majority of products have
to have social media pages to promote their product.
 Facebook
 Twitter
 Instagram
 Pintrest
 Tumblr
o

Online Shopping is becoming very common among grocery store
shoppers

IV. SWOT ANALYSIS
STRENGTHS:
A. AMP is a division of a well known company, PepSiCo.
.

B. The Law of Contraction: “A Brand Becomes Stronger When You
Narrow Its Focus.” Amp has eliminated all 15 products and created
a small line of 3 products with 7 flavors.
C.
Amp’s new target consumer is the consumer with a practical need for
energy. This matches the primary energy drink consumer:
Families
Those with transportation & moving careers.
Single parents
Early risers & Late nighters

WEAKNESS: Competitive Situation
Amp’s competitors (Red Bull, Monster, and Rock Star) offer WAY more
than Amp does. Amp has to now focus on rebuilding its fan base in order to
compete with well known competitors. Each competitor:

Represents music artists or sponsors tours
Has a TV station to promote its athletes and events
Uses models to represent the brand: Wings Team Girls (Red Bull), Monster
Girls, Rock Star Models.
Sponsors at least 20 athletes.
OPPORTUNITIES:
Amp has the opportunity to build its brand presence
through the media.
Since Amp’s target and brand is different than the
majority of energy drinks, they have an opportunity to
gain market leadership among other beverage categories.
Very few energy drink and/or beverage companies sell
their products online. This can be a new opportunity for
AMP.
THREATS:
Revamping the brand turns indirect competition into direct
competition. Amp is now all about a consuming energy drinks for
practical reasons. A healthier choice for a healthier lifestyle. This
means Amp is now competing with:





V.

Vitamin Water
Low calorie energy shots
Protein shakes
Energy bars

CRITICAL ISSUES
“Things changed. We're not just playing hard, we're working hard, too. So we need energy for
different reasons: To get a hop in our step, fuel our passions, or to get in the "zone". That's why
AMP Energy is rethinking energy. Our full lineup of innovative products provides a kick of
energy to match anything the day brings. So tell Monday Morning to bring it on, Friday Night to
wait up for you, and everything in-between to be ready. You're on your way.” – The AMP
Energy Team

Amp Energy has completely revamped its brand. Although this decision has its advantages, it
may put Amp on thinner ice.
Amp is now competing with two different sets of competitors since they revamped their brand:
Energy Drinks: Red Bull, Monster, Rock Star, etc
Healthy Energy Choices : Vitamin water, protein shakes, etc
Amp’s brand does not offer as many elements as its competitors. Amp sponsors less than half of
the athletes that its leading competitors sponsor. Red Bull, Monster, and Rock Star all have brand
models (Monster Girls, Wings Team Girls, and Rock Star Models), Amp does not.
Amp Energy eliminated 15 products and moved to a line of 3 functional drinks. They eliminated
several consumer favorites, which means they will have to go the extra mile to regain consumers
that they lost.

VI. Marketing Strategy and Programs
A. The Central Idea
 AMP Energy has completely revamped its brand. Consumers and the energy drink
market should be fully aware of PepsiCo’s efforts to reposition AMP. This new
positioning strategy needs to be enforced through social media, and all advertising
mediums.
B. Mission
“ Things changed. We're not just playing hard, we're working hard, too. So we need energy for
different reasons: To get a hop in our step, fuel our passions, or to get in the "zone". That's why
AMP Energy is rethinking energy.” – The AMP ENERGY TEAM

C. Positioning Strategy
“Many people misunderstand the role of communication in business and politics today. In our
over communicated society, very little communication actually takes place. Rather, a company
must create a position in the prospect’s mind. A position that takes into consideration not only
the company’s strengths and weaknesses, but those of its competitors as well…”- Al Ries
AMP’s new full lineup of innovative products provides a kick of energy to match anything the
day brings. Unlike its competitors, AMP focuses on the smart way to manage your energy, and
provides unique products that cater to the everyday needs of its consumers.
The new positioning strategy focuses on two target markets : Families & Young Professionals. .
According to spectra demographic reports, families and young professionals represent 54% of
AMP’s total volume segment. Within these two groups there are two target audiences:
Target Audience #1
o
o
o
o
o
o
o
o

Age 25-44
Parents
Grocery Store Shoppers
Career parents & stay at home parents
Early Risers and Late Nighters
Single and/or married
Health conscious shoppers
Households with 3-5+ persons
Target Audience #2
o
o
o
o
o

Age 18-24
Early Risers & Late Nighters
Athletes
College Students
Recent Graduates

Total
Consumption

Demographic Skews
Transportation & Material Moving Occupations
Age 18 - 24
5+ Person Households
Presence of Only Children 6 - 17
Oldest Child 12 - 17
Multi-Person Households without Children
Age 35 - 44
Farming, Fishing & Forestry Occupations
Age 25 - 34
Married Families with Children

13%
12%
22%
35%
29%
26%
32%
1%
25%
34%

Index

349
285
196
186
184
181
180
177
169
167

Source: Homescan Product Library 2013 Sep (Spectra)

LifeStyle

Start-Up Families
HHs with Young Children Only < 6
Small Scale Families
Small HHs with Older Children 6+
Younger Bustling Families
Large HHs with Children (6+), HOH <40
Older Bustling Families
Large HHs with Children (6+), HOH 40+
Young Transitionals
Any size HHs, No Children, < 35
Independent Singles
1 person HHs, No Children, 35-64
Senior Singles
1 person HHs, No Children, 65+
Established Couples
2+ person HHs, No Children, 35-54
Empty Nest Couples
2+ person HHs, No Children, 55-64
Senior Couples
2+ person HHs, No Children, 65+
Total

Affluent
Suburban
Spreads

Comfortable
Country

Struggling
Urban Cores

Modest
Working
Towns

Plain Rural
Living

Total

1.0%

0.7%

2.5%

1.4%

2.6%

4.0%

12.2%

3.2%

0.9%

2.1%

1.2%

1.3%

3.6%

12.4%

1.3%

0.8%

1.5%

2.2%

2.1%

5.8%

13.6%

2.2%

4.6%

2.7%

0.7%

2.2%

3.4%

15.9%

3.4%

1.2%

1.5%

3.3%

2.4%

1.0%

12.8%

0.9%

1.0%

0.3%

1.4%

0.8%

1.4%

5.8%

0.2%

0.5%

0.2%

0.3%

0.2%

0.4%

1.7%

5.7%

0.7%

4.9%

1.2%

1.2%

2.0%

15.7%

0.8%

1.1%

1.4%

0.8%

0.8%

0.9%

5.9%

0.6%

0.3%

0.4%

0.5%

1.8%

0.5%

4.0%

19.3%

BehaviorStage

Cosmopolitan
Centers

11.7%

17.5%

13.0%

15.5%

23.0%

100.0%

D. Financial Objectives
AMP Energy’s sales dropped from 300 million to 239 million in 2013. AMP Energy went from
being the 4th most popular energy drink, to the 5th most popular.
Our sales goal is to increase sales by 5% in each quarter of 2014. Our profitability goal is to
increase profits by 5%.
Sales Goals 2014
Q1 - $250,950,000
Q2- $263,497,500
Q3-$276,672,375
Q4- $290,505,993

E. Marketing Objectives

OBJECTIVE #1: Increase Market Awareness by 18% in 12 months
STRATEGY: MEDIA AWARENESS:
o Rapid Penetration- low price/high promotion
o AMP Energy could benefit from a national advertising campaign titled
“Rethinking Energy”. Consumers and the energy drink market should be fully
aware of PepsiCo’s decision to rebrand AMP. AMP’s new positioning strategy is
clear through their website, but nowhere else. Not many consumers are aware of
AMP’s new lineup of drinks, or their new strategy. The new AMP needs to be
advertised via television, radio, and magazine.
-

PROGRAMS : Media Mix
 TV:
Early News ($7,700 CPP)
Late Fringe ($20,000 CPP)
Primetime ($25,300 CPP)
 Radio
Network Radio ($8,500 CPP)
 Outdoor Ads
Downtown Coverage/Parking lot displays -$60,000 x 30% increase
due to National campaign.
Wrapped Train -$30,589 x 30% increase due to national campaign


-

Taxi tops - $120,000 x 30% increase due to national campaign
Internet ads
Banner ads
Social Media Websites
Youtube

Budget Plan
 $10,000,000 National Campaign
 35% on TV – $3,500,000
Early Morning News (parents, professionals, and college students
tend to be awake and getting ready, needing energy.)
Late Fridge (Settling down to watch tv, late night “studyers”,
procrastinators)


30% on Outdoor advertising $3,000,000
Outdoors in common city areas
Downtown on taxis and in parking lots
On public transportation
 20% on Radio $2,000,000
Pandora Radio
Early morning radio
 15% on internet ads $1,500,000
Facebook banner ads
TV websites where the commercials aired
YouTube

STRATEGY: SOCIAL MEDIA
AMP Energy should also run sweepstakes and contests through their various social media
handles:


CONTESTS
FACEBOOK: Show us how you “Rethink Energy”
Similar to Red Bull’s “Gives You Wings” campaign.
Facebook users can upload photos demonstrating how they
consume Amp Energy for every day needs.
The first user to reach 1,000 likes is rewarded

CROSS PROMOTION THROUGH SOCIAL MEDIA


AMP should use social media pages as a cross promotion tool. Following
brands on twitter and retweeting their posts, and well as “liking” their face
book pages. (Vitamin Water, Energy Bars, Sports Magazines, Special
Olympics etc)

OBJECTIVE #2: CHANGE BRAND PERCEPTION FROM
EXTREME to EVERYDAY
ATHLETES/ SPONSORSHIP / ADVERTISEMENTS
o AMP has repositioned its brand to cater to the everyday needs of everyday consumers. To
avoid brand confusion, AMP Energy should look into new sponsors and endorsees
outside of extreme sports athletics. The new faces of AMP should reflect AMP’s new
brand, and match their new line of innovative products.
o PepsiCo eliminated all 15 of Amps categories and created a product line of 3 with all new
formulations and designs: AMP BOOST, AMP ACTIVE, and AMP FOCUS. AMP has
now reentered the introductory stage of the product lifecycle.
o AMP FOCUS:
 A college student during an exam
 A young professional prepping for an interview
o AMP ACTIVE
 An NBA/NFL/MLB Player
 An Olympic gymnast
 A college athlete
o AMP BOOST
 A stay at home mom or dad
 A college student pulling an all night study session
CONCLUSION
The AMP Energy Team was preparing for an upcoming national advertising campaign to
promote the revamping of the brand. The executive team debated on the positioning of the
overall product. Should AMP be positioned against its competitors (better, stronger, cheaper)?
Or should AMP be positioned to emphasize the uniqueness of the products (offering something
completely new and innovative)?
The essence of the marketing process is to build a brand in the minds of consumers. Through
contracting a brand, it becomes more powerful. This reflects PepsiCo’s decision to contract
AMP’s product line from 15 products to 3 basic product categories. Positioning is about brand
perception in the minds of the consumer. Research shows that AMP’s heaviest consumers are not
the extreme sports, party animal college students that most energy drinks market to. The heaviest
consumers are families, and young professionals. These consumers consume energy drinks for
practical reasons: A late night study session, running to a morning meeting, or to get a boost
before a practice or game. AMP’s new line up of products (AMP Boost, AMP Active, and AMP
Focus) caters to the specific energy needs of this target market.
After extensive research, Amp’s marketing manager, Zanah, concluded that this new positioning
strategy should focus on the uniqueness of the AMP Energy brand. Unlike its competitors,
AMP caters to specific energy needs of the everyday consumer. This new positioning strategy
needs to be enforced through social media, and all advertising mediums.
BIBLIOGRAPHY

"The Top 15 Energy Drink Brands." The Top 15 Energy Drink Brands. N.p., n.d. Web. 14 Nov.
2013.
"Energy Drinks in C-stores: Strong Summer for Red Bull, Monster, NOS, Full Throttle, Weaker
Performance from AMP, Rockstar." FoodNavigator-USA.com. N.p., n.d. Web. 14 Nov. 2013.
"Sales of Energy Drinks Surge, along with Controversy over Health Effects | The Salt Lake Tribune." The
Salt Lake Tribune. N.p., n.d. Web. 14 Nov. 2013.
"America’s Most Popular Energy Drinks." 247wallst.com. N.p., n.d. Web. 14 Nov. 2013.
"Top Selling Energy Drinks." Statistic Brain RSS. N.p., n.d. Web. 14 Nov. 2013.
"Energy Drinks: An Assessment of Their Market Size, Consumer Demographics, Ingredient Profile,
Functionality, and Regulations in the United States." - Heckman. N.p., n.d. Web. 14 Nov. 2013.

"Global Sports and Fitness Nutrition Foods and Drinks Industry." MarketWatch. N.p., n.d. Web.
14 Nov. 2013.
www.spectrainfinet.com

Case Study

  • 1.
    AMP ENERGY Case StudyAnalysis Product Positioning Zanah Thirus 11/24/13 Columbia College Chicago
  • 2.
    The positioning decision: TheAMP Energy team had completely revamped AMP’s brand. After falling behind NOS, and Rock Star in sales over the last year, it was apparent that something had to be done. AMP has Eliminated all 15 of its well-known drinks, and created a new line of three innovative products. Amps new product line consists of Amp Boost, Amp Focus, and Amp Active. Amp Focus o Keep your head on track. Even when everything else isn't. Give your day a boost with AMP Energy Focus, with Caffeine + Choline + Theanine. And be ready to shrug it off anytime someone asks to "borrow you for a second." Amp Boost o Elevate your energy with a 16-Ounce can of "Get it done." AMP Energy Boost, with Caffeine and B-Vitamins, gives you the kick you need to tackle the early morning meeting. And that 3-hour working lunch. And don’t forget your kid's after-school recital. Now, get out there and make us proud. Amp Active o This ain't no ordinary lemonade drink. It's got caffeine and electrolytes †. Like you, it's a full-on multi-tasking, no-friend-of-fatigue dynamo. AMP Energy Active hydrates and helps you power through the day. Seriously, it's no sweat.
  • 3.
    “Our New lineof innovative products provides a kick of energy to match anything the day brings. So tell your Monday morning to bring it on, your Friday night to wait up for you, and everything else in between to be ready. You’re on your way”- Amp Energy Team With the new brand strategy in mind, the AMP marketing team began to generate ideas for an upcoming national media campaign. Although AMP’s new and improved brand seemed like the answer to many problems, the AMP team was still struggling with positioning. Zanah, AMP’s marketing manager, was split between the opinions of the staff. Amp’s sales director, Harry, believed that AMP should be positioned against the leading competitive energy drink brands. “Our new line up of products is better than Red Bull, Rock Star, and Monster when it comes to providing energy. We need to emphasize this through our extreme sports athletes, and show the market how they use our drinks to fuel their game!” Amp’s brand manager, Rachel, thought otherwise. “We need to position AMP as a unique brand. We don’t need to focus our marketing efforts on making our brand like our competitors, because we offer something that they can’t. Our new line up of drinks helps fuel every day passions. Red Bull and Monster focus on extreme sports athletes, we need to focus on the everyday consumer.” The decision was up to Zanah. Should AMP be positioned against its competitors (better, stronger, cheaper)? Or should AMP be positioned to emphasize the uniqueness of the products (offering something completely new and innovative)?
  • 4.
    History of Amp:A PepsiCo Brand Amp Energy is the energy drink version of Mountain Dew, created by PepsiCo, and released in 2001. AMP Energy is the premier energy brand of Purchase, N.Y.-based Pepsi-Cola North America Beverages (PCNAB). With its energizing blend of B-vitamins and a specially formulated intense combination of taurine, ginseng, and guarana, AMP Energy provides the power needed to tackle everything in life, day or night. PCNAB is a division of PepsiCo, which offers the world's largest portfolio of billion-dollar food and beverage brands Amp Energy was launched by PepsiCo in 2001. PepsiCo is one of the world’s leading food and beverage companies with over 65 billion in net revenue in 2012. Pepsi Co has a global portfolio of diverse and beloved brands including Pepsi, Gatorade, Lays, Amp, and Quaker. Pepsi Co employs over 250,000 employees in 200 countries across the globe, and the reported revenue growth in the beverage division was 4.5% in 2012. According to Pepsi Co’s website, 80% of the current executive team was promoted from within. The company headquarters is located in Purchase, NY. The current CEO is Indra Nooyi. Pepsi Co Brands are organized into the four global business units: Pepsi Co American Foods Pepsi Co American Beverages (Including Amp) Pepsi Co Europe Pepsi Co Asia, Middle East, and Africa (AMEA)
  • 5.
    According to PepsiCo’s 2012 annual report, the company objectives include: Building and retaining top talent To focus on driving cost savings and other productivity enhancements derived from our complimentary food and beverage portfolio. Reinforce our existing value drivers (refocusing efforts on most popular global brands). PepsiCo’s original strategy for Amp was to position it to compete with leading energy drink brands like Red Bull and Monster. PepsiCo repositions AMP: In 2008, AMP was America’s 4th most popular Energy drink (behind Red Bull and Monster). That year, PepsiCo decided to “amp up” Amp’s media budget and positioning strategy. PepsiCo launched a massive campaign starring Nascar driver dale Earnheardt Jr., three new flavors, a high profile summer promotion, and a slew of packaging variations. This was all in an attempt to increase Amp’s presence in the Energy Drink market, and to compete with the leading brands, Red Bull and Monster. Since the major campaign in 2008, Sales for Amp have taken a major drop. In the last year, PepsiCo’s CSD dollar sales have declined 1.4% amounting to “The Worst performance of PepsiCo in over a year”, according to Wells Fargo’s senior analyst, Bonnie Herzog. Amp is now sitting below Rockstar, NOS, and Starbucks Double Shot. Those three brands are sitting below Red Bull, and Monster. Something had to be done. This year, PepsiCo decided to rebrand and reposition Amp Energy. PepsiCo eliminated all 15 of Amps categories and created a product line of 3 with all new formulations and designs.
  • 6.
    “Our New lineof innovative products provides a kick of energy to match anything the day brings. So tell your Monday morning to bring it on, your Friday night to wait up for you, and everything else in between to be ready. You’re on your way”- Amp Energy Team I. MARKET SUMMARY According to www.energyfiend.com, Energy Drinks are a billion dollar industry. Red Bull sold US$3.4 billion dollars of energy drink product in the 52 weeks prior to July 2013. Monster sold US$3.1 billion worth. A huge part of energy drink popularity is in the sponsorship efforts, with top brands spending large sums of money to achieve brand placement. Several energy drinks have definitely been lifting their marketing efforts and it’s paying off with their recent entrance into the top 15 energy drinks ranking. The leading energy drinks are Red Bull and Monster. Red Bull sold US$3.4 BILLION dollars of energy drink product in the 52 weeks prior to July 2013. Monster sold US$3.1 BILLION worth. The third leading energy drink is Rock Star. NOS is in fourth place, and AMP Energy is in 5th place. The energy drink market continues to grow even in light of the tough economy and increased health scrutiny. Soda sales have been declining steadily over the same period, while energy drink sales have been booming. Despite recent FDA scrutiny regarding the safety of these beverages, 2013 energy drink sales are up 6.7% over last year in the USA alone.
  • 7.
    FIG. 1 CARBONATED BEVERAGE(INCLUDING ENERGY DRINKS) DEMOGRAPHIC SUMMARY – 2013 Spectra Reports The following four charts are 2013 consumer demographic from spectra. The charts show index numbers and total volume among the heaviest carbonated beverage consumers. Charts include data on race of head of household, household structure, household demographics, occupation of head of household and average household income. LifeStyle BehaviorStage Start-Up Families HHs with Young Children Only < 6 Small Scale Families Small HHs with Older Children 6+ Younger Bustling Families Large HHs with Children (6+), HOH <40 Older Bustling Families Large HHs with Children (6+), HOH 40+ Young Transitionals Any size HHs, No Children, < 35 Independent Singles 1 person HHs, No Children, 35-64 Senior Singles 1 person HHs, No Children, 65+ Established Couples 2+ person HHs, No Children, 35-54 Empty Nest Couples 2+ person HHs, No Children, 55-64 Senior Couples 2+ person HHs, No Children, 65+ Total Cosmopolitan Centers Affluent Suburban Spreads Comfortable Country 77 76 114 93 176 157 47 48 Modest Working Towns Plain Rural Living Total 112 91 113 128 100 123 131 138 149 125 94 150 156 136 195 152 110 145 152 184 211 155 64 88 94 78 110 79 40 52 71 69 81 62 29 33 36 39 40 46 39 105 96 129 138 135 176 132 97 89 98 121 123 120 107 78 65 73 101 86 85 80 84 79 99 106 103 123 100 Very High: 150+ High: 120-150 FIG. 2 Struggling Urban Cores
  • 8.
    Total Consumption Demographic Skews Male HeadOnly with Children 5+ Person Households Oldest Child 12 - 17 Not a High School Graduate Presence of Only Children 6 - 17 Farming, Fishing & Forestry Occupations Female Head Only with Children Precision Production, Craft & Repair Occupations Struggling Rural Mix Presence of Both Children Under 6 and 6 - 17 4% 18% 25% 20% 27% 1% 11% 15% 4% 9% Index 178 165 158 151 146 145 144 141 140 138 FIG. 3 Race of Head of Household-Total Consumption Index 150 100 50 0 White Black Hispanic Asian Other FIG 4 Source: Homescan Product Library 2013 Sep (Spectra) Household Income-Total Consumption Index 150 100 50 0 Under $10,000 $10,000 - $19,999 $20,000 - $29,999 $30,000 - $39,999 $40,000 - $49,999 $50,000 - $74,999 $75,000 - $99,999 $100,000 - $149,999 $150,000 or More Source: Homescan Product Library 2013 Sep (Spectra) FIG 5
  • 9.
    Zanah decided togather research on AMP Energy’s primary consumer demographic to better position the product. She also conducted research on AMP’s top three competitors in the energy drink market: Red Bull, Monster, and Rock Star. AMP ENERGY DEMOGRAPHIC CHARTS: -The following two charts are Spectra 2013 reports on AMP Energy’s consumer demographic. FIG 5 LifeStyle BehaviorStage Start-Up Families HHs with Young Children Only < 6 Small Scale Families Small HHs with Older Children 6+ Younger Bustling Families Large HHs with Children (6+), HOH <40 Older Bustling Families Large HHs with Children (6+), HOH 40+ Young Transitionals Any size HHs, No Children, < 35 Independent Singles 1 person HHs, No Children, 35-64 Senior Singles 1 person HHs, No Children, 65+ Established Couples 2+ person HHs, No Children, 35-54 Empty Nest Couples 2+ person HHs, No Children, 55-64 Senior Couples 2+ person HHs, No Children, 65+ Total Cosmopolitan Centers Affluent Suburban Spreads Comfortable Country Struggling Urban Cores Modest Working Towns Plain Rural Living Total 95 46 210 137 187 294 163 350 62 153 118 95 229 159 179 72 124 197 161 370 195 168 173 143 57 139 200 152 148 110 144 147 104 69 123 44 61 18 71 32 57 47 17 36 10 29 7 15 17 361 36 242 96 66 88 145 61 50 60 86 46 36 53 39 12 15 46 84 16 32 138 68 104 100 83 113 100 Very High: 150+ High: 120-150
  • 10.
    Demographic Skews Transportation &Material Moving Occupations Age 18 - 24 5+ Person Households Presence of Only Children 6 - 17 Oldest Child 12 - 17 Multi-Person Households without Children Age 35 - 44 Farming, Fishing & Forestry Occupations Age 25 - 34 Married Families with Children Source: Homescan Product Library 2013 Sep (Spectra) Total Consumption 13% 12% 22% 35% 29% 26% 32% 1% 25% 34% Index 349 285 196 186 184 181 180 177 169 167 FIG 6 RED BULL DEMOGRAPHIC CHARTS: - Red Bull is AMP Energy’s biggest competitor. The following 2 charts are 2013 Spectra Reports on Red Bull’s consumer demographic. FIG 7
  • 11.
    Total Consumption Demographic Skews Presence ofBoth Children Under 6 and 6 - 17 Male Head Only with Children Other Races Precision Production, Craft & Repair Occupations Age 25 - 34 Transportation & Material Moving Occupations 5+ Person Households Oldest Child 6 - 11 Hispanics Oldest Child Under 6 Index 18% 6% 5% 23% 32% 8% 23% 18% 24% 14% 269 259 231 215 212 205 203 195 192 192 FIG 8 MONSTER DEMOGRAPHIC CHARTS: - The Following 2 charts are 2013 Spectra reports on Monster Energy’s consumer demographic. LifeStyle BehaviorStage Start-Up Families HHs with Young Children Only < 6 Small Scale Families Small HHs with Older Children 6+ Younger Bustling Families Large HHs with Children (6+), HOH <40 Older Bustling Families Large HHs with Children (6+), HOH 40+ Young Transitionals Any size HHs, No Children, < 35 Independent Singles 1 person HHs, No Children, 35-64 Senior Singles 1 person HHs, No Children, 65+ Established Couples 2+ person HHs, No Children, 35-54 Empty Nest Couples 2+ person HHs, No Children, 55-64 Senior Couples 2+ person HHs, No Children, 65+ Total Cosmopolitan Centers Affluent Suburban Spreads Comfortable Country Struggling Urban Cores Modest Working Towns Plain Rural Living Total 269 174 99 153 125 122 154 140 107 166 141 339 115 169 242 150 108 107 243 195 173 216 126 125 103 122 117 132 107 159 88 74 140 58 104 105 23 50 73 47 33 55 4 35 19 28 28 11 20 226 277 99 86 163 85 154 86 86 101 44 93 51 79 30 42 21 51 33 33 33 132 115 84 84 119 72 100
  • 12.
    FIG 9 Total Consumption Demographic Skews MaleHead Only with Children Female Head Only with Children Transportation & Material Moving Occupations Oldest Child 12 - 17 Striving Small City Living Presence of Only Children 6 - 17 Presence of Only Children Under 6 Oldest Child Under 6 Administrative Support Occupations 4 Person Households Index 4% 14% 7% 27% 6% 32% 13% 13% 11% 22% 198 195 186 172 171 170 169 167 166 165 FIG 10 ROCK STAR ENERGY DEMOGRAPHIC CHARTS: LifeStyle BehaviorStage Start-Up Families HHs with Young Children Only < 6 Small Scale Families Small HHs with Older Children 6+ Younger Bustling Families Large HHs with Children (6+), HOH <40 Older Bustling Families Large HHs with Children (6+), HOH 40+ Young Transitionals Any size HHs, No Children, < 35 Independent Singles 1 person HHs, No Children, 35-64 Senior Singles 1 person HHs, No Children, 65+ Established Couples 2+ person HHs, No Children, 35-54 Empty Nest Couples 2+ person HHs, No Children, 55-64 Senior Couples 2+ person HHs, No Children, 65+ Total Cosmopolitan Centers Affluent Suburban Spreads Comfortable Country Struggling Urban Cores Modest Working Towns Plain Rural Living Total 131 242 158 349 109 139 185 132 164 95 155 82 82 116 273 688 316 203 120 103 267 65 124 129 63 166 153 121 42 48 78 61 78 64 61 30 26 53 39 264 31 83 12 13 68 13 67 18 34 49 118 135 152 80 134 112 107 25 36 98 84 111 72 52 21 69 111 19 35 45 72 124 103 112 109 80 100 Very High: 150+ High: 120-150 FIG 11
  • 13.
    Demographic Skews Male HeadOnly with Children Female Head Only with Children Transportation & Material Moving Occupations Oldest Child 12 - 17 Striving Small City Living Presence of Only Children 6 - 17 Presence of Only Children Under 6 Oldest Child Under 6 Administrative Support Occupations 4 Person Households Total Consumption Index 4% 14% 7% 27% 6% 32% 13% 13% 11% 22% 198 195 186 172 171 170 169 167 166 165 FIG 12 COMPETITIVE ANALYSIS/ DEMOGRAPHICS SUMMARY This is what Zanah gathered from the 2013 Spectra Demographic reports for Amp and its top 3 competitors: Across the board, Amp Energy and its main competitors have similar heavy consumers.: Start up families Younger bustling families Older bustling Families Rock Star was the ONLY competitor with a high index number among the Independent Singles category. The majority of consumers are Families or single parents
  • 14.
    All consumers withhigh index numbers had children (most times, more than one child) The Head of Household occupations with the highest index numbers are o o Careers in Precision, production, craft & repair Transportation and material moving The majority of consumers with the highest index numbers o Owned more than one vehicle o Were not married, but had children o Lived in a 3-5 person household o Were single parents Household income among heavy consumers ranged from o $10,000-$70,000 Majority of consumers purchased energy drinks from grocery stores (based on channel summary) Majority of consumers are Hispanic or Mixed races. II. GAP ANALYSIS – Products and Services AREAS OF CONCERN HIGHLIGHTED IN RED
  • 15.
    AMP RED BULL Products Products 7 products 3categories: BOOST, ACTIVE, & FOCUS SPORTS: Sponsors 6 athletes including Dale EarnHardt Jr. Company: Majority of Amp Energy promotions are through social media: Face book & Twitter Product Divisions: Sugar Free, Total Zero, and Editions (Blue, Red, and Silver). COMPANY Red Bull TV Sponsors over 100 athletes in biking, surfing, snowboarding, and motorsports. Red Bull Music Academy 100% recyclable products Wings team/ Student Brand Managers Red Bull Graduate School SPORTS DIVISIONS Red Bull Racing Red Bull Crashed Ice Red Bull X Fighters Red Bull BC OWE MONSTER ROCKSTAR PRODUCTS: 34 different products 6 different categories (Monster Energy, Java monster, DuB, Rehab, Extra Strength, Muscle Monster). PRODUCTS SPORTS DIVISIONS Sponsors athletes in 21 motor sports Sponsors athletes in 9 action sports Roster of over 30 athletes COMPANY Monster Girls Monster TV Sponsors bands and tours : MONSTER OUTBREAK TOUR III. PEST ANALYSIS OVER 20 different flavors SPORTS DIVISIONS Sponsors athletes in 11 action sports (BMX, skating, Skiing, snowboarding.) Sponsors athletes in 5 different motorsport divisions COMPANY Represents models Represents music artists PRODUCTS AVAILABLE ONLINE
  • 16.
    Political Factor: Regulation aboutcontent of energy drinks from US Food and Drug Administration (FDA) Economic Factor: According to Spectra Product Reports , the vast majority of energy drink consumers are in families of 3-5 and may be price sensitive when shopping for beverages. Social Factor: Consumers are now becoming more health conscious, and may lean toward healthier choices such as: o Vitamin water o Coffee o Low calorie energy shots o Energy bars o Protein shakes Online Shopping is becoming very popular. Majority of energy drinks do not offer their products online/via their website. Technological Factor: Social Media Era: o In order to keep up with the competition, the majority of products have to have social media pages to promote their product.  Facebook  Twitter  Instagram  Pintrest  Tumblr o Online Shopping is becoming very common among grocery store shoppers IV. SWOT ANALYSIS
  • 17.
    STRENGTHS: A. AMP isa division of a well known company, PepSiCo. . B. The Law of Contraction: “A Brand Becomes Stronger When You Narrow Its Focus.” Amp has eliminated all 15 products and created a small line of 3 products with 7 flavors. C. Amp’s new target consumer is the consumer with a practical need for energy. This matches the primary energy drink consumer: Families Those with transportation & moving careers. Single parents Early risers & Late nighters WEAKNESS: Competitive Situation Amp’s competitors (Red Bull, Monster, and Rock Star) offer WAY more than Amp does. Amp has to now focus on rebuilding its fan base in order to compete with well known competitors. Each competitor: Represents music artists or sponsors tours Has a TV station to promote its athletes and events Uses models to represent the brand: Wings Team Girls (Red Bull), Monster Girls, Rock Star Models. Sponsors at least 20 athletes. OPPORTUNITIES:
  • 18.
    Amp has theopportunity to build its brand presence through the media. Since Amp’s target and brand is different than the majority of energy drinks, they have an opportunity to gain market leadership among other beverage categories. Very few energy drink and/or beverage companies sell their products online. This can be a new opportunity for AMP. THREATS: Revamping the brand turns indirect competition into direct competition. Amp is now all about a consuming energy drinks for practical reasons. A healthier choice for a healthier lifestyle. This means Amp is now competing with:     V. Vitamin Water Low calorie energy shots Protein shakes Energy bars CRITICAL ISSUES
  • 19.
    “Things changed. We'renot just playing hard, we're working hard, too. So we need energy for different reasons: To get a hop in our step, fuel our passions, or to get in the "zone". That's why AMP Energy is rethinking energy. Our full lineup of innovative products provides a kick of energy to match anything the day brings. So tell Monday Morning to bring it on, Friday Night to wait up for you, and everything in-between to be ready. You're on your way.” – The AMP Energy Team Amp Energy has completely revamped its brand. Although this decision has its advantages, it may put Amp on thinner ice. Amp is now competing with two different sets of competitors since they revamped their brand: Energy Drinks: Red Bull, Monster, Rock Star, etc Healthy Energy Choices : Vitamin water, protein shakes, etc Amp’s brand does not offer as many elements as its competitors. Amp sponsors less than half of the athletes that its leading competitors sponsor. Red Bull, Monster, and Rock Star all have brand models (Monster Girls, Wings Team Girls, and Rock Star Models), Amp does not. Amp Energy eliminated 15 products and moved to a line of 3 functional drinks. They eliminated several consumer favorites, which means they will have to go the extra mile to regain consumers that they lost. VI. Marketing Strategy and Programs
  • 20.
    A. The CentralIdea  AMP Energy has completely revamped its brand. Consumers and the energy drink market should be fully aware of PepsiCo’s efforts to reposition AMP. This new positioning strategy needs to be enforced through social media, and all advertising mediums. B. Mission “ Things changed. We're not just playing hard, we're working hard, too. So we need energy for different reasons: To get a hop in our step, fuel our passions, or to get in the "zone". That's why AMP Energy is rethinking energy.” – The AMP ENERGY TEAM C. Positioning Strategy “Many people misunderstand the role of communication in business and politics today. In our over communicated society, very little communication actually takes place. Rather, a company must create a position in the prospect’s mind. A position that takes into consideration not only the company’s strengths and weaknesses, but those of its competitors as well…”- Al Ries AMP’s new full lineup of innovative products provides a kick of energy to match anything the day brings. Unlike its competitors, AMP focuses on the smart way to manage your energy, and provides unique products that cater to the everyday needs of its consumers. The new positioning strategy focuses on two target markets : Families & Young Professionals. . According to spectra demographic reports, families and young professionals represent 54% of AMP’s total volume segment. Within these two groups there are two target audiences: Target Audience #1 o o o o o o o o Age 25-44 Parents Grocery Store Shoppers Career parents & stay at home parents Early Risers and Late Nighters Single and/or married Health conscious shoppers Households with 3-5+ persons
  • 21.
    Target Audience #2 o o o o o Age18-24 Early Risers & Late Nighters Athletes College Students Recent Graduates Total Consumption Demographic Skews Transportation & Material Moving Occupations Age 18 - 24 5+ Person Households Presence of Only Children 6 - 17 Oldest Child 12 - 17 Multi-Person Households without Children Age 35 - 44 Farming, Fishing & Forestry Occupations Age 25 - 34 Married Families with Children 13% 12% 22% 35% 29% 26% 32% 1% 25% 34% Index 349 285 196 186 184 181 180 177 169 167 Source: Homescan Product Library 2013 Sep (Spectra) LifeStyle Start-Up Families HHs with Young Children Only < 6 Small Scale Families Small HHs with Older Children 6+ Younger Bustling Families Large HHs with Children (6+), HOH <40 Older Bustling Families Large HHs with Children (6+), HOH 40+ Young Transitionals Any size HHs, No Children, < 35 Independent Singles 1 person HHs, No Children, 35-64 Senior Singles 1 person HHs, No Children, 65+ Established Couples 2+ person HHs, No Children, 35-54 Empty Nest Couples 2+ person HHs, No Children, 55-64 Senior Couples 2+ person HHs, No Children, 65+ Total Affluent Suburban Spreads Comfortable Country Struggling Urban Cores Modest Working Towns Plain Rural Living Total 1.0% 0.7% 2.5% 1.4% 2.6% 4.0% 12.2% 3.2% 0.9% 2.1% 1.2% 1.3% 3.6% 12.4% 1.3% 0.8% 1.5% 2.2% 2.1% 5.8% 13.6% 2.2% 4.6% 2.7% 0.7% 2.2% 3.4% 15.9% 3.4% 1.2% 1.5% 3.3% 2.4% 1.0% 12.8% 0.9% 1.0% 0.3% 1.4% 0.8% 1.4% 5.8% 0.2% 0.5% 0.2% 0.3% 0.2% 0.4% 1.7% 5.7% 0.7% 4.9% 1.2% 1.2% 2.0% 15.7% 0.8% 1.1% 1.4% 0.8% 0.8% 0.9% 5.9% 0.6% 0.3% 0.4% 0.5% 1.8% 0.5% 4.0% 19.3% BehaviorStage Cosmopolitan Centers 11.7% 17.5% 13.0% 15.5% 23.0% 100.0% D. Financial Objectives
  • 22.
    AMP Energy’s salesdropped from 300 million to 239 million in 2013. AMP Energy went from being the 4th most popular energy drink, to the 5th most popular. Our sales goal is to increase sales by 5% in each quarter of 2014. Our profitability goal is to increase profits by 5%. Sales Goals 2014 Q1 - $250,950,000 Q2- $263,497,500 Q3-$276,672,375 Q4- $290,505,993 E. Marketing Objectives OBJECTIVE #1: Increase Market Awareness by 18% in 12 months STRATEGY: MEDIA AWARENESS: o Rapid Penetration- low price/high promotion o AMP Energy could benefit from a national advertising campaign titled “Rethinking Energy”. Consumers and the energy drink market should be fully aware of PepsiCo’s decision to rebrand AMP. AMP’s new positioning strategy is clear through their website, but nowhere else. Not many consumers are aware of AMP’s new lineup of drinks, or their new strategy. The new AMP needs to be advertised via television, radio, and magazine. - PROGRAMS : Media Mix  TV: Early News ($7,700 CPP) Late Fringe ($20,000 CPP) Primetime ($25,300 CPP)  Radio Network Radio ($8,500 CPP)  Outdoor Ads Downtown Coverage/Parking lot displays -$60,000 x 30% increase due to National campaign. Wrapped Train -$30,589 x 30% increase due to national campaign
  • 23.
     - Taxi tops -$120,000 x 30% increase due to national campaign Internet ads Banner ads Social Media Websites Youtube Budget Plan  $10,000,000 National Campaign  35% on TV – $3,500,000 Early Morning News (parents, professionals, and college students tend to be awake and getting ready, needing energy.) Late Fridge (Settling down to watch tv, late night “studyers”, procrastinators)  30% on Outdoor advertising $3,000,000 Outdoors in common city areas Downtown on taxis and in parking lots On public transportation  20% on Radio $2,000,000 Pandora Radio Early morning radio  15% on internet ads $1,500,000 Facebook banner ads TV websites where the commercials aired YouTube STRATEGY: SOCIAL MEDIA AMP Energy should also run sweepstakes and contests through their various social media handles:  CONTESTS FACEBOOK: Show us how you “Rethink Energy” Similar to Red Bull’s “Gives You Wings” campaign. Facebook users can upload photos demonstrating how they consume Amp Energy for every day needs. The first user to reach 1,000 likes is rewarded CROSS PROMOTION THROUGH SOCIAL MEDIA
  • 24.
     AMP should usesocial media pages as a cross promotion tool. Following brands on twitter and retweeting their posts, and well as “liking” their face book pages. (Vitamin Water, Energy Bars, Sports Magazines, Special Olympics etc) OBJECTIVE #2: CHANGE BRAND PERCEPTION FROM EXTREME to EVERYDAY ATHLETES/ SPONSORSHIP / ADVERTISEMENTS o AMP has repositioned its brand to cater to the everyday needs of everyday consumers. To avoid brand confusion, AMP Energy should look into new sponsors and endorsees outside of extreme sports athletics. The new faces of AMP should reflect AMP’s new brand, and match their new line of innovative products. o PepsiCo eliminated all 15 of Amps categories and created a product line of 3 with all new formulations and designs: AMP BOOST, AMP ACTIVE, and AMP FOCUS. AMP has now reentered the introductory stage of the product lifecycle. o AMP FOCUS:  A college student during an exam  A young professional prepping for an interview o AMP ACTIVE  An NBA/NFL/MLB Player  An Olympic gymnast  A college athlete o AMP BOOST  A stay at home mom or dad  A college student pulling an all night study session
  • 25.
    CONCLUSION The AMP EnergyTeam was preparing for an upcoming national advertising campaign to promote the revamping of the brand. The executive team debated on the positioning of the overall product. Should AMP be positioned against its competitors (better, stronger, cheaper)? Or should AMP be positioned to emphasize the uniqueness of the products (offering something completely new and innovative)? The essence of the marketing process is to build a brand in the minds of consumers. Through contracting a brand, it becomes more powerful. This reflects PepsiCo’s decision to contract AMP’s product line from 15 products to 3 basic product categories. Positioning is about brand perception in the minds of the consumer. Research shows that AMP’s heaviest consumers are not the extreme sports, party animal college students that most energy drinks market to. The heaviest consumers are families, and young professionals. These consumers consume energy drinks for practical reasons: A late night study session, running to a morning meeting, or to get a boost before a practice or game. AMP’s new line up of products (AMP Boost, AMP Active, and AMP Focus) caters to the specific energy needs of this target market. After extensive research, Amp’s marketing manager, Zanah, concluded that this new positioning strategy should focus on the uniqueness of the AMP Energy brand. Unlike its competitors, AMP caters to specific energy needs of the everyday consumer. This new positioning strategy needs to be enforced through social media, and all advertising mediums.
  • 26.
    BIBLIOGRAPHY "The Top 15Energy Drink Brands." The Top 15 Energy Drink Brands. N.p., n.d. Web. 14 Nov. 2013. "Energy Drinks in C-stores: Strong Summer for Red Bull, Monster, NOS, Full Throttle, Weaker Performance from AMP, Rockstar." FoodNavigator-USA.com. N.p., n.d. Web. 14 Nov. 2013. "Sales of Energy Drinks Surge, along with Controversy over Health Effects | The Salt Lake Tribune." The Salt Lake Tribune. N.p., n.d. Web. 14 Nov. 2013. "America’s Most Popular Energy Drinks." 247wallst.com. N.p., n.d. Web. 14 Nov. 2013. "Top Selling Energy Drinks." Statistic Brain RSS. N.p., n.d. Web. 14 Nov. 2013. "Energy Drinks: An Assessment of Their Market Size, Consumer Demographics, Ingredient Profile, Functionality, and Regulations in the United States." - Heckman. N.p., n.d. Web. 14 Nov. 2013. "Global Sports and Fitness Nutrition Foods and Drinks Industry." MarketWatch. N.p., n.d. Web. 14 Nov. 2013. www.spectrainfinet.com