This document discusses the development of MATLAB software to control data acquisition from a Multichannel Systems microelectrode array for studying sudden cardiac death. The software was developed because the MCS software stores data in a format that is slow to import into MATLAB. The developed MATLAB software can: 1) provide real-time display of electrogram signals from the microelectrode array; 2) record and save the signals in MATLAB in a desired format; and 3) perform real-time analysis of the signals through a graphical user interface. It controls data acquisition from the MCS unit, formats and stores the data, and allows for real-time visualization and analysis of the signals to enable study of sudden cardiac death.
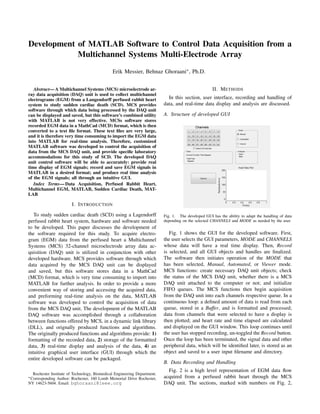
International Journal of Engineering Research and Development (IJERD)IJERD Editor
journal publishing, how to publish research paper, Call For research paper, international journal, publishing a paper, IJERD, journal of science and technology, how to get a research paper published, publishing a paper, publishing of journal, publishing of research paper, reserach and review articles, IJERD Journal, How to publish your research paper, publish research paper, open access engineering journal, Engineering journal, Mathemetics journal, Physics journal, Chemistry journal, Computer Engineering, Computer Science journal, how to submit your paper, peer reviw journal, indexed journal, reserach and review articles, engineering journal, www.ijerd.com, research journals,
yahoo journals, bing journals, International Journal of Engineering Research and Development, google journals, hard copy of journal
High Speed Low Power Veterbi Decoder Design for TCM Decodersijsrd.com
It is well known that the Viterbi decoder (VD) is the dominant module determining the overall power consumption of TCM decoders. High-speed, low-power design of Viterbi decoders for trellis coded modulation (TCM) systems is presented in this paper. We propose a pre-computation architecture incorporated with -algorithm for VD, which can effectively reduce the power consumption without degrading the decoding speed much. A general solution to derive the optimal pre-computation steps is also given in the paper. Implementation result of a VD for a rate-3/4 convolutional code used in a TCM system shows that compared with the full trellis VD, the precomputation architecture reduces the power consumption by as much as 70% without performance loss, while the degradation in clock speed is negligible.
Enhancing the matrix transpose operation using intel avx instruction set exte...ijcsit
General-purpose microprocessors are augmented with short-vector instruction extensions in order to
simultaneously process more than one data element using the same operation. This type of parallelism is
known as data-parallel processing. Many scientific, engineering, and signal processing applications can be
formulated as matrix operations. Therefore, accelerating these kernel operations on microprocessors,
which are the building blocks or large high-performance computing systems, will definitely boost the
performance of the aforementioned applications. In this paper, we consider the acceleration of the matrix
transpose operation using the 256-bit Intel advanced vector extension (AVX) instructions. We present a
novel vector-based matrix transpose algorithm and its optimized implementation using AVX instructions.
The experimental results on Intel Core i7 processor demonstrates a 2.83 speedup over the standard
sequential implementation, and a maximum of 1.53 speedup over the GCC library implementation. When
the transpose is combined with matrix addition to compute the matrix update, B + AT, where A and B are
squared matrices, the speedup of our implementation over the sequential algorithm increased to 3.19.
Design and Implementation of an Efficient 64 bit MACIJERA Editor
The design of optimized 64 bit multiplier and accumulator (MAC) unit is implemented in this paper. MAC unit plays major role in many of the digital signal processing (DSP) applications. The MAC unit is designed with the combinations of multipliers and adders. In the proposed method MAC unit is implemented using Vedic multiplier and the adder is done with ripple carry adder .The components are reduced by implementing Vedic multiplier using the techniques of Vedic mathematics that have been modified to improve performance. a high speed processor depends significantly on the multiplier as it is one of the key hardware blocks in most digital signal processing systems as well as in general processors. The area is optimized effectively using Vedic multiplier .The total design implemented using Xilinx.
A Novel VLSI Architecture for FFT Utilizing Proposed 4:2 & 7:2 CompressorIJERD Editor
With the appearance of new innovation in the fields of VLSI and correspondence, there is likewise a perpetually developing interest for fast transforming and low range outline. It is likewise a remarkable certainty that the multiplier unit structures a fundamental piece of processor configuration. Because of this respect, rapid multiplier architectures turn into the need of the day. In this paper, we acquaint a novel structural engineering with perform high velocity duplication utilizing old Vedic math's strategies. Another fast approach using 4:2 compressors and novel 7:2 compressors for expansion has additionally been joined in the same and has been investigated. Upon examination, the compressor based multiplier present in this paper, is just about two times quicker than the mainstream routines for augmentation. Likewise we outline a FFT utilizing compressor based multiplier. This all configuration and examinations were done on a Xilinx Spartan 3e arrangement of FPGA and the timing and zone of the outline, on the same have been ascertained.
The 2015 Land Markets Survey is a tool for real estate land professionals in all sectors of the business to use for benchmarking and as an informational resource when conducting business. This year marks the third consecutive year that the survey has been conducted to reveal current trends and the current state of land markets. The survey includes responses from over 615 expert land professionals including respondents from across North America.
The REALTORS® Land Institute and The National Association of REALTORS® are pleased to present the findings of the 2015 LAND MARKET SURVEY. This report is the only one of its kind and contains pertinent details about the current state of the real estate land markets.
The P: F&RS Vision 2030 charts the strategic direction that Fire & Rescue Services within the Province needs to embark on in the next few years, and identifies the key areas to move the implementation of the vision forward to a people-centered, people-oriented, financially sustainable Fire & Rescue Service by 2030.
11 Of The Oddest Pets You Might Want To Look AfterJane Clarke
Here's a bunch of small cute furballs you probably didn't think of having as pets. They're a little bit odd for a pet choice and, yet, are so cute it hurts. But do they make good pets, actually? See for yourself.
Lodgement Order dated 28.01.2017 of Registrar Supreme Court of IndiaOm Prakash Poddar
Registrar Supreme Court of India refused to register Writ Petition Criminal No........of 2017 titled "OM PRAKASH & ANR VS. UNION OF INDIA & ORS" vide Diary No. 2188 of 2017 under Order XV Rule 5 of Supreme Court Rules, 2013 vide Lodgement Order dated 28.01.2017 on the ground of no reasonable cause received for registration under order XV, Rule 5 of the Supreme Court Rules, 2013 which has suspended the fundamental rights of the petitioners under Article 21 and closed the door of this Hon’ble Court for the petitioners forever.
Animations on Fire - Making Web animations fastbrianskold
How to make Web animations perform better by understanding what browsers are doing and employing the latest technologies like will-change, layers, compositor animations and the Web Animations API.
HTML version: http://people.mozilla.org/~bbirtles/pres/graphical-web-2014/
Technical SEO Myths Facts And Theories On Crawl Budget And The Importance Of ...Dawn Anderson MSc DigM
There are a lot of myths, facts and theories on crawl budget and the term is bandied around a lot. This deck looks to address some of those myths and also looks at some additional theories around the concepts of 'crawl rank' and 'search engine embarrassment'.
Pubcon 2016 - How SEO's can Use PPC to hit their goalsWil Reynolds
I spent 3 months, focusing on how to use PPC as the way to do my outreach, build my traffic, get my links. This presentation will show how I went from total newbie @ PPC to just newbie, what I learned along the way, mistakes I made, money I wasted, what I learned.
The 2016 Land Markets Survey is a tool for real estate land professionals in all sectors of the business to use for bench-marking and as an informational resource when conducting business published annually by the REALTORS® Land Institute and the National Association of REALTORS® Research Department. This year marks the third consecutive year that the survey has been conducted to reveal current trends and the current state of land markets. The survey includes responses from over six-hundred and fourteen expert land professionals including respondents from across North America.
Debunking the myths of organizational change managementaccenture
Over the past 15 years, we have studied 250 major change initiatives at more than 150 organizations, including dozens of Fortune Global 500 corporations. We have collected data from more than 850,000 employees, from front-line staffers through leadership at all levels. The resulting analysis of that dataset—representing the cumulative wisdom of experienced change travelers—has dispelled many long-held myths about organization change. It has brought new insights to help leaders and the workforce of the future embark on insight-driven change. Learn more at http://www.accenture.com/MythsofChange
Digitized Student Development, Social Media, and IdentityPaul Brown
Originally presented at the ACPA 2016 International Convention in Montreal, Canada. This presentation provides an overview of my research on college student development in digital/social spaces.
A NETWORK-BASED DAC OPTIMIZATION PROTOTYPE SOFTWARE 2 (1).pdfSaiReddy794166
The International Journal of Engineering and Science and Research is online journal in English published. The aim is to publish peer review and research articles without delay in the developing in engineering and science Research.The International Journal of Engineering and Science and Research is online journal in English published. The aim is to publish peer review and research articles without delay in the developing in engineering and science Research.
The Design of an MVB Communication Controller Based on an FPGAIJRESJOURNAL
Abstract:According to the TCN standard (Train Communication Network Standard), in order to design the MVB controller simply and quickly, this paper presents an new design idea, which avoids the cumbersome process in the traditional design process and makes the MVB controller design become efficient and concise. The design realizes the real-time protocol associated with the multifunction vehicle bus (MVB) device and the design process for all layers associated with the MVB device link layer. The design is a concurrent, easy-to-parameter and reconfigurable top-down design process that is implemented through programmable gate arrays (FPGAs) and related circuits. The design provides an efficient and rigorous design idea, and was verified by some experiments successfully.
An ethernet based_approach_for_tm_data_analysis_v2Priyasloka Arya
Testing and performance evaluation of flight vehicles largely depends on the data gathered through telemetry. Tele-metered data describes the internal story of device under test. As the tele-metered data is transmitted to ground receiving stations through radio frequency and Inter Range Instrumentation Group (IRIG) standard data format are well known, anybody who is tuned to transmitted frequency, can receive data and minimal information about the format can reveal the total information of device under test. To deal with this situation, current trend is to encrypt the mission critical information on board before transmitting. In this paper, the authors have discussed the advantage of Local Area Network (LAN) based Telemetry base band system which provides scalability, modularity, and flexibility to the user for the analysis of encrypted data.
The peer-reviewed International Journal of Engineering Inventions (IJEI) is started with a mission to encourage contribution to research in Science and Technology. Encourage and motivate researchers in challenging areas of Sciences and Technology.
Design and Implementing Novel Independent Real-Time Software Programmable DAQ...Editor IJCATR
The crucial features of many demanding applications like industry and aerospace are data acquisition and telemetry. It is
vital to observe and analyse the real time performance, in launch vehicle systems,so that designs can be certified and tuneablefactors
could be regulated to intensification the act and competence. At present used DAQ structures are of augmented size, weight and turn out
to be exorbitant and power hungry. This article introduce a new mission-independent real time software programmable DAQ system
using multipurpose MCU and sigma delta ADCs are planned,taking into account size, weight, costand act without compromiseon
precision, firmness and drift act. Additional digital filtering steps are also added to progress the system act. This system isproficientfor
directconnectionswithdiverse pressure and temperature sensors whichinterfaces 32 low frequency channel and two high frequency
channels. The system planned operates in two modes; one is data acquisition mode and another is program mode. Operativepower
lesseningmethods and wireless interface protocol between diverse data acquisition modules is also affected upon as avenues for future
work.
8 bit Microprocessor with Single Vectored InterruptHardik Manocha
SoC consists of instruction memory, main memory and microprocessor unit. Instructions are fetched using PC and as per the instruction, main memory and register memory are accessed. 8 bit data bus is built. Working on developing programs to look for microprocessor operation.
In this Office Security System project, image is captured by web camera, detected image is
compared with original data base for face recognition. If recognized image is known face then open the
door, otherwise sent the unknown image through LAN for displaying a new visitor, to all over the
network in various Departments. If the new visitor is to any one of the related person of staff member
then he will give the instruction to open door for the same visitor.
The Cortex M-3 system can measure all kind of electrical and thermal parameters RTD and so on. The
measured data can be displayed on the LCD/TFT of the system and at the same time can be transmitted
through RS – 485, or Ethernet N/W to remote DAS or DCS monitoring system by using mod bus / RTU
or mod bus / TCP control, The system has N/W with long distance communication function which can
ensure the disturbance rejection capabilities and reliability of the communication network. Hardware
platform use 32 bit embedded arm microprocessor and software platform use the microcontroller and
real time multitasking operating system which is open source. By using all these different port’s
functioning parameters of the Cortex M-3, Office Security System is developed
1. Development of MATLAB Software to Control Data Acquisition from a
Multichannel Systems Multi-Electrode Array
Erik Messier, Behnaz Ghoraani∗, Ph.D.
Abstract— A Multichannel Systems (MCS) microelectrode ar-
ray data acquisition (DAQ) unit is used to collect multichannel
electrograms (EGM) from a Langendorff perfused rabbit heart
system to study sudden cardiac death (SCD). MCS provides
software through which data being processed by the DAQ unit
can be displayed and saved, but this software’s combined utility
with MATLAB is not very effective. MCSs software stores
recorded EGM data in a MathCad (MCD) format, which is then
converted to a text file format. These text files are very large,
and it is therefore very time consuming to import the EGM data
into MATLAB for real-time analysis. Therefore, customized
MATLAB software was developed to control the acquisition of
data from the MCS DAQ unit, and provide specific laboratory
accommodations for this study of SCD. The developed DAQ
unit control software will be able to accurately: provide real
time display of EGM signals; record and save EGM signals in
MATLAB in a desired format; and produce real time analysis
of the EGM signals; all through an intuitive GUI.
Index Terms— Data Acquisition, Perfused Rabbit Heart,
Multichannel EGM, MATLAB, Sudden Cardiac Death, MAT-
LAB
I. INTRODUCTION
To study sudden cardiac death (SCD) using a Lagendorff
perfused rabbit heart system, hardware and software needed
to be developed. This paper discusses the development of
the software required for this study. To acquire electro-
gram (EGM) data from the perfused heart a Multichannel
Systems (MCS) 32-channel microelectrode array data ac-
quisition (DAQ) unit is utilized in conjunction with other
developed hardware. MCS provides software through which
data acquired by the MCS DAQ unit can be displayed
and saved, but this software stores data in a MathCad
(MCD) format, which is very time consuming to import into
MATLAB for further analysis. In order to provide a more
convenient way of storing and accessing the acquired data,
and preforming real-time analysis on the data, MATLAB
software was developed to control the acquisition of data
from the MCS DAQ unit. The development of the MATLAB
DAQ software was accomplished through a collaboration
between functions offered by MCS, in a dynamic link library
(DLL), and orignally produced functions and algorithms.
The originally produced functions and algorithms provide: 1)
formatting of the recorded data, 2) storage of the formattted
data, 3) real-time display and analysis of the data, 4) an
intuitive graphical user interface (GUI) through which the
entire developed software can be packaged.
Rochester Institute of Technology, Biomedical Engineering Department.
∗Corresponding Author: Rochester, 160 Lomb Memorial Drive Rochester,
NY 14623-5604. Email: bghoraani@ieee.org
II. METHODS
In this section, user interface, recording and handling of
data, and real-time data display and analysis are discussed.
A. Structure of developed GUI
Fig. 1. The developed GUI has the ability to adapt the handling of data
depending on the selected CHANNELS and MODE as needed by the user.
Fig. 1 shows the GUI for the developed software. First,
the user selects the GUI parameters, MODE and CHANNELS
whose data will have a real time display. Then, Record
is selected, and all GUI objects and handles are finalized.
The software then initiates operation of the MODE that
has been selected, Manual, Automated, or Viewer mode.
MCS functions: create necessary DAQ unit objects; check
the status of the MCS DAQ unit, whether there is a MCS
DAQ unit attached to the computer or not; and initialize
FIFO queues. The MCS functions then begin acquisition
from the DAQ unit into each channels respective queue. In a
continuous loop: a defined amount of data is read from each
queue, stored in a Buffer, and is formatted and processed;
data from channels that were selected to have a display is
then plotted; and heart rate and time elapsed are calculated
and displayed on the GUI window. This loop continues until
the user has stopped recording, un-toggled the Record button.
Once the loop has been terminated, the signal data and other
peripheral data, which will be identified later, is stored as an
object and saved to a user input filename and directory.
B. Data Recording and Handling
Fig. 2 is a high level representation of EGM data flow
acquired from a perfused rabbit heart through the MCS
DAQ unit. The sections, marked with numbers on Fig. 2,
2. Fig. 2. High level representation of data acquisition control software operation.
indicate the main operations, which will be described in
the following. Steps 2-4 only show one iteration of data
acquisition for one channel, the nth channel. In order to
proceed to step 5, steps 1-4 must be completed for all
recording channels in the MCS DAQ unit. Multiple iterations
of steps 2-6 must be preformed to provide real-time data
for display and analysis, because this software creates a
continuous signal by appending shorter, subsequent, signals
together which are referred to as Buffers. Each subsequent
Buffer is a set of data that corresponds to the signal data
recorded from the MCS DAQ unit for the resulting amount
of time since the last Buffer was produced.
B.1) Initialization and Formatting of FIFO Queues: MCS
functions are used to create and format a FIFO queue for
each channel, and to start acquiring data from the DAQ unit
and placing each channels acquired data into its respective
queue. FIFO queues are useful for real time display and
analysis, because data is stored chronologically; the first
data to enter the FIFO queue is the first data to exit. For
this software’s purpose, the queues were preallocated with
zeroes to a size of 500,000 elements to prevent data from
overflowing from the DAQ unit causing a loss of excess
data. The sampling rate from the MCS DAQ unit into the
queues was set to 2,000 Hz; this rate was chosen, because
it is not too high such that the software’s data handling
would be slowed down by the large sets of data being
processed, but is also not too low such that features of the
recorded data are being missed, refer to Nyquist Frequency.
For more information about the functions used to preform
this operation, refer to MCS DLL [1].
B.2) Reading From FIFO Queues: A specific amount of
signal data, 2,000 elements, is read from each channels
FIFO queue, in the form of unsigned 16 bit integers (i.e.,
uint16), and is stored in a Buffer for that channel. This
is operation is performed in a serial manner. In a loop,
all channels are read sequentially using the MCS function
ChannelBlock ReadFramesUI16 [1]. A simple algorithm is
used to make the loop wait until enough data is present in
the FIFO queue that is being read from before the Buffer is
parsed from it. For detailed information refer to ”Reading
Data from FIFO Queues” Algorithm below.
Algorithm 1: Reading Data from FIFO Queues
Given: ChannelBlock ReadFrames: MCS function that returns
how much data is in the FIFO queue.
Input: Channel: the channel that is being read from.
Frequency: rate at which data was sampled from the MCS DAQ unit.
Ready = 0;
while Ready = 0 do
DataAmount = ChannelBlock ReadFrames(Channel);
if DataAmount is greater than or equal to Frequency then
Ready = 1;
end
end
Output: Proceed to read data from channel’s FIFO queue
B.3) Reformatting Buffer: The Buffer produced from pre-
vious step is reformatted from uint16 to double (i.e., signed
64 bit integers) format, and the data is gain compensated, so
that it is scaled at the level of micro volts using Eq. (1).
Buffer =
double (Buffer) − 32768
1.5720
(1)
The value of 32,768 is subtracted from the Buffer data to
correct the data’s zero. Since the data is delivered from the
queue in uint16 form, the data ranges between the values 0
and 65,535. To correct the zero of the data, 32,768 must be
subtracted so that the new range of the data is from negative
32,768 to positive 32,768. From Eq. (1), 1.5720 is divided
from the data to compensate for the gain of the system, this
3. will be further elaborated upon in the experiment discussion
portion of the paper.
B.4) Data Storage: Proceeding B.3, depending on the
selected MODE the data Buffer is either stored or is not
stored. There are three MODEs Manual, Viewer, and Auto-
mated (Auto). Manual MODE is used to continuously record
data. Viewer MODE is used only to visualize the data,
and not record it. Auto MODE utilizes both Manual and
Viewer MODEs, Auto-Record and Auto-View respectively, to
continuously record multiple trials of data.
Manual MODE stores data in a one row array, because
only one trial is preformed. Auto-Record stores data in a
multiple row array, each row corresponds to the trial number
(i.e. the first row is the trials recorded data and the ith row
is the ith trial). In Fig. 2, For Manual MODE, 6 iterations
of data acquisition have occurred before the latest signal
Buffer was appended. In Auto-Record, i trials have been
recorded and 6 iterations on the most recent trial had been
recorded until the most recent signal Buffer was appended
to the ith row of the stored signal. This stored data array, at
the termination of the function, for both Auto and Manual
MODEs, will be saved in an object format which will also
contain: timestamps (ts) for the beginning of each trial, the
sampling rate (F) of the recordings, the calculated heart rates
(HR) for the recordings, and the time interval (Tint) for each
trial.
B.5) Data Display and Analysis: Once steps B.1-B.4 have
been completed for all the channels, then real time display
and analysis of the EGM signals is performed as will be
explained in the following.
C. Real-Time Display and Analysis of Data
C.1) Real-Time Display: The most recent signal buffer pro-
duced, the signal buffer for that iteration of data acquisition,
is used to plot the signal received for each channel that is
selected to be plotted from Channels. Each selected channel
is sub plotted on the same MATLAB figure; to optimize
the area of plots on the figure for a variable number of
plots, conditions were made such that subplots are added
to a column until four subplots are in that column. Once
there are four subplots in a column any additional subplots
are added to the next column.
C.2) Real-Time Analysis: The heart rate of the elec-
trocardiogram (ECG) signals, derived from EGM, is then
calculated with a commonly practiced method; refer to Heart
Rate Calculation algorithm.
Kurtosis is the measure of the ”peakedness” of a probabil-
ity distribution [2]. Kurtosis is greater when there are more
infrequent, extreme amplitude, deviations from the mean of
a set of data; and vice versa [2]. Therefore kurtosis is used
to differentiate between channels experiencing a lot of noise,
and channels that arent experiencing a lot of noise. Noise has
more frequent deviations from the mean of a set of signal
data, therefore its distribution is more Gaussian [2]. An ECG
signal has more infrequent deviations from the mean of a set
of signal data, therefore its distribution is Super-Gaussian [2].
Only data from one channel is used to calculate heart rate,
therefore the channel whose data has the greatest kurtosis is
used.
Algorithm 2: Heart Rate Calculation
Input: ChannelRate: Buffer of channel that was calculated to
have the maximum kurtosis of all channels.
Frequency: rate at which data was sampled from the MCS DAQ unit.
1) Calculate Daubechie’s wavelet transform of ChannelRate using
MATLAB function cwt;
2) Square calculated wavelet transform;
3) Find maximum peak of squared transform;
4) Find all peaks, and if a peak is within a 50 percent thrshold of
max then add 1 to number of peaks;
5) Divide length of ChannelRate by frequency to find the time
duration of the buffer;
6) Divide number of peaks by time duration;
Output: Calculated heart rate
Wavelet transforms, of the signal being used to calculate
heart rate, are applied to reduce noise of the signal and to
furthermore exaggerate the R-peaks of the ECG from the
rest of the signal [3], [4]. The following continuous wavelet
transform (CWT) equation, Eq. (2 )was used if the form of
the MATLAB native function [1], [3].
CWT (a, τ) =
1
√
a
s (t) Ψ
t − τ
a
dt (2)
In Eq. (2): a is the scaling factor used to strech and compress
the mother wavelet (ψ), τ is the translation factor, which
translates the mother wavelet along the axis of the signal,
and s(t) is the signal [3]. The mother wavelet used to
accomplish this wavelet transform was a Daubechies (db10)
wavelet [3], [4]. This wavelet was chosen because of its
relatable morphology to the ECG waveform. The scaling
factor imposed in this wavelet transform was 3, which
allowed for QRS extraction from the ECG.
Once the signals have been plotted, HR and the time
elapsed for the recording has been calculated and displayed
on the GUI, the function returns to step 2 on Fig. 2, if Record
on the GUI has not been turned off. Throughout the entire
process previously described data was continuously being
read from the MCS DAQ and added to the FIFO queues. In
returning to step 2, the new data that has been added to the
FIFO queues must simply be read, and the entire process
described is performed again. If Record is turned off the
functions stops at the termination of its current iteration of
the process described, and saves the data to the user input
filename and directory.
III. EXPERIMENTS AND RESULTS
Three experiments were performed to test the reliability
of the data being acquired, and the real-time analysis being
preformed through the developed DAQ software: a Delay
Test, an MCS software comparison test; and a test of the
calculated HR.
Delay Test: To investigate delay in signals recorded between
different channels a cross correlation (xcorr) analysis was
preformed. The results of this xcorr analysis are shown in
Fig. 3. The lag positions were calculated using the native
MATLAB xcorr function. Lag refers to the amount of
displacement of one signal along the time domain required to
4. be most correlated, synchronized, to another signal. In Fig.
3 an MCS Me/W-SG signal generator was used to produce a
12.5 Hz sinusoid. All of the calculated lag positions were 0,
which indicates that all of the signals are lined up on the time
domain. 15 trials were preformed on the 12.5 Hz sinusoid,
and other generated signals (i.e., ECG, Hippocampal Slice,
and other sinusoids), and all trials had the same results.
Fig. 3. Delay Test: Test preformed on 12.5 Hz sinusoid. channel numbers
are in orange, and calculated lag positions of max correlation between
signals are in blue. A signal was only generated on 8 of 32 channels, all of
the odd channel numbers from 15-29 including channels 15 and 29.
MCS Comparison: The MCS DAQ software, MC Rack,
was considered to be the precedent for the developed soft-
ware’s acquired data. In this experiment morphology, fre-
quency, and amplitude of generated signals acquired through
both MATLAB and MC Rack were compared. This experi-
ment consisted of 10 trials in which a 1 Hz, 2.0 mV ECG was
generated using an MCS Me/W-SG signal generator. The re-
sults of one trial are shown in Fig. 4. The signals recorded in
Fig. 4 relate to 3 seconds of data, over which both MC Rack
and MATLAB had recorded 3 waves resulting in an effective
calculated frequency for each signal of 1 Hz. The signals in
Fig. 4 have the same frequency and relatable morphology,
but the amplitudes of the signal recorded through MATLAB
are greater than MC Rack’s. This amplitude difference is
a result of a gain discrepancy between the two recording
medium. The amplitudes of the signal recorded through the
developed MATLAB software were calculated to be a factor
of 1.5720 ± 0.0457 greater than the amplitudes produced
by MC Rack. To account for gain discrepancy the signal
recorded through MATLAB is divided by 1.5720. After gain
compensation, both media produce the same signal, therefore
the signals recorded through MATLAB are reliable, since the
signals recorded through MC Rack are considered reliable.
Fig. 4. MCS Comparison: In BLUE is a generated ECG acquired through
MATLAB. In RED is the same generated ECG acquired through MC Rack.
Signals are out of phase, because they were recorded separately.
HR Test: As mentioned earlier, a commonly practiced
method is used to calculate HR. However, to test the accuracy
of this calculation, the following experiment was preformed.
ECG data was acquired from a Langendorff perfused rat
heart in which all electrodes were placed relatively in the
same location, and data was acquired using MC Rack. Chan-
nel 9 was calculated to have the signal with the max kurtosis
and channel 25 had the least kurtosis. Fig. 5 shows the
recorded signals from the max and min kurtosis channels
above and below respectively. Fig. 5 illustrates the impor-
tance of using kurtosis; channel 10’s signal is noticeably
less noisy, which makes it easier to extract ECG features for
a HR calculation. Via manual calculation for channel 10’s
signal, there are 25 waves over 5 seconds therefore the HR
is 300 beats per minute. Using the developed HR calculation
algorithm the output was calculated to be 300 beats per
minute, as shown in Fig. 6. Therefore the HR calculation
algorithm is accurate.
Fig. 5. Above, in RED, is the rat heart ECG signal recorded on channel
9. Below, in GREEN, is the rat heart ECG signal recorded on channel 25.
Fig. 6. HR output of the HR calculation algorithm created in MATLAB
IV. CONCLUSIONS
The developed software is able to accurately: provide real
time display of ECG signals; record and save ECG signals in
MATLAB in a desired format; and produce real time analysis
of the ECG signals; and all through an intuitive GUI. The
methodology and process used to achieve these capabilities
has been discussed and explained. Important functions and
algorithms used within the software have been summarized
and provided. The reliability of the signals recorded and
real-time analysis preformed through the software has been
discussed: there is no delay in recorded signals between dif-
ferent channels, the signals recorded through the developed
software are equivalent to signals recorded through MCS’s
DAQ software, and the HR calculation is accurate. This
software provides a more convenient means through which
to analyze signals from the MCS DAQ unit in MATLAB,
and is an intuitive and useful tool in the laboratory for the
real-time analysis, display, and recording of ECG signals.
REFERENCES
[1] M. Systems, “Mcsusbnet.dll for mcs usb devices,”
http://www.multichannelsystems.com/applications.
[2] L. Sharma, S. Dandapat, and A. Mahanta, “Kurtosis based multichannel
ecg signal denoising and diagnostic distortion measures,” in TENCON
2009-2009 IEEE Region 10 Conference. IEEE, 2009, pp. 1–5.
[3] G. Cornelia and R. Romulus, “Ecg signals processing using wavelets,”
in IEEE, proceedings of the fifth laserd International conference May,
2005.
[4] C. Saritha, V. Sukanya, and Y. N. Murthy, “Ecg signal analysis using
wavelet transforms,” Bulg. J. Phys, vol. 35, no. 1, pp. 68–77, 2008.