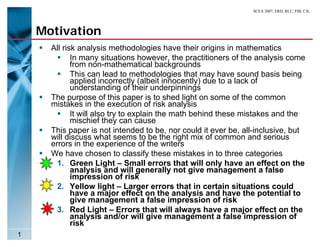
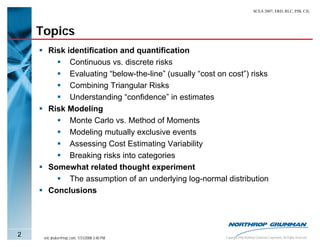
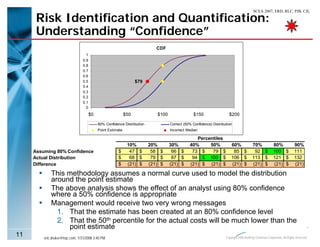
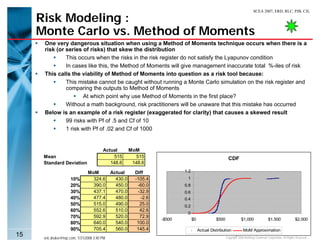
The document discusses common pitfalls in popular risk analysis methodologies. It identifies mistakes in risk identification and quantification, such as characterizing risks as continuous when they are discrete, or vice versa. It also discusses errors in modeling below-the-line risks, combining triangular distributions, and misunderstanding the meaning of "confidence" in estimates. The document aims to explain these issues and their potential effects on misleading management with inaccurate risk analyses.
- Outsourcing has become common for many U.S. businesses as a way to reduce costs, though it also carries risks that must be carefully considered.
- A modified failure mode and effects analysis (FMEA) can help businesses evaluate potential risks of outsourcing options. Risks are rated based on their opportunity, probability, and severity to calculate a risk priority number.
- Analyzing risks using the FMEA process and Pareto chart allows companies to identify high-risk failures and develop actions to mitigate those risks, helping improve decision making around outsourcing.
The Truth About Fat Tails And Black Swansmarc_gross
This document discusses how FinAnalytica can help hedge fund investors in the current market crisis by analyzing tail risk and black swan events. It argues that normal distributions do not accurately capture risk and that downside risk measures like expected tail loss are more informative for investors than traditional measures like value at risk. FinAnalytica uses statistical modeling techniques on manager returns to provide meaningful insights into risk drivers and anticipate how different market scenarios could impact performance.
1) This document outlines an agenda for a workshop on programmatic risk management that covers topics such as risk management principles, basic statistics, Monte Carlo simulation theory, using Microsoft Project and Risk+ software, risk ranking, and building a credible schedule.
2) It discusses five key principles of managing programmatic risk: having a strategy rather than relying on hope, understanding that single point estimates are inaccurate without variance data, integrating cost, time and technical performance, using a risk management process and model rather than "driving in the dark," and ensuring effective risk communication.
3) The mechanics section describes how to set up a Risk+ simulation integrated with
NASA uses two complementary processes for risk management: risk-informed decision making (RIDM) and continuous risk management (CRM). RIDM emphasizes using risk analysis to make risk-informed decisions across dimensions like safety, cost, and schedule. CRM manages risks associated with implementation and uses risk statements to document risks across multiple dimensions. Current risk analysis methods often fail to provide a complete risk picture by only considering risks one dimension at a time. MRisk addresses this by analyzing risks across all dimensions simultaneously using anchor points and Mahalanobis distance, providing a more objective and accurate assessment of total project risk.
1) Operational risk appetite is a subject of debate as it is difficult to reduce to a single monetary value given its nature is affected by management culture and external factors.
2) A firm's risk appetite should be approved by the board and reflect an acceptable trade-off between risk and returns, commonly defined as the amount of risk a firm is willing to take for a given risk-reward ratio.
3) Expressing operational risk appetite can start qualitatively through a firm's risk and control assessment likelihood and impact scales, and then develop more quantitatively over time through indicators and modeling.
1) Fear is one of the main obstacles that prevents patients from undergoing refractive surgery procedures. Patients fear pain, complications that could lead to blindness, and the procedure not working for their vision needs.
2) Doctors often address patient fears from a clinical perspective using statistics about complication rates, but this does little to reassure patients. Patients view risks to their vision emotionally, similar to how parents view risks to their children.
3) New technologies like customized LASIK and femtosecond lasers have helped reduce fears by making procedures safer and more precise, helping increase refractive surgery rates since 2003. Building trust between providers and patients is key to overcoming fear.
Advantages of Regression Models Over Expert Judgement for Characterizing Cybe...Thomas Lee
Expert Judgment is the foundation of many risk assessment methodologies. But research is robust on the inaccuracy of Expert Judgment with regards to rare events—and large data breach events are rare. Regression models, which are a statistical characterization of cross-company historical events are substantially more accurate than expert judgment or even models with expert judgment as a foundation.
This document outlines the agenda for a presentation on risk-informed decision making (RIDM). The presentation will cover:
1. The inherent riskiness of current uncertain times and the need to evolve risk management approaches to remain relevant.
2. An explanation of what RIDM is and why it is important now, given that continuous risk management (CRM) is already practiced.
3. Examples of when and why to use RIDM in addition to discussing the actual steps involved in conducting RIDM.
The presentation aims to demonstrate how RIDM can help risk management practices evolve to address a more dynamic environment with changing mission objectives and resources. RIDM is presented as a complement to
Risk and interdependencies in critical infrastructuresSpringer
This chapter defines key concepts used in analyzing risks and interdependencies, including uncertainty, risk, reliability, vulnerability, resilience, and interdependency. It discusses how risks can be expressed as a set of triplets combining the probability and severity of potential events. Risk registers are introduced as a way to document risks using qualitative probability and consequence categories. The chapter also defines societal critical functions, infrastructure, and input factors that support basic needs in a society.
This document provides an agenda for a crash course on managing cyber risk using quantitative analysis. It covers concepts like risk, uncertainty, and risk management approaches. It then discusses qualitative, semi-quantitative, and quantitative risk analysis methods. Monte Carlo simulation and PERT distributions are presented as tools for quantitative analysis. Exercises are provided to demonstrate applying these concepts, including estimating the risk associated with unencrypted laptops being lost or stolen.
The document presents an Aviation System Risk Model (ASRM) developed by NASA and the FAA to assess risks from low probability, high consequence aviation accidents. The ASRM uses Bayesian belief networks to model causal factors and their probabilistic relationships leading to different types of accidents. It was developed through analyzing accident case studies and expert knowledge elicitation. The model identifies precursors from accident reports and inserts new technologies to evaluate their potential risk mitigation effectiveness.
The document presents a formalized version of the precautionary principle that distinguishes between regular risk and the risk of total ruin or systemic harm. It argues the precautionary principle should only be applied in cases of potential ruin, not regular risk. Ruin involves irreversible harm to an entire system, while regular risk involves localized harm. The risk of ruin justifies a precautionary approach rather than cost-benefit analysis, since the potential harm of ruin is effectively infinite. The document also discusses how complex systems can exhibit unpredictable "fat tail" behaviors that increase the risk of unforeseen ruin.
Existential Risk Prevention as Global PriorityKarlos Svoboda
This document discusses existential risk, which is defined as risks that could cause human extinction or permanently and drastically curtail the potential of humanity. The author makes the case that existential risk reduction should be a top global priority for the following reasons:
1) Even small reductions in existential risk have enormous expected value due to the astronomical potential for future human life and development.
2) The largest existential risks are anthropogenic and linked to potential future technologies like advanced biotech, nanotech, and AI.
3) A moral argument can be made that existential risk reduction is more important than any other global issue due to the infinite value of the future of humanity.
4) Efforts should
Kate Stillwell from the GEM Foundation presented on modeling resilience in GEM. GEM uses an open-source platform called OpenQuake to model global earthquake risk through an integrated approach considering hazard, exposure, vulnerability, and resilience. Resilience factors are used to adjust physical risk estimates to account for social vulnerability and a region's ability to prepare for and recover from disasters. Future work will aim to develop dynamic models of resilience that can simulate post-event decisions and evaluate their effectiveness over time.
NASA uses probabilistic risk assessment (PRA) to evaluate risk for its projects. PRA involves identifying potential accident scenarios, determining their probabilities of occurring, and estimating their consequences. NASA has applied PRA to projects like the International Space Station, Space Shuttle, and plans to use it in designing new vehicles like the Crew Exploration Vehicle. PRA helps NASA prioritize safety, understand leading risks, and make informed decisions to improve safety and mission success.
The document discusses risk assessment and management in port safety. It describes the three main activities: 1) assessing risk in terms of probability and consequences, 2) managing risk through options and tradeoffs, and 3) considering the impact of decisions on future risks. Several analytical tools are used for risk assessment, including fault tree analysis, event tree analysis, and failure modes and effects analysis. Safety indicators like accidents and precursors (near misses) are also discussed. The value of preventing human losses through willingness to pay approaches is covered. Accidents can have wider effects beyond direct costs through changes in public behavior or organizational decisions.
Adopting the Quadratic Mean Process to Quantify the Qualitative Risk AnalysisRicardo Viana Vargas
The objective of this paper is to propose a mathematical process to turn the results of a qualitative risk analysis into numeric indicators to support better decisions regarding risk response strategies.
Using a five-level scale for probability and a set of scales to measure different aspects of the impact and time horizon, a simple mathematical process is developed using the quadratic mean (also known as root mean square) to calculate the numerical exposition of the risk and consequently, the numerical exposition of the project risks.
This paper also supports the reduction of intuitive thinking when evaluating risks, often subject to illusions, which can cause perception errors. These predictable mental errors, such as overconfidence, confirmation traps, optimism bias, zero-risk bias, sunk-cost effect, and others often lead to the underestimation of costs and effort, poor resource planning, and other low-quality decisions (VIRINE, 2010).
The document summarizes key concepts around supply chain risk management. It discusses how globalization has increased supply chain complexity and vulnerability. Supply chain risks can come from various sources and be internal or external to the supply chain. Different frameworks categorize risks by impact/likelihood, or by source within the organization, network, or environment. Managing risks requires understanding potential consequences and proactively preparing for both common and rare disruptive events.
The document provides an overview of project risk management processes and techniques. It discusses qualitative and quantitative risk analysis methods, such as probability/impact matrices and decision trees. Response strategies like risk avoidance, mitigation, and acceptance are also covered. The document aims to equip project managers with tools and best practices for identifying, assessing, and responding to risks throughout the project life cycle.
SURVEY ON LINK LAYER ATTACKS IN COGNITIVE RADIO NETWORKSijcseit
Cognitive Radio Network (CRNs) is a novel technology for improving the future bandwidth utilization.
CRNs have many security threats due its opportunistic exploitation of the bandwidth. Each layer of the
CRNs consisting of several attacks starting from the physical layer and moving up to the transport layer.
This paper concentrates on the Link layer attacks. The future work uses Signature based Authentication
Coded Intrusion Detection Scheme to detect the Byzantine attack. It works in asynchronous system like
Internet and incorporates optimization to improve detection response time.
The precautionary principle fragility and black swans from policy actionsElsa von Licy
This document discusses formalizing the precautionary principle within a statistical framework. It distinguishes between regular risk management, where harm is localized, and situations warranting the precautionary principle, where there is a risk of total systemic ruin or irreversible damage. The precautionary principle should only be applied in extreme cases where potential harm could involve total ruin, such as extinction of human life or all life on Earth. It outlines how small risks that appear reasonable can accumulate over time and decisions to inevitably lead to harm, making a risk of ruin unsustainable, even if seen as a "one-off" decision.
This document discusses a model for risk analysis and mitigation that accounts for dependencies between risks. It introduces concepts like Risk Influence Factors, risk networks, and risk prioritization. The model involves discovering risks through a "what if, why" analysis. It then generates a risk network by analyzing how risks within and across categories influence each other. Risks in the network are prioritized based on their costs, benefits, and other factors. Dependencies between risks are also analyzed to inform mitigation efforts over time.
International Journal of Computer Science, Engineering and Information Techno...ijcseit
Cognitive Radio Network (CRNs) is a novel technology for improving the future bandwidth utilization.
CRNs have many security threats due its opportunistic exploitation of the bandwidth. Each layer of the
CRNs consisting of several attacks starting from the physical layer and moving up to the transport layer.
This paper concentrates on the Link layer attacks. The future work uses Signature based Authentication
Coded Intrusion Detection Scheme to detect the Byzantine attack. It works in asynchronous system like
Internet and incorporates optimization to improve detection response time.
SURVEY ON LINK LAYER ATTACKS IN COGNITIVE RADIO NETWORKSijcseit
Cognitive Radio Network (CRNs) is a novel technology for improving the future bandwidth utilization.
CRNs have many security threats due its opportunistic exploitation of the bandwidth. Each layer of the
CRNs consisting of several attacks starting from the physical layer and moving up to the transport layer.
This paper concentrates on the Link layer attacks. The future work uses Signature based Authentication
Coded Intrusion Detection Scheme to detect the Byzantine attack. It works in asynchronous system like
Internet and incorporates optimization to improve detection response time.
Stability of the world trade web over timeScott Pauls
My talk for a conference on Emergent Risk at Princeton in 2012. The paper discusses notions of stability and robustness in networks, with applications to the world trade web.
This document provides an overview of key concepts related to risk management, including definitions of risk, vulnerability, probability, and impact. It discusses approaches to assessing risk such as quantifying probability and impact, analyzing threats and vulnerabilities, and measuring the effectiveness of security controls. The document is authored by Phillip Banks and copyrighted by The Banks Group Inc., which provides risk consulting and security services. It references numerous standards and guidelines for risk and security management.
The document compares the operational complexity and costs of the Space Shuttle versus the Sea Launch Zenit rocket. [1] The Space Shuttle was designed for performance but not operational efficiency, resulting in costly ground, mission planning, and flight operations. [2] In contrast, the Zenit rocket was designed from the start to have automated and robust processes to keep operations simple and costs low. [3] The key lesson is that designing a launch system with operational requirements in mind from the beginning leads to much more efficient operations long-term.
The document provides an overview of project management and procurement at NASA. It discusses the key skills required for project managers, including acquisition management. It notes that 80-85% of NASA's budget is spent on contracts, and procurement processes are complex and constantly changing. The document outlines some common contract types and how they allocate risk between the government and contractor. It also discusses the relationship between contracting officers and project managers, and how successful procurement requires effective communication rather than direct control or authority.
The document introduces the NASA Engineering Network (NEN), which was created by the Office of the Chief Engineer to be a knowledge management system connecting NASA's engineering community. The NEN integrates various tools like a content management system, search engine, and collaboration tools. It provides access to key knowledge resources like NASA's Lessons Learned database and engineering databases. The NEN is working to expand by adding more communities, engineering disciplines, and knowledge repositories.
Laptops were first used in space in 1983 on the Space Shuttle, when Commander John Young brought the GRiD Compass portable computer on STS-9. Laptops are now widely used on the Space Shuttle and International Space Station for tasks like monitoring spacecraft systems, tracking satellites, inventory management, procedures viewing, and videoconferencing. Managing laptops in space presents challenges around cooling, power, and software/hardware compatibility in the harsh space environment.
Laptops were first used in space in 1983 on the Space Shuttle, when Commander John Young brought the GRiD Compass portable computer on STS-9. Laptops are now widely used on the Space Shuttle and International Space Station for tasks like monitoring spacecraft systems, planning rendezvous and proximity operations, inventory management, procedure reviews, and communication between space and ground via software like WorldMap and DOUG. Managing laptops in space presents challenges around hardware durability, cooling, and software/data management in the space environment.
This document discusses the use of market-based systems to allocate scarce resources for NASA missions and projects. It provides examples of how market-based approaches were used for instrument development for the Cassini mission, manifesting secondary payloads on the space shuttle, and mission planning for the LightSAR Earth imaging satellite project. The document finds that these applications of market-based allocation benefited or could have benefited from a decentralized, incentive-based approach compared to traditional centralized planning methods. However, it notes that resistance to new approaches and loss of managerial control are barriers to adoption of market-based systems.
The Stardust mission collected samples from comet Wild 2 and interstellar dust particles. It launched in February 1999 and encountered Wild 2 in January 2004, collecting dust samples in aerogel. It returned the samples to Earth safely in January 2006. The spacecraft used an innovative Whipple shield to protect itself from comet dust impacts during the encounter. Analysis of the Stardust samples has provided insights about comet composition and the early solar system.
This document discusses solutions for integrating schedules on NASA programs. It introduces Stuart Trahan's company, which provides Earned Value Management (EVM) solutions using Microsoft Office Project that comply with OMB and ANSI requirements. It also introduces a partner company, Pinnacle Management Systems, that specializes in enterprise project management solutions including EVM, project portfolio management, and enterprise project resource management, with experience in the aerospace, defense, and other industries. The document defines schedule integration and describes some methods including importing to a centralized Primavera database for review or using Primavera ProjectLink for updates, and challenges including inconsistent data formats and levels of detail across sub-schedules.
The document discusses NASA's implementation of earned value management (EVM) across its Constellation Program to coordinate work across multiple teams. It outlines the organizational structure, current target groups, and an EVM training suite. It also summarizes lessons learned and the need for project/center collaboration to integrate schedules horizontally and vertically.
This document summarizes a presentation about systems engineering processes for principle investigator (PI) mode missions. It discusses how PI missions face special challenges due to cost caps and lower technology readiness levels. It then outlines various systems engineering techniques used for PI missions, including safety compliance, organizational communication, design tools, requirements management, and lessons learned from past missions. Specific case studies from NASA's Explorers Program Office are provided as examples.
This document discusses changes to NASA's business practices for managing projects, including adopting a new acquisition strategy approach and implementing planning, programming, and budget execution (PPBE). The new acquisition strategy involves additional approval meetings at the strategic planning and project levels to better integrate acquisition with strategic and budgetary planning. PPBE focuses on analyzing programs and infrastructure to align with strategic goals and answer whether proposed programs will help achieve NASA's mission. The document also notes improvements in funds distribution and inter-center transfers, reducing the time for these processes from several weeks to only a few days.
Spaceflight Project Security: Terrestrial and On-Orbit/Mission
The document discusses security challenges for spaceflight projects, including protecting space assets from disruption, exploitation, or attack. It highlights national space policy principles of protecting space capabilities. It also discusses trends in cyber threats, including the increasing capabilities of adversaries and how even unskilled attackers can compromise terrestrial support systems linked to space assets if defenses are not strong. Protecting space projects requires awareness of threats, vulnerabilities, and strategies to defend, restore, and increase situational awareness of space assets and supporting systems.
Humor can positively impact many aspects of project management. It can improve communication, aid in team building, help detect team morale issues, and influence leadership, conflict management, negotiation, motivation, and problem solving. While humor has benefits, it also has risks and not all uses of humor are positive. Future research is needed on humor in multicultural teams, its relationship to team performance, how humor is learned, and determining optimal "doses" of humor. In conclusion, humor is a tool that can influence people and projects, but must be used carefully and spontaneously for best effect.
The recovery of Space Shuttle Columbia after its loss in 2003 involved a massive multi-agency effort to search a wide debris field, recover crew remains and evidence, and compensate local communities. Over 25,000 people searched over 680,000 acres, recovering 38% of Columbia's weight. Extensive engineering investigations were conducted to identify the causes of failure and implement changes to allow the safe return to flight of Discovery in 2005.
This document summarizes research on enhancing safety culture at NASA. It describes a survey developed to assess NASA's safety culture based on principles of high reliability organizations. The survey was tailored specifically for NASA and has been implemented to provide feedback and identify areas for improvement. It allows NASA to benchmark its safety culture within and across other industries pursuing high reliability.
This document summarizes a presentation about project management challenges at NASA Goddard Space Flight Center. The presentation outlines a vision for anomaly management, including establishing consistent problem reporting and analysis processes across all missions. It describes the current problem management approach, which lacks centralized information sharing. The presentation aims to close this gap by implementing online problem reporting and trend analysis tools to extract lessons learned across missions over time. This will help improve spacecraft design and operations based on ongoing anomaly experiences.
This document discusses leveraging scheduling productivity with practical scheduling techniques. It addresses scheduling issues such as unwieldy schedule databases and faulty logic. It then discusses taming the schedule beast through using a scheduler's toolkit, schedule templates, codes to manipulate MS Project data, common views/filters/tables, limiting constraints, and other best practices. The document provides examples of using codes and custom views/filters to effectively organize and display schedule information.
This document describes Ball Aerospace's implementation of a Life Cycle and Gated Milestone (LCGM) process to improve program planning, execution, and control across its diverse portfolio. The LCGM provides a standardized yet flexible framework that maps out program activities and products across phases. It was developed through cross-functional collaboration and introduced gradually across programs while allowing flexibility. Initial results showed the LCGM supported improved planning and management while aligning with Ball Aerospace's entrepreneurial culture.
This document discusses the importance of situation awareness (SA) for project team members. It defines SA as having three levels: perception of elements in the current situation, comprehension of the current situation, and projection of the future status. Good team SA is achieved by turning individual SAs into shared SA through communication. Teams with strong SA prepare more, focus on comprehending and projecting, and maintain awareness through techniques like questioning assumptions and seeking additional information.
This document discusses theories of leadership and how a project manager's leadership style may impact project success depending on the type of project. It outlines early hypotheses that a PM's competence, including leadership style, is a success factor on projects. It presents a research model linking PM leadership competencies to project success, moderated by factors like project type. Initial interviews found that leadership style is more important on complex projects, and different competencies are needed depending on if a project is technical or involves change. Certain competencies like communication skills and cultural sensitivity were seen as important for different project types and contexts.
Building Production Ready Search Pipelines with Spark and MilvusZilliz
Spark is the widely used ETL tool for processing, indexing and ingesting data to serving stack for search. Milvus is the production-ready open-source vector database. In this talk we will show how to use Spark to process unstructured data to extract vector representations, and push the vectors to Milvus vector database for search serving.
Have you ever been confused by the myriad of choices offered by AWS for hosting a website or an API?
Lambda, Elastic Beanstalk, Lightsail, Amplify, S3 (and more!) can each host websites + APIs. But which one should we choose?
Which one is cheapest? Which one is fastest? Which one will scale to meet our needs?
Join me in this session as we dive into each AWS hosting service to determine which one is best for your scenario and explain why!
Best 20 SEO Techniques To Improve Website Visibility In SERPPixlogix Infotech
Boost your website's visibility with proven SEO techniques! Our latest blog dives into essential strategies to enhance your online presence, increase traffic, and rank higher on search engines. From keyword optimization to quality content creation, learn how to make your site stand out in the crowded digital landscape. Discover actionable tips and expert insights to elevate your SEO game.
TrustArc Webinar - 2024 Global Privacy SurveyTrustArc
How does your privacy program stack up against your peers? What challenges are privacy teams tackling and prioritizing in 2024?
In the fifth annual Global Privacy Benchmarks Survey, we asked over 1,800 global privacy professionals and business executives to share their perspectives on the current state of privacy inside and outside of their organizations. This year’s report focused on emerging areas of importance for privacy and compliance professionals, including considerations and implications of Artificial Intelligence (AI) technologies, building brand trust, and different approaches for achieving higher privacy competence scores.
See how organizational priorities and strategic approaches to data security and privacy are evolving around the globe.
This webinar will review:
- The top 10 privacy insights from the fifth annual Global Privacy Benchmarks Survey
- The top challenges for privacy leaders, practitioners, and organizations in 2024
- Key themes to consider in developing and maintaining your privacy program
“An Outlook of the Ongoing and Future Relationship between Blockchain Technologies and Process-aware Information Systems.” Invited talk at the joint workshop on Blockchain for Information Systems (BC4IS) and Blockchain for Trusted Data Sharing (B4TDS), co-located with with the 36th International Conference on Advanced Information Systems Engineering (CAiSE), 3 June 2024, Limassol, Cyprus.
CAKE: Sharing Slices of Confidential Data on BlockchainClaudio Di Ciccio
Presented at the CAiSE 2024 Forum, Intelligent Information Systems, June 6th, Limassol, Cyprus.
Synopsis: Cooperative information systems typically involve various entities in a collaborative process within a distributed environment. Blockchain technology offers a mechanism for automating such processes, even when only partial trust exists among participants. The data stored on the blockchain is replicated across all nodes in the network, ensuring accessibility to all participants. While this aspect facilitates traceability, integrity, and persistence, it poses challenges for adopting public blockchains in enterprise settings due to confidentiality issues. In this paper, we present a software tool named Control Access via Key Encryption (CAKE), designed to ensure data confidentiality in scenarios involving public blockchains. After outlining its core components and functionalities, we showcase the application of CAKE in the context of a real-world cyber-security project within the logistics domain.
Paper: https://doi.org/10.1007/978-3-031-61000-4_16
Unlocking Productivity: Leveraging the Potential of Copilot in Microsoft 365, a presentation by Christoforos Vlachos, Senior Solutions Manager – Modern Workplace, Uni Systems
In his public lecture, Christian Timmerer provides insights into the fascinating history of video streaming, starting from its humble beginnings before YouTube to the groundbreaking technologies that now dominate platforms like Netflix and ORF ON. Timmerer also presents provocative contributions of his own that have significantly influenced the industry. He concludes by looking at future challenges and invites the audience to join in a discussion.
UiPath Test Automation using UiPath Test Suite series, part 6DianaGray10
Welcome to UiPath Test Automation using UiPath Test Suite series part 6. In this session, we will cover Test Automation with generative AI and Open AI.
UiPath Test Automation with generative AI and Open AI webinar offers an in-depth exploration of leveraging cutting-edge technologies for test automation within the UiPath platform. Attendees will delve into the integration of generative AI, a test automation solution, with Open AI advanced natural language processing capabilities.
Throughout the session, participants will discover how this synergy empowers testers to automate repetitive tasks, enhance testing accuracy, and expedite the software testing life cycle. Topics covered include the seamless integration process, practical use cases, and the benefits of harnessing AI-driven automation for UiPath testing initiatives. By attending this webinar, testers, and automation professionals can gain valuable insights into harnessing the power of AI to optimize their test automation workflows within the UiPath ecosystem, ultimately driving efficiency and quality in software development processes.
What will you get from this session?
1. Insights into integrating generative AI.
2. Understanding how this integration enhances test automation within the UiPath platform
3. Practical demonstrations
4. Exploration of real-world use cases illustrating the benefits of AI-driven test automation for UiPath
Topics covered:
What is generative AI
Test Automation with generative AI and Open AI.
UiPath integration with generative AI
Speaker:
Deepak Rai, Automation Practice Lead, Boundaryless Group and UiPath MVP
Climate Impact of Software Testing at Nordic Testing DaysKari Kakkonen
My slides at Nordic Testing Days 6.6.2024
Climate impact / sustainability of software testing discussed on the talk. ICT and testing must carry their part of global responsibility to help with the climat warming. We can minimize the carbon footprint but we can also have a carbon handprint, a positive impact on the climate. Quality characteristics can be added with sustainability, and then measured continuously. Test environments can be used less, and in smaller scale and on demand. Test techniques can be used in optimizing or minimizing number of tests. Test automation can be used to speed up testing.
Fueling AI with Great Data with Airbyte WebinarZilliz
This talk will focus on how to collect data from a variety of sources, leveraging this data for RAG and other GenAI use cases, and finally charting your course to productionalization.
Let's Integrate MuleSoft RPA, COMPOSER, APM with AWS IDP along with Slackshyamraj55
Discover the seamless integration of RPA (Robotic Process Automation), COMPOSER, and APM with AWS IDP enhanced with Slack notifications. Explore how these technologies converge to streamline workflows, optimize performance, and ensure secure access, all while leveraging the power of AWS IDP and real-time communication via Slack notifications.
Things to Consider When Choosing a Website Developer for your Website | FODUUFODUU
Choosing the right website developer is crucial for your business. This article covers essential factors to consider, including experience, portfolio, technical skills, communication, pricing, reputation & reviews, cost and budget considerations and post-launch support. Make an informed decision to ensure your website meets your business goals.
Cosa hanno in comune un mattoncino Lego e la backdoor XZ?Speck&Tech
ABSTRACT: A prima vista, un mattoncino Lego e la backdoor XZ potrebbero avere in comune il fatto di essere entrambi blocchi di costruzione, o dipendenze di progetti creativi e software. La realtà è che un mattoncino Lego e il caso della backdoor XZ hanno molto di più di tutto ciò in comune.
Partecipate alla presentazione per immergervi in una storia di interoperabilità, standard e formati aperti, per poi discutere del ruolo importante che i contributori hanno in una comunità open source sostenibile.
BIO: Sostenitrice del software libero e dei formati standard e aperti. È stata un membro attivo dei progetti Fedora e openSUSE e ha co-fondato l'Associazione LibreItalia dove è stata coinvolta in diversi eventi, migrazioni e formazione relativi a LibreOffice. In precedenza ha lavorato a migrazioni e corsi di formazione su LibreOffice per diverse amministrazioni pubbliche e privati. Da gennaio 2020 lavora in SUSE come Software Release Engineer per Uyuni e SUSE Manager e quando non segue la sua passione per i computer e per Geeko coltiva la sua curiosità per l'astronomia (da cui deriva il suo nickname deneb_alpha).
Cosa hanno in comune un mattoncino Lego e la backdoor XZ?
Eric.druker
1. SCEA 2007, ERD, RLC, PJB, CJL
Taking a Second Look:
The Potential Pitfalls of Popular Risk
Methodologies
Presented at SCEA, June 2007
Eric R. Druker, Richard L. Coleman, Peter J.
Braxton, Christopher J. Leonetti
Northrop Grumman Corporation
0 eric.druker@ngc.com, 1/31/2008 3:40 PM Copyright 2006 Northrop Grumman Corporation, All Rights Reserved
2. SCEA 2007, ERD, RLC, PJB, CJL
Motivation
All risk analysis methodologies have their origins in mathematics
In many situations however, the practitioners of the analysis come
from non-mathematical backgrounds
This can lead to methodologies that may have sound basis being
applied incorrectly (albeit innocently) due to a lack of
understanding of their underpinnings
The purpose of this paper is to shed light on some of the common
mistakes in the execution of risk analysis
It will also try to explain the math behind these mistakes and the
mischief they can cause
This paper is not intended to be, nor could it ever be, all-inclusive, but
will discuss what seems to be the right mix of common and serious
errors in the experience of the writers
We have chosen to classify these mistakes in to three categories
1. Green Light – Small errors that will only have an effect on the
analysis and will generally not give management a false
impression of risk
2. Yellow light – Larger errors that in certain situations could
have a major effect on the analysis and have the potential to
give management a false impression of risk
3. Red Light – Errors that will always have a major effect on the
analysis and/or will give management a false impression of
risk
1 eric.druker@ngc.com, 1/31/2008 3:40 PM Copyright 2006 Northrop Grumman Corporation, All Rights Reserved
3. SCEA 2007, ERD, RLC, PJB, CJL
Topics
Risk identification and quantification
Continuous vs. discrete risks
Evaluating “below-the-line” (usually “cost on cost”) risks
Combining Triangular Risks
Understanding “confidence” in estimates
Risk Modeling
Monte Carlo vs. Method of Moments
Modeling mutually exclusive events
Assessing Cost Estimating Variability
Breaking risks into categories
Somewhat related thought experiment
The assumption of an underlying log-normal distribution
Conclusions
2 eric.druker@ngc.com, 1/31/2008 3:40 PM Copyright 2006 Northrop Grumman Corporation, All Rights Reserved
4. SCEA 2007, ERD, RLC, PJB, CJL
Risk Identification and Quantification:
Continuous vs. Discrete Risks
Although many risk methodologies account for both discrete and
continuous risks, some analysts try to squeeze all of their risks
into one of the two categories
Pros:
It’s easier to model risks from the same family of distributions
It’s easier to present risks to management when they all come
from the same family
Cons:
Unfortunately, rare is the case that risks can be properly
categorized using one family of distributions
Improper categorizations cause distortions in risks, usually in
their variation, less often in their mean
Unfortunately, variation is key to what is desired from risk
analysis; it conveys a sense of the worst and best cases
Using only one family of distributions can thus lead to misguided
management decisions brought on by a poor characterization of
risk
3 eric.druker@ngc.com, 1/31/2008 3:40 PM Copyright 2006 Northrop Grumman Corporation, All Rights Reserved
5. SCEA 2007, ERD, RLC, PJB, CJL
Risk Identification and Quantification:
Continuous vs. Discrete Risks
Continuous Distributions Discrete Distributions
Continuous risks account for events Discrete distributions account for
specific events with point estimates
where there is a range of possibilities for for their cost impacts
the cost impacts
Example risks that tend to be continuous: Example risks that tend to be
discrete:
Below-the-line risks with estimates Technical/Schedule Risks due to
made using factors or regression specific events
Can be characterized by any number of
distributions Universally characterized as a
Bernoulli or multi-valued discrete
Triangular, normal, and log-normal event, described by probabilit(ies) and
are three of the most common cost impact(s)
Characterizing continuous risks as
Characterizing a discrete event risk
discrete events causes these problems: as continuous causes these
Gives management the false idea problems:
that we can totally eliminate a risk Gives management the
Leaves out information that can show impression that they cannot avoid
the risk and
the opportunity side of the risk (if one Can show an opportunity where
exists) one does not exist
Choose the characterization of risks carefully, it makes a
big difference!
4 eric.druker@ngc.com, 1/31/2008 3:40 PM Copyright 2006 Northrop Grumman Corporation, All Rights Reserved
6. SCEA 2007, ERD, RLC, PJB, CJL
Risk Identification and Quantification:
Evaluating Below-the-Line Risks
One of the most common mistakes we see is in the handling of
below-the-line risks such as factors and rates
Generally, one of two errors occurs
Applying the rate or factor risk to the non-risk-adjusted estimate
Using a discrete distribution to categorize this continuous risk
To perform the analysis correctly, the distribution around the rate or
factor must be found
The next step is to apply this distribution to the risk-adjusted
estimate
Application of a risk to a risk-adjusted estimate is called ‘functional
correlation1”
The next page will show how these two errors can affect the results
of the analysis
1. An Overview of Correlation and Functional Dependencies in Cost Risk and Uncertainty Analysis, R. L.
Coleman, S. S. Gupta, DoDCAS 1994
5 eric.druker@ngc.com, 1/31/2008 3:40 PM Copyright 2006 Northrop Grumman Corporation, All Rights Reserved
7. SCEA 2007, ERD, RLC, PJB, CJL
Risk Identification and Quantification:
Evaluating Below-The-Line Risks
Outcome
Assumptions
Mean St Dev
Labor Point Estimate $ 1,000,000 $ 15,000 $ 6,495
Bernoulli*
Overhead Rate 8%
Overhead Estimate $ 80,000 *Assumed pf of .75
Mean St Dev
Mean St Dev Normal (applied to non risk- $ 20,000 $ 20,000
Historic Overhead Rate 10% 2% adjusted estimate)
Mean St Dev Mean St Dev
Risk Adjusted Labor Estimate $ 1,250,000 $ 250,000 Normal (applied to risk- $ 44,974 $ 35,771
adjusted estimate
*Approximated using Monte Carlo Simulation
PDF
Bernoulli Normal 1 Normal 2
0.000025
10% $ - $ (5,631) $ (868)
0.00002 20% $ - $ 3,168 $ 14,868
30% $ - $ 9,512 $ 26,216
0.000015
40% $ - $ 14,933 $ 35,912
0.00001 50% $ - $ 20,000 $ 44,974
0.000005
60% $ - $ 25,067 $ 54,037
70% $ - $ 30,488 $ 63,733
0 80% $ 20,000 $ 36,832 $ 75,080
-$100 -$50 $0 $50 $100 $150 $200 90% $ 20,000 $ 45,631 $ 90,817
Actual Distribution Bernoulli Approximation
Not using risk adjusted estimate
6 eric.druker@ngc.com, 1/31/2008 3:40 PM Copyright 2006 Northrop Grumman Corporation, All Rights Reserved
8. SCEA 2007, ERD, RLC, PJB, CJL
Risk Identification and Quantification:
Combining Triangular Risks
When developing a risk distribution for a portion of an
estimate, analysts sometimes collect information on
distributions at a lower level, and roll them up to obtain
the risk distribution for the level where they are
performing their analysis
One of the mistakes we have seen is with triangular
distributions for the lower levels of an estimate
Some analysts add the min/mode/max together to get
the top level distribution
This incorrectly adds weight to the tails of the top level
distribution
Percentiles and extrema do not add, only means
add
If possible, the lower level distributions should be run
through a simulation to obtain the upper level
distribution
7 eric.druker@ngc.com, 1/31/2008 3:40 PM Copyright 2006 Northrop Grumman Corporation, All Rights Reserved
10. SCEA 2007, ERD, RLC, PJB, CJL
Risk Identification and Quantification:
Understanding “Confidence”
Some of the methodologies we see rely on an input of
“confidence” in order to ultimately produce a distribution around
the point estimate
The problem lies in a simple breakdown of understanding
somewhere in the chain between methodology developer and
cost estimator
What these models are generally looking for is “confidence”
defined as:
What is the probability that the actual costs incurred for this
program will fall at or under the estimate?
Sometimes, this is misunderstood by the estimator to mean:
What is the probability that the actual costs incurred for this
program will fall on or close to my point estimate
Adding another layer to the problem, sometimes interviews are
conducted to ascertain the confidence in an estimate, when the
confidence is already known
When estimates are made using data-driven approaches
including regressions, parametric, or EVM for example, the
confidence level of the estimate is almost always 50%
The exception to this is when the estimate was intentionally
developed at a level higher than 50%, in which case the
confidence can be derived from the data as well
9 eric.druker@ngc.com, 1/31/2008 3:40 PM Copyright 2006 Northrop Grumman Corporation, All Rights Reserved
11. SCEA 2007, ERD, RLC, PJB, CJL
Risk Identification and Quantification:
Understanding “Confidence”
There are three problems in using the approach of specifying
confidence as an input that make it inherently dangerous
1. It requires both the risk analyst and the estimator being
interviewed to have a considerable level of statistical
sophistication
2. In the case where the risk analysis is being performed by an
independent observer, it requires them to look deeper than the
BOEs to obtain true confidence
Example: When BOEs are written to a target, the desired
confidence should come from the method used to
develop the target cost, not the justification used to
support it
3. In cases where actual risks do not constitute a large
percentage of the total estimate, these “confidences in the
estimate” can drive the entire analysis
The impact of this misunderstanding on the results of this
analysis can be substantial
10 eric.druker@ngc.com, 1/31/2008 3:40 PM Copyright 2006 Northrop Grumman Corporation, All Rights Reserved
12. SCEA 2007, ERD, RLC, PJB, CJL
Risk Identification and Quantification:
Understanding “Confidence”
CDF
1
0.9
0.8
0.7
0.6
0.5 $79
0.4
0.3
0.2
0.1
0
$0 $50 $100 $150 $200
80% Confidence Distribution Correct (50% Confidence) Distribution
Point Estimate Incorrect Median
Percentiles
10% 20% 30% 40% 50% 60% 70% 80% 90%
Assuming 80% Confidence $ 47 $ 58 $ 66 $ 73 $ 79 $ 85 $ 92 $ 100 $ 111
Actual Distribution $ 68 $ 79 $ 87 $ 94 $ 100 $ 106 $ 113 $ 121 $ 132
Difference $ (21) $ (21) $ (21) $ (21) $ (21) $ (21) $ (21) $ (21) $ (21)
This methodology assumes a normal curve used to model the distribution
around the point estimate
The above analysis shows the effect of an analyst using 80% confidence
where a 50% confidence is appropriate
Management would receive two very wrong messages
1. That the estimate has been created at an 80% confidence level
2. That the 50th percentile for the actual costs will be much lower than the
point estimate
11 eric.druker@ngc.com, 1/31/2008 3:40 PM Copyright 2006 Northrop Grumman Corporation, All Rights Reserved
13. SCEA 2007, ERD, RLC, PJB, CJL
Risk Modeling
Now that we’ve discussed how to properly develop
risks, it’s time to look at how they are compiled into
results for presentation to management
There are two main ways of calculating the combined
effects of a large number of risks
A Method of Moments Model
A Monte Carlo Simulation
Both methods work equally well when applied
correctly
What follows is a quick summary of how each method
works as well as the pros and cons of each
12 eric.druker@ngc.com, 1/31/2008 3:40 PM Copyright 2006 Northrop Grumman Corporation, All Rights Reserved
14. SCEA 2007, ERD, RLC, PJB, CJL
Risk Modeling:
Monte Carlo vs. Method of Moments
Monte Carlo arrives at the distribution of the combined effects of
risks by simulating multiple, independent “runs of the contract”
and portraying the range of outcomes
Pros:
Most common approach
Will be understood by the largest audience
More intuitive than method of moments
Makes fewer assumptions than method of moments
Cons:
Very difficult to apply correlation correctly
The output correlation matrix will rarely match the input
correlation when multiple families of distributions are used
Can be time consuming/require somewhat heavy computing power
Thousands of runs are needed to converge to the actual
distribution
Fewer runs are needed for the mean and 50th %-ile (a few
hundred should do), progressively more runs for %-iles
further out in the tails
13 eric.druker@ngc.com, 1/31/2008 3:40 PM Copyright 2006 Northrop Grumman Corporation, All Rights Reserved
15. SCEA 2007, ERD, RLC, PJB, CJL
Risk Modeling:
Monte Carlo vs. Method of Moments
Method of Moments arrives at the distribution of the combined effects of risks by
relying on the central limit theorem (C. L. T.)
The C. L. T. proves that a sufficiently large number of risks will eventually combine to
a parent distribution (generally normal) whose moments match the combined
moments of the child distributions
Pros:
Very easy to use correlation
Assuming all distributions are normal allows random number draws from a
normal random variable
Less computing power required
No simulation is needed since the mean, standard deviation and %-iles of the
overall distribution are deterministic
Cons:
Non-Intuitive
Understanding the moments of random variables requires considerable
statistical sophistication
“Why is a Bernoulli risk being converted to a normal distribution?”
Makes several potentially dangerous assumptions
Assuming normality = assuming no skew in overall distribution
Assumes risks converge to C.L.T.
C. L. T. assumes there are many distributions all of which are independent
and identically distributed
This is often not the case with risk registers
14 eric.druker@ngc.com, 1/31/2008 3:40 PM Copyright 2006 Northrop Grumman Corporation, All Rights Reserved
16. SCEA 2007, ERD, RLC, PJB, CJL
Risk Modeling :
Monte Carlo vs. Method of Moments
One very dangerous situation when using a Method of Moments technique occurs when there is a
risk (or series of risks) that skew the distribution
This occurs when the risks in the risk register do not satisfy the Lyapunov condition
In cases like this, the Method of Moments will give management inaccurate total %-iles of risk
This calls the viability of Method of Moments into question as a risk tool because:
This mistake cannot be caught without running a Monte Carlo simulation on the risk register and
comparing the outputs to Method of Moments
At which point why use Method of Moments in the first place?
Without a math background, risk practitioners will be unaware that this mistake has occurred
Below is an example of a risk register (exaggerated for clarity) that causes a skewed result
99 risks with Pf of .5 and Cf of 10
1 risk with Pf of .02 and Cf of 1000
Actual MoM
Mean 515 515 CDF
Standard Deviation 148.6 148.6
MoM Actual Diff 1.2
10% 324.6 430.0 -105.4 1
20% 390.0 450.0 -60.0 0.8
30% 437.1 470.0 -32.9 0.6
40% 477.4 480.0 -2.6 0.4
50% 515.0 490.0 25.0 0.2
60% 552.6 510.0 42.6
0
70% 592.9 520.0 72.9
-$500 $0 $500 $1,000 $1,500 $2,000
80% 640.0 540.0 100.0
90% 705.4 560.0 145.4 Actual Distribution MoM Approximation
15 eric.druker@ngc.com, 1/31/2008 3:40 PM Copyright 2006 Northrop Grumman Corporation, All Rights Reserved
17. SCEA 2007, ERD, RLC, PJB, CJL
Risk Modeling :
Assessing Cost Estimating Variability
Risks and opportunities shift the mean of the S-Curve and contribute
to its spread, but no risk analysis is complete without an
assessment of cost estimating variability
In other words; ignoring risk, how much error exists in the cost
estimate?
As discussed previously, data-driven estimates often contain the
information needed to assess this variability
In cases where data is not available, such as estimates made using
engineering judgment, it is not uncommon to see variability
assessed through an interview with the estimator
This variability is generally evaluated at the estimate level using a
normal or triangular distribution around the point estimate
In the following slides, we will:
Give an example of assessing cost estimating variability for data
driven estimates
Show the danger of assessing cost estimating variability at too low a
level when data is not available
16 eric.druker@ngc.com, 1/31/2008 3:40 PM Copyright 2006 Northrop Grumman Corporation, All Rights Reserved
18. SCEA 2007, ERD, RLC, PJB, CJL
Risk Modeling :
Assessing Cost Estimating Variability
For data-driven estimates, cost estimating variability is often a direct
product of the analysis needed to produce the estimate
When estimating using CERs, the prediction interval can be used to
assess cost estimate variability
The distribution that is uncovered can then be placed into the Monte
Carlo simulation
Regression Reminder:
Confidence Intervals give bands for Prediction Cum ulative Distribution
the mean value of a prediction, 1.2
Prediction intervals for the value of
the prediction itself 1
25
Cumulative Probability
Convert Prediction Interval 0.8
20 into distribution by finding 0.6
ction the prediction band for the
Predi
15 prediction at all %-iles 0.4
e
idenc
Conf 0.2
10
0
$0 $5 $10 $15 $20 $25
5 Prediction
Prediction Interval Distribution Point Estimate
0
0 5 10 15 20
-5
-10
17 eric.druker@ngc.com, 1/31/2008 3:40 PM Copyright 2006 Northrop Grumman Corporation, All Rights Reserved
19. SCEA 2007, ERD, RLC, PJB, CJL
Risk Modeling :
Assessing Cost Estimating Variability
When data is unavailable, interviews are often conducted to assess estimating variability
The outcome of this is generally a triangular or normal distribution around the point estimate
Assessing this variability at too low a level is one of the pitfalls that can occur using this method
While the analyst may believe they are achieving a greater level of granularity, their practice is
artificially removing variability from the estimate
In general, for similar distributions, CV decreases by a factor of 1/√(number of
distributions)
Correlation can mitigate this, but only to a certain extent
As a separate issue, it is in doubt whether estimators can accurately assess cost estimating
variability at low levels
It is likely that they are applying their perception of top level variation to the lower level
estimates
CV vs Number of Distributions
Assumptions
0.12
All Distributions are N(10,100) (CV Rho
of 10%) 0.1 0
0.1
CV shown on graph is CV of the 0.2
0.08
0.3
sum of the distributions
0.4 Typical
CV
0.06
0.5 Rho
Note
0.6
0.04
0.7
With a ρ of 0.0 (no correlation), CV
0.8
of the sum of the distributions =
0.02 0.9
10% x √(number of distributions
being summed)
0
0 20 40 60 80 100
Num ber of Distributions
Note the
diminishing returns
18 eric.druker@ngc.com, 1/31/2008 3:40 PM Copyright 2006 Northrop Grumman Corporation, All Rights Reserved
20. SCEA 2007, ERD, RLC, PJB, CJL
Risk Modeling:
Modeling Mutually Exclusive Events
Sometimes, risk practitioners are faced with two outcomes for a risk
Most of the times, these are meant to be mutually exclusive events
Consider a risk with two possibilities:
A 20% chance of a $20,000 risk
A 20% chance of a $10,000 opportunity
Modeled as two line items without taking into account exclusivity, the risk
is actually categorized as such:
A 16% chance of a $20,000 risk
20% chance of $20,000 risk x 80% chance of no opportunity
A 16% chance of a $10,000 opportunity
20% chance of $10,000 opportunity x 80% chance of no risk
A 64% chance that nothing happens
80% chance of no opportunity x 80% chance of no risk
A 4% chance of a $10,000 risk
20% chance of $10,000 opportunity x 20% chance of $20,000 risk
Although this does not change the expected value of the item, it does
change the standard deviation
Modeled as exclusive events the standard deviation is $9,797
Modeled as above the standard deviation is $8,944
Repeated enough times, this mistake will lead to incorrect percentiles of
the overall risk distribution
19 eric.druker@ngc.com, 1/31/2008 3:40 PM Copyright 2006 Northrop Grumman Corporation, All Rights Reserved
21. SCEA 2007, ERD, RLC, PJB, CJL
Risk Modeling :
Breaking Risks into Categories
One of the biggest hurdles in presenting risk
analysis results lies in the fact that subcategories of
risk will never sum to the total
Several methodologies contain processes for
adjusting the results by category so that they sum
to the total
We believe that an understanding of why categories
don’t sum to the total can be given through a simple
(and more importantly, quick) explanation
We agree that in general, management does
understand this fact; but, giving decision makers
some of the basic tools needed to understand our
analysis increases its usefulness to them
We will propose a simple way of presenting the
information
20 eric.druker@ngc.com, 1/31/2008 3:40 PM Copyright 2006 Northrop Grumman Corporation, All Rights Reserved
22. SCEA 2007, ERD, RLC, PJB, CJL
Risk Modeling :
Breaking Risks into Categories
Example: The Dice Game:
Suppose I have one die and roll once
The probability of getting a 1 is 1/6 (There is an equal
probability of landing on any side)
Now suppose that I have one die and roll twice
What is the probability of having the total of two rolls equal 2?
The only way this can happen is if I roll a 1 twice
Probability of rolling 1 on first throw: 1/6
Probability of rolling 1 on second throw: 1/6
Because each roll is independent, the probability of the rolls
summing to 2 is (1/6) x (1/6) = 1/36
This is the same logic that needs to be applied to each
category
Assuming the categories are independent, the probability of
having ALL worst case scenarios is close to zero!
This same logic applies to categories of risk
Percentiles will not add because the probability of having
EVERYTHING (or most everything) go wrong (or right) is very
small
21 eric.druker@ngc.com, 1/31/2008 3:40 PM Copyright 2006 Northrop Grumman Corporation, All Rights Reserved
23. SCEA 2007, ERD, RLC, PJB, CJL
Risk Modeling :
Breaking Risks into Categories
Point Estimate 20th % 50th % 80th % Risk % Risk $
Labor $ 100,000 $ 101,144 $ 104,046 $ 108,072 4.0% $ 4,046
Material $ 25,000 $ 26,144 $ 29,046 $ 33,072 16.2% $ 4,046
Total $ 125,000 $ 129,616 $ 133,990 $ 138,768 7.2% $ 8,990
Risk analysis is generally only a piece of the puzzle when
decision makers receive a presentation on a program
This generally leads to the risk assessment results being
compressed onto a couple of slides
It is therefore critical that we present the information in a way
that is both compressed and evocative
The above chart shows how categories can be presented along
with the bottom line
The point estimate is included for reference, along with the
20th/50th/80th percentiles
Risk $s and Risk %s (based on the 50th percentile) are shown
off to the right
This allows decision makers to see the risks from both
important perspectives
22 eric.druker@ngc.com, 1/31/2008 3:40 PM Copyright 2006 Northrop Grumman Corporation, All Rights Reserved
24. SCEA 2007, ERD, RLC, PJB, CJL
A Thought Experiment:
The Assumption of Log-Normality
Many studies have asserted the CGF distribution across many
DoD programs to be distributed log-normally, an example is
Arena and Younossi1
A paper by Summerville and Coleman2 presented a risk approach
that recommended applying a normal distribution with a mean
and standard deviation based on a weighted average risk score
based on several objective measures
Could it be possible that the log-normal distribution described in
the Arena and Younossi paper is due to the risk scores from the
Summerville and Coleman2 paper being distributed log-normally?
This would give the illusion of an underlying log-normal
distribution when the actual distribution is normal with a mean
and standard deviation dependent on the technical score
We’re not necessarily advocating dropping the umbrella log-
normal assumption that is being used in many methods,
especially when the technical score is unknown
We present this as a thought experiment that could be expanded
on at a later date
1 Arena, Mark, Obaid Younossi, and et. al.. Impossible Certainty: Cost Risk Analysis for
Air Force Systems. Santa Monica: RAND Corporation, 2006
2 “Cost and Schedule Risk CE V” Coleman, Summerville and Dameron, TASC Inc., June
2002
23 eric.druker@ngc.com, 1/31/2008 3:40 PM Copyright 2006 Northrop Grumman Corporation, All Rights Reserved
25. SCEA 2007, ERD, RLC, PJB, CJL
Conclusions
One of the biggest problems with risk analysis is that it is
impossible to catch all mistakes just by looking at %-iles or an S-
Curve
Catching mistakes requires looking at not just the models and
their outputs, but the methods used to produce the inputs
We all know that Garbage in = Garbage out
We forget that Good data into bad methods = Garbage out
Due to the mathematical knowledge required to catch many of
these mistakes we advocate the vetting of all risk analysis
performed within an organization with someone (or some group)
who understands both the process and the math behind it
Normally, a few days to a week is all that is needed to catch
problems like the ones discussed in this paper
Once problems have been caught, they can generally be quickly
fixed in order to present the most accurate information available
to management
24 eric.druker@ngc.com, 1/31/2008 3:40 PM Copyright 2006 Northrop Grumman Corporation, All Rights Reserved