
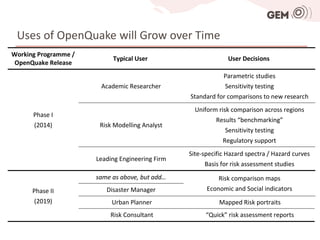
![Working Together to Assess [Seismic] Risk
Capabilities & Results
Global Components GEM Secretariat PSHA
Loss Exceedence Curves
Event Losses
Collaborating Damage Maps
Scientists Fatality Estimates
Retrofit Cost-Benefit
Historical Catalog OpenQuake Hazard Curves & Spectra
Instrumental Catalog
Fault Database
Strain Rates
Attenuation Relations
Taxonomy
Vulnerability Regional Workshops
Global Exposure
Consequences Database
Inventory Data Capture Tools
Social Vulnerability & Resilience](https://image.slidesharecdn.com/4-eerimodelingresiliencegem2013-130304151811-phpapp01/85/Modeling-Resilience-in-GEM-Kate-Stillwell-5-320.jpg)
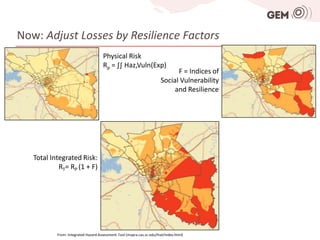
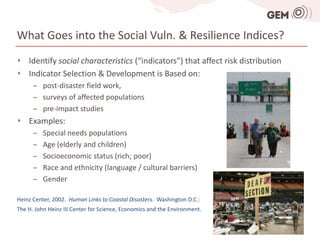
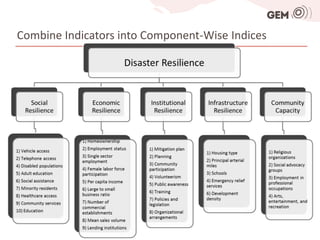
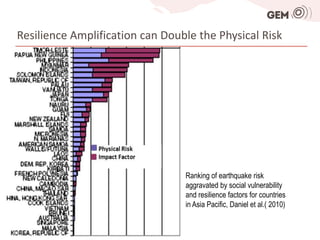
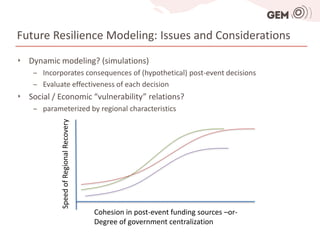

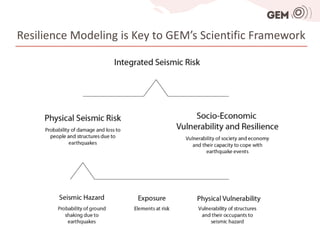
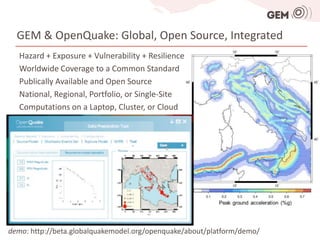
Kate Stillwell from the GEM Foundation presented on modeling resilience in GEM. GEM uses an open-source platform called OpenQuake to model global earthquake risk through an integrated approach considering hazard, exposure, vulnerability, and resilience. Resilience factors are used to adjust physical risk estimates to account for social vulnerability and a region's ability to prepare for and recover from disasters. Future work will aim to develop dynamic models of resilience that can simulate post-event decisions and evaluate their effectiveness over time.


![GEM's Mission and Vision [Sep 2012]](https://cdn.slidesharecdn.com/ss_thumbnails/ss1gem1missionvision-121024034505-phpapp02-thumbnail.jpg?width=640&height=640&fit=bounds)


