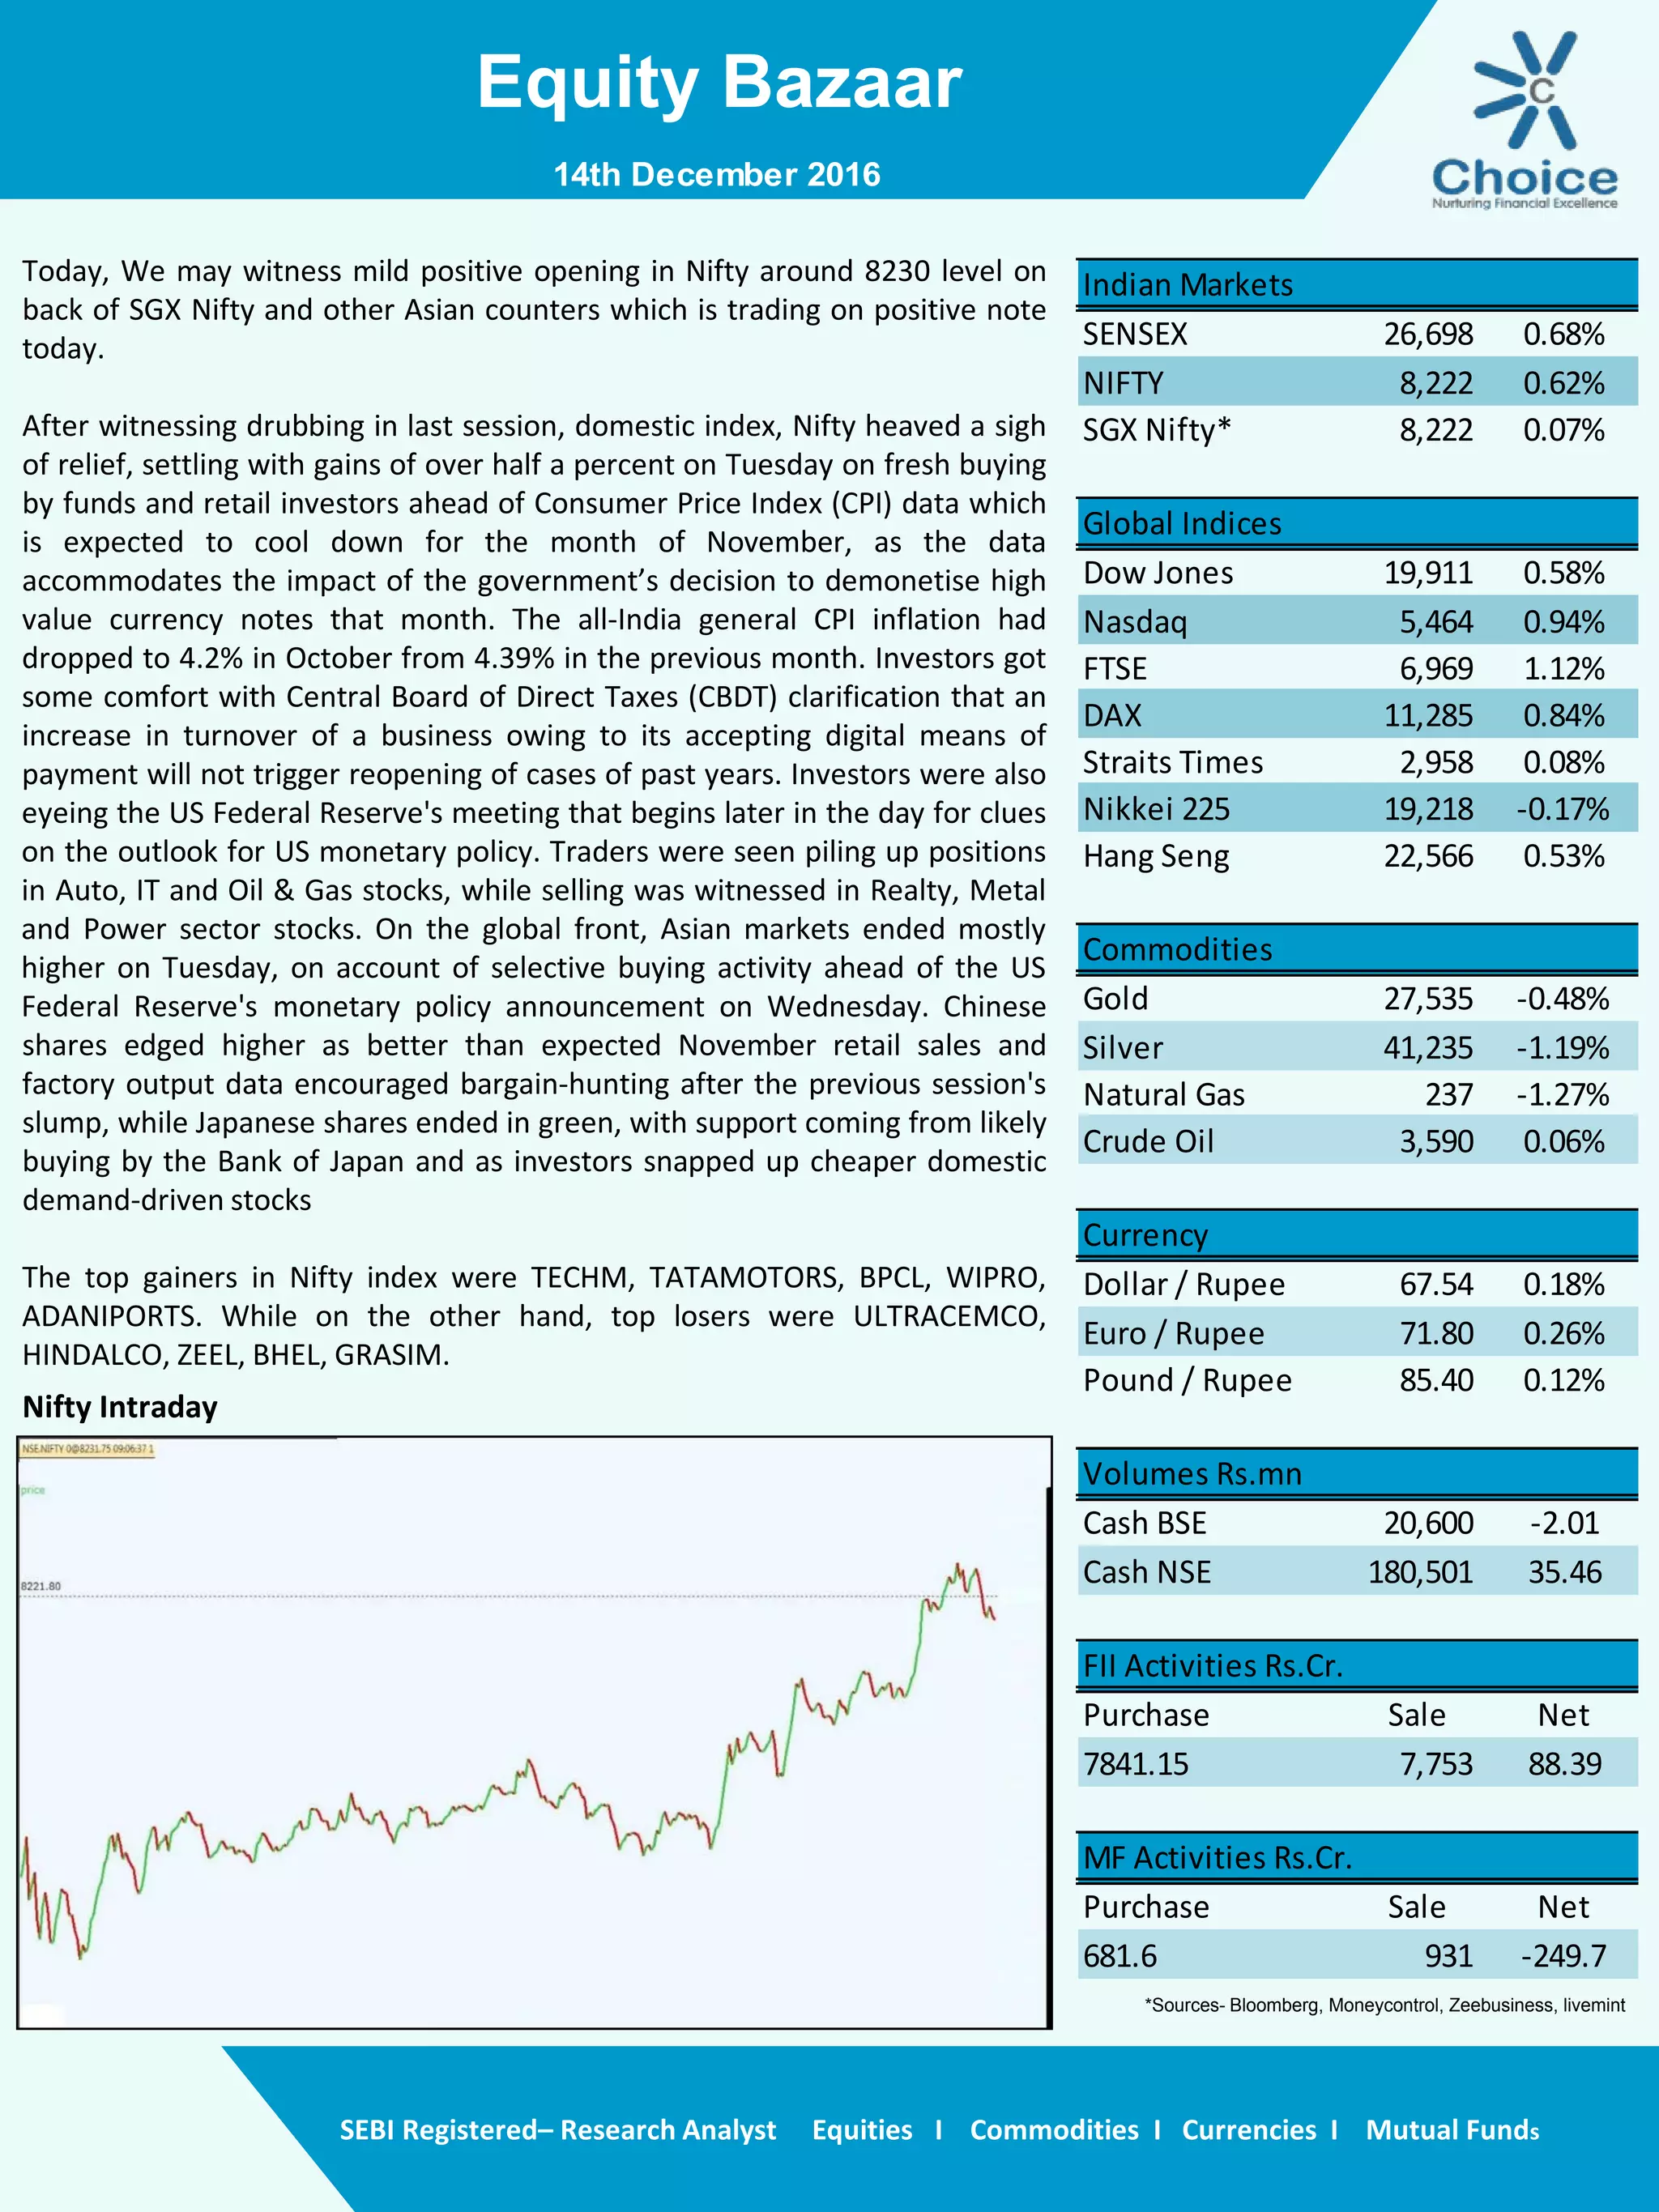
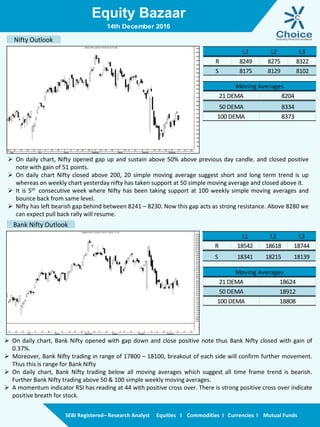
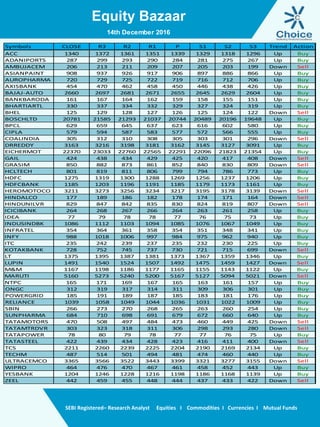
1. Equity Bazaar
SEBI Registered– Research Analyst Equities I Commodities I Currencies I Mutual Funds
Nifty Intraday
Today, We may witness mild positive opening in Nifty around 8230 level on
back of SGX Nifty and other Asian counters which is trading on positive note
today.
After witnessing drubbing in last session, domestic index, Nifty heaved a sigh
of relief, settling with gains of over half a percent on Tuesday on fresh buying
by funds and retail investors ahead of Consumer Price Index (CPI) data which
is expected to cool down for the month of November, as the data
accommodates the impact of the government’s decision to demonetise high
value currency notes that month. The all-India general CPI inflation had
dropped to 4.2% in October from 4.39% in the previous month. Investors got
some comfort with Central Board of Direct Taxes (CBDT) clarification that an
increase in turnover of a business owing to its accepting digital means of
payment will not trigger reopening of cases of past years. Investors were also
eyeing the US Federal Reserve's meeting that begins later in the day for clues
on the outlook for US monetary policy. Traders were seen piling up positions
in Auto, IT and Oil & Gas stocks, while selling was witnessed in Realty, Metal
and Power sector stocks. On the global front, Asian markets ended mostly
higher on Tuesday, on account of selective buying activity ahead of the US
Federal Reserve's monetary policy announcement on Wednesday. Chinese
shares edged higher as better than expected November retail sales and
factory output data encouraged bargain-hunting after the previous session's
slump, while Japanese shares ended in green, with support coming from likely
buying by the Bank of Japan and as investors snapped up cheaper domestic
demand-driven stocks
The top gainers in Nifty index were TECHM, TATAMOTORS, BPCL, WIPRO,
ADANIPORTS. While on the other hand, top losers were ULTRACEMCO,
HINDALCO, ZEEL, BHEL, GRASIM.
14th December 2016
SENSEX 26,698 0.68%
NIFTY 8,222 0.62%
SGX Nifty* 8,222 0.07%
Global Indices
Dow Jones 19,911 0.58%
Nasdaq 5,464 0.94%
FTSE 6,969 1.12%
DAX 11,285 0.84%
Straits Times 2,958 0.08%
Nikkei 225 19,218 -0.17%
Hang Seng 22,566 0.53%
Commodities
Gold 27,535 -0.48%
Silver 41,235 -1.19%
Natural Gas 237 -1.27%
Crude Oil 3,590 0.06%
Currency
Dollar / Rupee 67.54 0.18%
Euro / Rupee 71.80 0.26%
Pound / Rupee 85.40 0.12%
Volumes Rs.mn
Cash BSE 20,600 -2.01
Cash NSE 180,501 35.46
FII Activities Rs.Cr.
Purchase Sale Net
7841.15 7,753 88.39
MF Activities Rs.Cr.
Purchase Sale Net
681.6 931 -249.7
Indian Markets
*Sources- Bloomberg, Moneycontrol, Zeebusiness, livemint
2. Equity Bazaar
SEBI Registered– Research Analyst Equities I Commodities I Currencies I Mutual Funds
Nifty Outlook
Bank Nifty Outlook
14th December 2016
L1 L2 L3
R 8249 8275 8322
S 8175 8129 8102
21 DEMA 8204
50 DEMA 8334
100 DEMA 8373
Moving Averages
L1 L2 L3
R 18542 18618 18744
S 18341 18215 18139
21 DEMA 18624
50 DEMA 18912
100 DEMA 18808
Moving Averages
On daily chart, Nifty opened gap up and sustain above 50% above previous day candle. and closed positive
note with gain of 51 points.
On daily chart Nifty closed above 200, 20 simple moving average suggest short and long term trend is up
whereas on weekly chart yesterday nifty has taken support at 50 simple moving average and closed above it.
It is 5th consecutive week where Nifty has been taking support at 100 weekly simple moving averages and
bounce back from same level.
Nifty has left bearish gap behind between 8241 – 8230. Now this gap acts as strong resistance. Above 8280 we
can expect pull back rally will resume.
On daily chart, Bank Nifty opened with gap down and close positive note thus Bank Nifty closed with gain of
0.37%.
Moreover, Bank Nifty trading in range of 17800 – 18100, breakout of each side will confirm further movement.
Thus this is range for Bank Nifty
On daily chart, Bank Nifty trading below all moving averages which suggest all time frame trend is bearish.
Further Bank Nifty trading above 50 & 100 simple weekly moving averages.
A momentum indicator RSI has reading at 44 with positive cross over. There is strong positive cross over indicate
positive breath for stock.
3. Equity Bazaar
SEBI Registered– Research Analyst Equities I Commodities I Currencies I Mutual Funds
14th December 2016
Symbols CLOSE R3 R2 R1 P S1 S2 S3 Trend Action
ACC 1340 1372 1361 1351 1339 1329 1318 1296 Up Buy
ADANIPORTS 287 299 293 290 284 281 275 267 Up Buy
AMBUJACEM 206 213 211 209 207 205 203 199 Down Sell
ASIANPAINT 908 937 926 917 906 897 886 866 Up Buy
AUROPHARMA 720 729 725 722 719 716 712 706 Up Buy
AXISBANK 454 470 462 458 450 446 438 426 Up Buy
BAJAJ-AUTO 2660 2697 2681 2671 2655 2645 2629 2604 Up Buy
BANKBARODA 161 167 164 162 159 158 155 151 Up Buy
BHARTIARTL 330 337 334 332 329 327 324 319 Up Buy
BHEL 125 129 128 127 126 125 124 122 Down Sell
BOSCHLTD 20781 21585 21293 21037 20744 20489 20196 19648 Up Buy
BPCL 629 659 645 637 623 616 602 580 Up Buy
CIPLA 579 594 587 583 577 572 566 555 Up Buy
COALINDIA 305 312 310 308 305 303 301 296 Down Sell
DRREDDY 3163 3216 3198 3181 3162 3145 3127 3091 Up Buy
EICHERMOT 22370 23033 22760 22565 22291 22096 21823 21354 Up Buy
GAIL 424 438 434 429 425 420 417 408 Down Sell
GRASIM 850 882 873 861 852 840 830 809 Down Sell
HCLTECH 801 819 811 806 799 794 786 773 Up Buy
HDFC 1275 1319 1300 1288 1269 1256 1237 1206 Up Buy
HDFCBANK 1185 1203 1196 1191 1185 1179 1173 1161 Up Buy
HEROMOTOCO 3211 3273 3256 3234 3217 3195 3178 3139 Down Sell
HINDALCO 177 189 186 182 178 174 171 164 Down Sell
HINDUNILVR 829 847 842 835 830 824 819 807 Down Sell
ICICIBANK 264 268 267 266 264 263 261 258 Up Buy
IDEA 77 79 78 78 77 76 75 73 Up Buy
INDUSINDBK 1086 1112 1103 1094 1085 1076 1067 1049 Up Buy
INFRATEL 354 364 361 358 354 351 348 341 Up Buy
INFY 988 1018 1006 997 984 975 962 940 Up Buy
ITC 235 242 239 237 235 232 230 225 Up Buy
KOTAKBANK 728 752 745 737 730 721 715 699 Down Sell
LT 1375 1395 1387 1381 1373 1367 1359 1346 Up Buy
LUPIN 1491 1540 1524 1507 1492 1475 1459 1427 Down Sell
M&M 1167 1198 1186 1177 1165 1155 1143 1122 Up Buy
MARUTI 5160 5273 5240 5200 5167 5127 5094 5021 Down Sell
NTPC 165 171 169 167 165 163 161 157 Up Buy
ONGC 312 319 317 314 311 309 306 301 Up Buy
POWERGRID 185 191 189 187 185 183 181 176 Up Buy
RELIANCE 1039 1058 1049 1044 1036 1031 1022 1009 Up Buy
SBIN 266 273 270 268 265 263 260 254 Up Buy
SUNPHARMA 684 710 698 691 679 672 660 640 Up Buy
TATAMOTORS 470 508 497 484 473 460 449 425 Down Sell
TATAMTRDVR 303 323 318 311 306 298 293 280 Down Sell
TATAPOWER 78 80 79 78 77 77 76 75 Up Buy
TATASTEEL 422 439 434 428 423 416 411 400 Down Sell
TCS 2211 2260 2239 2225 2204 2190 2169 2134 Up Buy
TECHM 487 514 501 494 481 474 460 440 Up Buy
ULTRACEMCO 3365 3566 3522 3443 3399 3321 3277 3155 Down Sell
WIPRO 464 476 470 467 461 458 452 443 Up Buy
YESBANK 1204 1246 1228 1216 1198 1186 1168 1139 Up Buy
ZEEL 442 459 455 448 444 437 433 422 Down Sell
4. Equity Bazaar
SEBI Registered– Research Analyst Equities I Commodities I Currencies I Mutual Funds
Contact Us
www.choicebroking.in
Kkunal Parar
Sr. Research Associate
kkunal.parar@choiceindia.com
Vikas Chaudhari
Research Associate
vikas.chaudhari@choiceindia.com
www.choicebroking.incustomercare@choiceindia.com
Disclaimer
This is solely for information of clients of Choice Broking and does not construe to be an investment advice. It is also not intended as an offer or solicitation for the purchase and sale of any financial
instruments. Any action taken by you on the basis of the information contained herein is your responsibility alone and Choice Broking its subsidiaries or its employees or associates will not be liable in
any manner for the consequences of such action taken by you. We have exercised due diligence in checking the correctness and authenticity of the information contained in this recommendation, but
Choice Broking or any of its subsidiaries or associates or employees shall not be in any way responsible for any loss or damage that may arise to any person from any inadvertent error in the
information contained in this recommendation or any action taken on basis of this information. Technical analysis studies market psychology, price patterns and volume levels. It is used to forecast
future price and market movements. Technical analysis is complementary to fundamental analysis and news sources. The recommendations issued herewith might be contrary to recommendations
issued by Choice Broking in the company research undertaken as the recommendations stated in this report is derived purely from technical analysis. Choice Broking has based this document on
information obtained from sources it believes to be reliable but which it has not independently verified; Choice Broking makes no guarantee, representation or warranty and accepts no responsibility
or liability as to its accuracy or completeness. The opinions contained within the report are based upon publicly available information at the time of publication and are subject to change without
notice. The information and any disclosures provided herein are in summary form and have been prepared for informational purposes. The recommendations and suggested price levels are intended
purely for trading purposes. The recommendations are valid for the day of the report however trading trends and volumes might vary substantially on an intraday basis and the recommendations may
be subject to change. The information and any disclosures provided herein may be considered confidential. Any use, distribution, modification, copying, forwarding or disclosure by any person is
strictly prohibited. The information and any disclosures provided herein do not constitute a solicitation or offer to purchase or sell any security or other financial product or instrument. The current
performance may be unaudited. Past performance does not guarantee future returns. There can be no assurance that investments will achieve any targeted rates of return, and there is no guarantee
against the loss of your entire investment.
POTENTIAL CONFLICT OF INTEREST DISCLOSURE (as on date of report) Disclosure of interest statement – • Analyst interest of the stock /Instrument(s): - No. • Firm interest of the stock /
Instrument (s): - No.
Amit Pathania
Research Associate
amit.pathania@choiceindia.com
14th December 2016
Kapil Shah
Research Associate
kapil.shah@choiceindia.com
Kapil Shah
Digitally signed by Kapil Shah
DN: cn=Kapil Shah, o=Choice Equity Pvt Ltd,
ou=Research Team,
email=kapil.shah@choiceindia.com, c=US
Date: 2016.12.14 09:18:58 +05'30'