NIFTYOUTLOOK
•
0 likes•17 views

The document provides an intraday analysis of the Nifty 50 index and Bank Nifty index for December 16, 2016. It notes that the indexes may open mildly negative due to declines in Asian markets. It analyzes recent price movements and technical indicators for both indexes and predicts that Nifty may see further declines to around 8,080 while Bank Nifty could rise to around 18,100. The analysis also provides outlooks for various stocks.

Recommended
More Related Content
What's hot
What's hot (20)
Viewers also liked
Viewers also liked (13)
Similar to NIFTYOUTLOOK
Similar to NIFTYOUTLOOK (19)
Recently uploaded
Recently uploaded (20)
NIFTYOUTLOOK
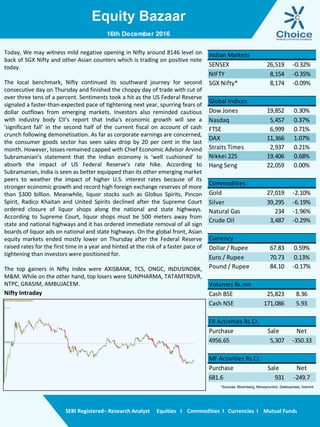
- 1. Equity Bazaar SEBI Registered– Research Analyst Equities I Commodities I Currencies I Mutual Funds Nifty Intraday Today, We may witness mild negative opening in Nifty around 8146 level on back of SGX Nifty and other Asian counters which is trading on positive note today. The local benchmark, Nifty continued its southward journey for second consecutive day on Thursday and finished the choppy day of trade with cut of over three tens of a percent. Sentiments took a hit as the US Federal Reserve signaled a faster-than-expected pace of tightening next year, spurring fears of dollar outflows from emerging markets. Investors also reminded cautious with industry body CII’s report that India's economic growth will see a 'significant fall' in the second half of the current fiscal on account of cash crunch following demonetisation. As far as corporate earnings are concerned, the consumer goods sector has seen sales drop by 20 per cent in the last month. However, losses remained capped with Chief Economic Advisor Arvind Subramanian’s statement that the Indian economy is ‘well cushioned’ to absorb the impact of US Federal Reserve's rate hike. According to Subramanian, India is seen as better equipped than its other emerging market peers to weather the impact of higher U.S. interest rates because of its stronger economic growth and record high foreign exchange reserves of more than $300 billion. Meanwhile, liquor stocks such as Globus Spirits, Pincon Spirit, Radico Khaitan and United Spirits declined after the Supreme Court ordered closure of liquor shops along the national and state highways. According to Supreme Court, liquor shops must be 500 meters away from state and national highways and it has ordered immediate removal of all sign boards of liquor ads on national and state highways. On the global front, Asian equity markets ended mostly lower on Thursday after the Federal Reserve raised rates for the first time in a year and hinted at the risk of a faster pace of tightening than investors were positioned for. The top gainers in Nifty index were AXISBANK, TCS, ONGC, INDUSINDBK, M&M. While on the other hand, top losers were SUNPHARMA, TATAMTRDVR, NTPC, GRASIM, AMBUJACEM. 16th December 2016 SENSEX 26,519 -0.32% NIFTY 8,154 -0.35% SGX Nifty* 8,174 -0.09% Global Indices Dow Jones 19,852 0.30% Nasdaq 5,457 0.37% FTSE 6,999 0.71% DAX 11,366 1.07% Straits Times 2,937 0.21% Nikkei 225 19,406 0.68% Hang Seng 22,059 0.00% Commodities Gold 27,019 -2.10% Silver 39,295 -6.19% Natural Gas 234 -1.96% Crude Oil 3,487 -0.29% Currency Dollar / Rupee 67.83 0.59% Euro / Rupee 70.73 0.13% Pound / Rupee 84.10 -0.17% Volumes Rs.mn Cash BSE 25,823 8.36 Cash NSE 171,086 5.93 FII Activities Rs.Cr. Purchase Sale Net 4956.65 5,307 -350.33 MF Activities Rs.Cr. Purchase Sale Net 681.6 931 -249.7 Indian Markets *Sources- Bloomberg, Moneycontrol, Zeebusiness, livemint
- 2. Equity Bazaar SEBI Registered– Research Analyst Equities I Commodities I Currencies I Mutual Funds Nifty Outlook Bank Nifty Outlook 16th December 2016 L1 L2 L3 R 8212 8271 8316 S 8108 8063 8004 21 DEMA 8198 50 DEMA 8322 100 DEMA 8365 Moving Averages L1 L2 L3 R 18581 18762 18991 S 18172 17942 17762 21 DEMA 18580 50 DEMA 18870 100 DEMA 18788 Moving Averages On daily chart, Nifty opened with gap down and bounces back from lower level but it closed with loss of 28 point from yester days closed. Moreover, yesterday Nifty has found resistance at 200 simple daily moving averages which is placed at 8225. Whereas it has taken support at 20days simple moving averages which is placed at 8125. So it suggests trading range is 8230 to 8130 in near term. Besides that, Nifty has formed an inverted hammer candlestick pattern which is bullish reversal pattern to validate pattern confirmation is required with bullish big body candle. On other hand, Nifty has been trading below important resistance level. A momentum indicator RSI has reading at 45 level with bearish crossover as well as below center line point out negative breath for index. Going forward, with the above technical structure, we expect negative move in the Index up to the level of 8080. On daily chart, Bank Nifty opened with gap down and bounces back from lower level and closed with gain of 0.33%. Till now Bank Nifty is trading has been trading inside previous week candle. On daily chart, Bank Nifty has been finding resistance 20 daily simple moving averages since past 5 day. Bank Nifty couldn’t sustain above 20 daily simple moving averages. Moreover Bank Nifty trading in range of 18100 to 18800 now Bank Nifty trading near lower band of range. Besides that, weekly chart price has tested last week low with is placed at 17960 On daily chart Money Flow Index (MFI) reading at 35 levels in negative territory which suggest money is not flowing in security. Whereas on weekly chart MFI follow very sharply and given fresh sell signal however still one more day are remaining to complete the week. Going forward, with the above technical structure, we expect positive move in the Index up to the level of 18100.
- 3. Equity Bazaar SEBI Registered– Research Analyst Equities I Commodities I Currencies I Mutual Funds 16th December 2016 Symbols CLOSE R3 R2 R1 P S1 S2 S3 Trend Action ACC 1310 1347 1338 1324 1314 1301 1291 1268 Down Sell ADANIPORTS 285 298 295 290 286 281 278 269 Down Sell AMBUJACEM 201 211 209 205 203 199 197 191 Down Sell ASIANPAINT 903 928 922 913 907 898 892 877 Down Sell AUROPHARMA 694 724 716 705 697 686 678 659 Down Sell AXISBANK 479 506 493 486 472 465 452 432 Up Buy BAJAJ-AUTO 2675 2776 2738 2706 2667 2636 2597 2527 Up Buy BANKBARODA 160 167 164 162 159 157 154 149 Up Buy BHARTIARTL 319 326 324 321 319 317 315 310 Down Sell BHEL 125 129 128 127 125 124 122 120 Down Sell BOSCHLTD 20015 21110 20805 20410 20105 19710 19405 18705 Down Sell BPCL 615 650 640 628 618 605 596 573 Down Sell CIPLA 564 591 584 574 567 557 549 532 Down Sell COALINDIA 290 297 296 293 291 288 287 282 Down Sell DRREDDY 3106 3201 3181 3143 3123 3085 3064 3006 Down Sell EICHERMOT 21550 22525 22296 21923 21694 21321 21092 20490 Down Sell GAIL 416 433 429 422 418 412 408 397 Down Sell GRASIM 834 876 866 850 839 823 812 786 Down Sell HCLTECH 830 857 849 839 831 821 813 795 Down Sell HDFC 1262 1296 1287 1274 1265 1252 1243 1220 Down Sell HDFCBANK 1177 1224 1209 1193 1178 1162 1148 1117 Down Sell HEROMOTOCO 3173 3294 3247 3210 3163 3126 3079 2995 Up Buy HINDALCO 177 182 180 178 176 174 172 167 Up Buy HINDUNILVR 817 833 828 823 818 813 808 798 Down Sell ICICIBANK 260 266 264 262 260 258 256 252 Up Buy IDEA 77 80 79 78 77 76 75 73 Up Buy INDUSINDBK 1085 1135 1114 1100 1078 1064 1042 1007 Up Buy INFRATEL 351 366 362 357 353 348 345 336 Down Sell INFY 992 1041 1030 1011 1000 981 970 940 Down Sell ITC 229 239 237 233 231 227 225 219 Down Sell KOTAKBANK 725 758 746 736 724 713 701 679 Up Buy LT 1355 1383 1375 1365 1357 1347 1339 1321 Down Sell LUPIN 1480 1510 1500 1490 1480 1470 1460 1440 Down Sell M&M 1188 1232 1214 1201 1184 1170 1153 1122 Up Buy MARUTI 5153 5324 5260 5207 5143 5090 5026 4909 Up Buy NTPC 160 168 166 163 161 158 157 152 Down Sell ONGC 206 217 213 209 205 202 198 191 Up Buy POWERGRID 184 192 189 186 183 181 178 173 Up Buy RELIANCE 1051 1082 1075 1063 1056 1044 1037 1018 Down Sell SBIN 265 277 272 269 264 260 255 247 Up Buy SUNPHARMA 650 696 685 667 656 639 628 599 Down Sell TATAMOTORS 463 481 478 470 466 459 455 444 Down Sell TATAMTRDVR 297 313 310 303 299 293 289 279 Down Sell TATAPOWER 78 82 81 80 79 77 76 73 Down Sell TATASTEEL 421 443 435 428 420 413 406 391 Up Buy TCS 2257 2355 2314 2285 2244 2215 2173 2103 Up Buy TECHM 477 497 490 483 476 469 462 448 Up Buy ULTRACEMCO 3259 3351 3331 3295 3275 3239 3219 3163 Down Sell WIPRO 467 484 478 472 466 461 455 444 Up Buy YESBANK 1187 1225 1215 1201 1190 1176 1166 1142 Down Sell ZEEL 437 459 453 445 440 431 426 412 Down Sell
- 4. Equity Bazaar SEBI Registered– Research Analyst Equities I Commodities I Currencies I Mutual Funds Contact Us www.choicebroking.in Kkunal Parar Sr. Research Associate kkunal.parar@choiceindia.com Vikas Chaudhari Research Associate vikas.chaudhari@choiceindia.com www.choicebroking.incustomercare@choiceindia.com Disclaimer This is solely for information of clients of Choice Broking and does not construe to be an investment advice. It is also not intended as an offer or solicitation for the purchase and sale of any financial instruments. Any action taken by you on the basis of the information contained herein is your responsibility alone and Choice Broking its subsidiaries or its employees or associates will not be liable in any manner for the consequences of such action taken by you. We have exercised due diligence in checking the correctness and authenticity of the information contained in this recommendation, but Choice Broking or any of its subsidiaries or associates or employees shall not be in any way responsible for any loss or damage that may arise to any person from any inadvertent error in the information contained in this recommendation or any action taken on basis of this information. Technical analysis studies market psychology, price patterns and volume levels. It is used to forecast future price and market movements. Technical analysis is complementary to fundamental analysis and news sources. The recommendations issued herewith might be contrary to recommendations issued by Choice Broking in the company research undertaken as the recommendations stated in this report is derived purely from technical analysis. Choice Broking has based this document on information obtained from sources it believes to be reliable but which it has not independently verified; Choice Broking makes no guarantee, representation or warranty and accepts no responsibility or liability as to its accuracy or completeness. The opinions contained within the report are based upon publicly available information at the time of publication and are subject to change without notice. The information and any disclosures provided herein are in summary form and have been prepared for informational purposes. The recommendations and suggested price levels are intended purely for trading purposes. The recommendations are valid for the day of the report however trading trends and volumes might vary substantially on an intraday basis and the recommendations may be subject to change. The information and any disclosures provided herein may be considered confidential. Any use, distribution, modification, copying, forwarding or disclosure by any person is strictly prohibited. The information and any disclosures provided herein do not constitute a solicitation or offer to purchase or sell any security or other financial product or instrument. The current performance may be unaudited. Past performance does not guarantee future returns. There can be no assurance that investments will achieve any targeted rates of return, and there is no guarantee against the loss of your entire investment. POTENTIAL CONFLICT OF INTEREST DISCLOSURE (as on date of report) Disclosure of interest statement – • Analyst interest of the stock /Instrument(s): - No. • Firm interest of the stock / Instrument (s): - No. Amit Pathania Research Associate amit.pathania@choiceindia.com 16th December 2016 Kapil Shah Research Associate kapil.shah@choiceindia.com Kapil Shah Digitally signed by Kapil Shah DN: cn=Kapil Shah, o=Choice Equity Pvt Ltd, ou=Research Team, email=kapil.shah@choiceindia.com, c=US Date: 2016.12.16 09:06:59 +05'30'