
Recommended
More Related Content
What's hot
What's hot (20)
Viewers also liked
Viewers also liked (16)
Similar to Equity bazaar 08.11.2016 (1)
Similar to Equity bazaar 08.11.2016 (1) (14)
Recently uploaded
Recently uploaded (20)
Equity bazaar 08.11.2016 (1)
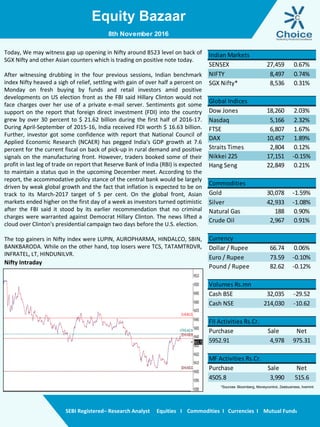
- 1. Equity Bazaar SEBI Registered– Research Analyst Equities I Commodities I Currencies I Mutual Funds Nifty Intraday Today, We may witness gap up opening in Nifty around 8523 level on back of SGX Nifty and other Asian counters which is trading on positive note today. After witnessing drubbing in the four previous sessions, Indian benchmark index Nifty heaved a sigh of relief, settling with gain of over half a percent on Monday on fresh buying by funds and retail investors amid positive developments on US election front as the FBI said Hillary Clinton would not face charges over her use of a private e-mail server. Sentiments got some support on the report that foreign direct investment (FDI) into the country grew by over 30 percent to $ 21.62 billion during the first half of 2016-17. During April-September of 2015-16, India received FDI worth $ 16.63 billion. Further, investor got some confidence with report that National Council of Applied Economic Research (NCAER) has pegged India's GDP growth at 7.6 percent for the current fiscal on back of pick-up in rural demand and positive signals on the manufacturing front. However, traders booked some of their profit in last leg of trade on report that Reserve Bank of India (RBI) is expected to maintain a status quo in the upcoming December meet. According to the report, the accommodative policy stance of the central bank would be largely driven by weak global growth and the fact that inflation is expected to be on track to its March-2017 target of 5 per cent. On the global front, Asian markets ended higher on the first day of a week as investors turned optimistic after the FBI said it stood by its earlier recommendation that no criminal charges were warranted against Democrat Hillary Clinton. The news lifted a cloud over Clinton's presidential campaign two days before the U.S. election. The top gainers in Nifty index were LUPIN, AUROPHARMA, HINDALCO, SBIN, BANKBARODA. While on the other hand, top losers were TCS, TATAMTRDVR, INFRATEL, LT, HINDUNILVR. 8th November 2016 SENSEX 27,459 0.67% NIFTY 8,497 0.74% SGX Nifty* 8,536 0.31% Global Indices Dow Jones 18,260 2.03% Nasdaq 5,166 2.32% FTSE 6,807 1.67% DAX 10,457 1.89% Straits Times 2,804 0.12% Nikkei 225 17,151 -0.15% Hang Seng 22,849 0.21% Commodities Gold 30,078 -1.59% Silver 42,933 -1.08% Natural Gas 188 0.90% Crude Oil 2,967 0.91% Currency Dollar / Rupee 66.74 0.06% Euro / Rupee 73.59 -0.10% Pound / Rupee 82.62 -0.12% Volumes Rs.mn Cash BSE 32,035 -29.52 Cash NSE 214,030 -10.62 FII Activities Rs.Cr. Purchase Sale Net 5952.91 4,978 975.31 MF Activities Rs.Cr. Purchase Sale Net 4505.8 3,990 515.6 Indian Markets *Sources- Bloomberg, Moneycontrol, Zeebusiness, livemint
- 2. Equity Bazaar SEBI Registered– Research Analyst Equities I Commodities I Currencies I Mutual Funds Nifty Outlook Bank Nifty Outlook 8th November 2016 L1 L2 L3 R 8528 8559 8583 S 8474 8450 8419 21 DEMA 8606 50 DEMA 8629 100 DEMA 8517 Moving Averages L1 L2 L3 R 19412 19467 19557 S 19267 19177 19122 21 DEMA 19427 50 DEMA 19375 100 DEMA 18921 Moving Averages After a week sell off Nifty took mild bounce, it opened on positive note and thereafter moved in sideways in later part of day. Nifty formed shaven top which indicate selling from initial ticks and there on it moved in consolidation zone. Momentum oscillator RSI has reading comes at 32 level, it is approaching oversold zone but negative DI is in dominant position. Going forward, Despite of gap up opening it failed to breach previous two day high. So immediate resistance will be around 8550 level and support at 8400 level which is 30 week moving average. After a week sell of Bank Nifty opened on positive note and dimmed power of bears. Index took support at rising trendline and formed hammer pattern which is validated now with price confirmation. Momentum oscillator RSI was not able to recover from negative move as still Negative DI is in dominant position. Going forward, immediate resistance will be at 19500 level around and on downside support at 19200 level. Bounce can be expected from current level.
- 3. Equity Bazaar SEBI Registered– Research Analyst Equities I Commodities I Currencies I Mutual Funds Derivative Front: The India VIX contracted by 2.02% and reached 16.50. The Nifty was up by 63.30 points or 0.75% to settle at 8,497.05. From the most active contracts, ICICI Bank November 2016 futures traded at a premium of 1.15 points at 279.40 compared with spot closing of 278.25. Punjab National Bank November 2016 futures traded at a premium of 0.25 points at 140.55 compared with spot closing of 140.30. State Bank of India November 2016 futures traded at a premium of 1.45 points at 253.60 compared with spot closing of 252.15. Lupin November 2016 futures traded at a premium of 0.50 points at 1520.45 compared with spot closing of 1,519.95. Tata Motors November 2016 futures traded at a premium of 2.20 points at 508.00 compared with spot closing of 505.80. The Nifty PCR finally stood at 0.90 for November month contract. The top five scrips with highest PCR on OI were INDUSINDBK (1.06), GODREJCP (1.00), CENTURYTEX (0.98), CUMMINSIND (0.96) and SIEMENS (0.92). 8th November 2016 Long Built Up Symbol Close Price Chng % OI Chng % Buy Above CROMPGREAV 85.90 12.21 21.34 89.41 NMDC 127.50 0.43 10.32 128.95 FEDERALBNK 77.50 0.78 6.99 78.03 AMARAJABAT 1015 0.55 6.02 1024.93 Short Covering Symbol Close Price Chng % OI Chng % Buy Above LUPIN 1520.45 6.90 -11.17 1539.11 TORNTPHARM 1333.10 2.81 -10.64 1351.36 UBL 895.35 1.94 -10.23 912.67 GLENMARK 896.4 2.93 -8.59 905.64 Short Built Up Symbol Close Price Chng % OI Chng % Sell Below DABUR 296.45 -0.47 10.74 299.43 VOLTAS 360.55 -0.39 7.56 364.12 BRITANNIA 3306.95 -0.13 4.93 3328.38 TCS 2286.45 -2.27 4.78 2317.03 Long Liquidation Symbol Close Price Chng % OI Chng % Sell Below UPL 668.35 -0.75 -5.39 676.28 UNIONBANK 133.30 -0.19 -3.40 135.44 HDFC 1385.60 -0.36 -2.64 1395.19 CENTURYTEX 978.40 -0.44 -2.09 993.45 BANKNIFTY SHORT STRADDLE
- 4. Equity Bazaar SEBI Registered– Research Analyst Equities I Commodities I Currencies I Mutual Funds 8th November 2016 Symbols CLOSE R3 R2 R1 P S1 S2 S3 Trend Action ACC 1483 1540 1528 1506 1495 1472 1461 1427 Down Sell ADANIPORTS 292 304 301 297 294 289 286 279 Down Sell AMBUJACEM 242 252 250 246 244 240 237 231 Down Sell ASIANPAINT 1037 1087 1073 1055 1042 1024 1010 978 Down Sell AUROPHARMA 767 805 791 779 765 753 739 713 Up Buy AXISBANK 484 496 493 488 485 481 478 470 Down Sell BAJAJ-AUTO 2832 2930 2890 2861 2821 2792 2752 2683 Up Buy BANKBARODA 148 155 152 150 147 145 142 138 Up Buy BHARTIARTL 305 318 315 310 307 302 299 290 Down Sell BHEL 139 145 143 141 139 137 134 130 Up Buy BOSCHLTD 21350 22868 22545 21947 21624 21026 20703 19782 Down Sell BPCL 659 688 677 668 657 648 638 618 Up Buy CIPLA 546 565 560 553 548 541 537 525 Down Sell COALINDIA 318 327 325 321 319 316 313 307 Down Sell DRREDDY 3100 3217 3186 3143 3112 3069 3038 2964 Down Sell EICHERMOT 23990 25028 24807 24398 24177 23768 23547 22917 Down Sell GAIL 430 441 436 433 427 425 419 411 Up Buy GRASIM 919 950 940 929 919 908 898 877 Up Buy HCLTECH 814 862 845 829 812 797 780 747 Up Buy HDFC 1376 1423 1412 1394 1384 1365 1355 1327 Down Sell HDFCBANK 1250 1272 1263 1257 1248 1242 1234 1219 Up Buy HEROMOTOCO 3370 3531 3457 3413 3339 3296 3222 3104 Up Buy HINDALCO 167 177 173 170 166 163 158 151 Up Buy HINDUNILVR 837 865 858 848 841 830 824 807 Down Sell ICICIBANK 278 291 286 282 277 273 269 260 Up Buy IDEA 73 75 75 74 73 72 72 70 Down Sell INDUSINDBK 1215 1245 1237 1226 1218 1207 1199 1179 Down Sell INFRATEL 356 383 377 366 360 350 343 326 Down Sell INFY 979 996 991 985 980 974 969 958 Down Sell ITC 257 275 267 262 255 250 242 229 Up Buy KOTAKBANK 802 814 811 806 803 798 795 787 Down Sell LT 1401 1464 1448 1424 1408 1385 1369 1330 Down Sell LUPIN 1520 1586 1561 1540 1515 1494 1469 1422 Up Buy M&M 1380 1415 1404 1392 1381 1369 1359 1336 Down Sell MARUTI 5715 5841 5813 5764 5736 5687 5659 5582 Down Sell NTPC 155 161 159 157 155 153 152 148 Up Buy ONGC 267 280 277 272 269 264 261 254 Down Sell POWERGRID 174 176 175 175 174 174 173 172 Up Buy RELIANCE 1000 1029 1023 1011 1005 994 988 970 Down Sell SBIN 252 264 259 256 251 247 242 234 Up Buy SUNPHARMA 655 694 686 670 662 646 638 614 Down Sell TATAMOTORS 506 533 527 516 511 500 494 478 Down Sell TATAMTRDVR 327 352 347 337 332 322 317 302 Down Sell TATAPOWER 76 78 77 76 76 75 74 73 Up Buy TATASTEEL 410 424 420 415 411 406 402 393 Down Sell TCS 2266 2405 2375 2321 2290 2236 2205 2121 Down Sell TECHM 443 470 460 451 441 432 422 403 Up Buy ULTRACEMCO 3910 4022 3983 3947 3908 3872 3834 3759 Up Buy WIPRO 451 462 459 455 452 448 445 438 Down Sell YESBANK 1206 1252 1242 1224 1214 1196 1186 1158 Down Sell ZEEL 506 526 521 513 508 501 495 482 Down Sell
- 5. Equity Bazaar SEBI Registered– Research Analyst Equities I Commodities I Currencies I Mutual Funds Contact Us www.choicebroking.in Kkunal Parar Sr. Research Associate kkunal.parar@choiceindia.com Vikas Chaudhari Research Associate vikas.chaudhari@choiceindia.com www.choicebroking.incustomercare@choiceindia.com Disclaimer This is solely for information of clients of Choice Broking and does not construe to be an investment advice. It is also not intended as an offer or solicitation for the purchase and sale of any financial instruments. Any action taken by you on the basis of the information contained herein is your responsibility alone and Choice Broking its subsidiaries or its employees or associates will not be liable in any manner for the consequences of such action taken by you. We have exercised due diligence in checking the correctness and authenticity of the information contained in this recommendation, but Choice Broking or any of its subsidiaries or associates or employees shall not be in any way responsible for any loss or damage that may arise to any person from any inadvertent error in the information contained in this recommendation or any action taken on basis of this information. Technical analysis studies market psychology, price patterns and volume levels. It is used to forecast future price and market movements. Technical analysis is complementary to fundamental analysis and news sources. The recommendations issued herewith might be contrary to recommendations issued by Choice Broking in the company research undertaken as the recommendations stated in this report is derived purely from technical analysis. Choice Broking has based this document on information obtained from sources it believes to be reliable but which it has not independently verified; Choice Broking makes no guarantee, representation or warranty and accepts no responsibility or liability as to its accuracy or completeness. The opinions contained within the report are based upon publicly available information at the time of publication and are subject to change without notice. The information and any disclosures provided herein are in summary form and have been prepared for informational purposes. The recommendations and suggested price levels are intended purely for trading purposes. The recommendations are valid for the day of the report however trading trends and volumes might vary substantially on an intraday basis and the recommendations may be subject to change. The information and any disclosures provided herein may be considered confidential. Any use, distribution, modification, copying, forwarding or disclosure by any person is strictly prohibited. The information and any disclosures provided herein do not constitute a solicitation or offer to purchase or sell any security or other financial product or instrument. The current performance may be unaudited. Past performance does not guarantee future returns. There can be no assurance that investments will achieve any targeted rates of return, and there is no guarantee against the loss of your entire investment. POTENTIAL CONFLICT OF INTEREST DISCLOSURE (as on date of report) Disclosure of interest statement – • Analyst interest of the stock /Instrument(s): - No. • Firm interest of the stock / Instrument (s): - No. Amit Pathania Research Associate amit.pathania@choiceindia.com 8th November 2016 Kapil Shah Research Associate kapil.shah@choiceindia.com Kapil Shah Digitally signed by Kapil Shah DN: cn=Kapil Shah, o=Choice Equity Pvt Ltd, ou=Research Team, email=kapil.shah@choiceindia.com, c=US Date: 2016.11.08 09:14:45 +05'30'