
Recommended
More Related Content
What's hot
What's hot (20)
Similar to Equity bazaar 17.11.2016
Similar to Equity bazaar 17.11.2016 (16)
Recently uploaded
Recently uploaded (20)
Equity bazaar 17.11.2016
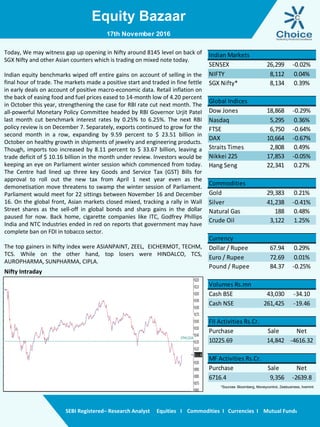
- 1. Equity Bazaar SEBI Registered– Research Analyst Equities I Commodities I Currencies I Mutual Funds Nifty Intraday Today, We may witness gap up opening in Nifty around 8145 level on back of SGX Nifty and other Asian counters which is trading on mixed note today. Indian equity benchmarks wiped off entire gains on account of selling in the final hour of trade. The markets made a positive start and traded in fine fettle in early deals on account of positive macro-economic data. Retail inflation on the back of easing food and fuel prices eased to 14-month low of 4.20 percent in October this year, strengthening the case for RBI rate cut next month. The all-powerful Monetary Policy Committee headed by RBI Governor Urjit Patel last month cut benchmark interest rates by 0.25% to 6.25%. The next RBI policy review is on December 7. Separately, exports continued to grow for the second month in a row, expanding by 9.59 percent to $ 23.51 billion in October on healthy growth in shipments of jewelry and engineering products. Though, imports too increased by 8.11 percent to $ 33.67 billion, leaving a trade deficit of $ 10.16 billion in the month under review. Investors would be keeping an eye on Parliament winter session which commenced from today. The Centre had lined up three key Goods and Service Tax (GST) Bills for approval to roll out the new tax from April 1 next year even as the demonetisation move threatens to swamp the winter session of Parliament. Parliament would meet for 22 sittings between November 16 and December 16. On the global front, Asian markets closed mixed, tracking a rally in Wall Street shares as the sell-off in global bonds and sharp gains in the dollar paused for now. Back home, cigarette companies like ITC, Godfrey Phillips India and NTC Industries ended in red on reports that government may have complete ban on FDI in tobacco sector. The top gainers in Nifty index were ASIANPAINT, ZEEL, EICHERMOT, TECHM, TCS. While on the other hand, top losers were HINDALCO, TCS, AUROPHARMA, SUNPHARMA, CIPLA. 17th November 2016 SENSEX 26,299 -0.02% NIFTY 8,112 0.04% SGX Nifty* 8,134 0.39% Global Indices Dow Jones 18,868 -0.29% Nasdaq 5,295 0.36% FTSE 6,750 -0.64% DAX 10,664 -0.67% Straits Times 2,808 0.49% Nikkei 225 17,853 -0.05% Hang Seng 22,341 0.27% Commodities Gold 29,383 0.21% Silver 41,238 -0.41% Natural Gas 188 0.48% Crude Oil 3,122 1.25% Currency Dollar / Rupee 67.94 0.29% Euro / Rupee 72.69 0.01% Pound / Rupee 84.37 -0.25% Volumes Rs.mn Cash BSE 43,030 -34.10 Cash NSE 261,425 -19.46 FII Activities Rs.Cr. Purchase Sale Net 10225.69 14,842 -4616.32 MF Activities Rs.Cr. Purchase Sale Net 6716.4 9,356 -2639.8 Indian Markets *Sources- Bloomberg, Moneycontrol, Zeebusiness, livemint
- 2. Equity Bazaar SEBI Registered– Research Analyst Equities I Commodities I Currencies I Mutual Funds Nifty Outlook Bank Nifty Outlook 17th November 2016 L1 L2 L3 R 8185 8258 8305 S 8064 8016 7943 21 DEMA 8477 50 DEMA 8564 100 DEMA 8494 Moving Averages L1 L2 L3 R 19451 19793 19974 S 18927 18746 18404 21 DEMA 19473 50 DEMA 19412 100 DEMA 18986 Moving Averages Nifty ended on flat note but there was huge volatility during the session. Nifty kept on criss crossing between 100 points. From past 2 trading session Nifty is forming shaven top which indicate selling from initial ticks and bears dominated entire trading session. Momentum oscillator RSI has breached its previous low and entered below 30 level which is considered as oversold territory Going forward, as nifty breached its previous day low further negativity can be expected upto 8050 to 8000 level. Bank Nifty seems to losing its strength as its counterparts are facing resistance at higher level. Index has erased its all gain in initial hour and thereafter moved in tight range with mild negative bias Momentum oscillator RSI has breached below its average line which indicate negative crossover. Going forward, index has good support at 19000 level sustainability below that index can further drift down to 18800 level.
- 3. Equity Bazaar SEBI Registered– Research Analyst Equities I Commodities I Currencies I Mutual Funds Derivative Front: The India VIX slipping by 3.19% and reached 19.50. The Nifty was up by 3.15 points or 0.04% to settle at 8,111.60. From the most active contracts, ICICI Bank futures traded at a premium of 0.65 points at 267.15 compared with spot closing of 266.50. SBI futures traded at a discount of 0.60 points at 277.05 compared with spot closing of 277.65. Bank of Baroda futures traded at a discount of 0.10 points at 173.35 compared with spot closing of 173.45. Axis Bank futures traded at a premium of 2.15 points at 474.00 compared with spot closing of 471.85. Tata Motors futures traded at a discount of 0.55 points at 459.15 compared with spot closing of 459.70. The Nifty PCR finally stood at 0.67 for November month contract. The top five scrips with highest PCR on OI were JSW Steel (1), UBL (0.90), Cummins India (0.89), Oil India (0.82) and BPCL (0.81). 17th November 2016 Long Built Up Symbol Close Price Chng % OI Chng % Buy Above SAIL 49.75 0.10 9.62 50.38 TVSMOTOR 351.10 1.69 5.92 357.69 CENTURYTEX 773.15 0.78 4.70 791.35 PAGEIND 13013.4 0.39 3.19 13442.33 Short Covering Symbol Close Price Chng % OI Chng % Buy Above BHARATFIN 685.20 8.16 -15.49 #N/A ULTRACEMCO 3365.80 0.07 -12.81 3436.68 PIDILITIND 622.85 1.01 -10.68 632.97 TCS 2193.95 2.83 -9.79 2221.24 Short Built Up Symbol Close Price Chng % OI Chng % Sell Below AMBUJACEM 203.00 -3.13 17.56 207.28 PCJEWELLER 325.15 -8.49 15.82 345.78 APOLLOTYRE 184.80 -1.07 9.44 187.86 INFRATEL 361.5 -1.19 6.16 365.97 Long Liquidation Symbol Close Price Chng % OI Chng % Sell Below ORIENTBANK 122.50 -0.28 -7.49 124.56 NCC 75.25 -0.20 -6.71 76.82 IGL 821.35 -0.01 -6.62 834.62 ONGC 272.60 -1.37 -4.97 277.76 TCS COVERED CALL
- 4. Equity Bazaar SEBI Registered– Research Analyst Equities I Commodities I Currencies I Mutual Funds 17th November 2016 Symbols CLOSE R3 R2 R1 P S1 S2 S3 Trend Action ACC 1332 1436 1405 1369 1338 1302 1271 1204 Down Sell ADANIPORTS 265 287 281 273 267 259 253 239 Down Sell AMBUJACEM 203 222 217 210 206 198 194 182 Down Sell ASIANPAINT 940 999 973 956 930 913 887 844 Up Buy AUROPHARMA 711 805 781 746 722 687 663 604 Down Sell AXISBANK 472 500 494 483 476 466 459 442 Down Sell BAJAJ-AUTO 2615 2755 2709 2662 2616 2569 2523 2431 Down Sell BANKBARODA 173 189 184 179 173 168 163 153 Up Buy BHARTIARTL 308 320 316 312 308 304 300 291 Up Buy BHEL 132 141 139 135 133 130 128 122 Down Sell BOSCHLTD 19165 20270 20035 19600 19365 18930 18695 18025 Down Sell BPCL 634 685 673 654 641 622 609 578 Down Sell CIPLA 536 585 575 555 545 526 516 487 Down Sell COALINDIA 313 326 322 317 313 309 305 297 Up Buy DRREDDY 3221 3479 3417 3319 3257 3159 3097 2937 Down Sell EICHERMOT 21035 23677 22738 21887 20948 20097 19158 17368 Up Buy GAIL 427 462 454 440 432 419 411 390 Down Sell GRASIM 819 876 856 837 818 799 780 741 Up Buy HCLTECH 770 808 798 784 774 760 750 727 Down Sell HDFC 1253 1315 1290 1272 1247 1228 1203 1159 Up Buy HDFCBANK 1242 1288 1278 1260 1250 1232 1222 1194 Down Sell HEROMOTOCO 2910 3109 3062 2986 2939 2863 2816 2693 Down Sell HINDALCO 161 180 177 169 165 157 154 142 Down Sell HINDUNILVR 810 832 823 816 807 801 792 776 Up Buy ICICIBANK 267 289 284 275 270 261 256 242 Down Sell IDEA 70 75 74 72 71 69 68 65 Down Sell INDUSINDBK 1098 1158 1137 1117 1097 1077 1056 1016 Up Buy INFRATEL 360 381 375 368 361 354 348 334 Down Sell INFY 935 980 969 952 940 924 912 884 Down Sell ITC 229 247 243 236 232 225 221 210 Down Sell KOTAKBANK 770 819 808 789 778 759 748 718 Down Sell LT 1372 1427 1408 1390 1370 1353 1333 1296 Up Buy LUPIN 1400 1504 1479 1440 1415 1375 1351 1287 Down Sell M&M 1220 1318 1298 1259 1239 1200 1181 1122 Down Sell MARUTI 4980 5134 5072 5026 4964 4918 4856 4748 Up Buy NTPC 150 154 153 151 150 149 148 145 Down Sell ONGC 272 294 289 281 276 267 262 249 Down Sell POWERGRID 188 198 194 191 187 184 180 173 Up Buy RELIANCE 982 1008 1003 992 987 976 970 954 Down Sell SBIN 278 292 288 283 280 274 271 262 Down Sell SUNPHARMA 661 719 707 684 672 649 637 603 Down Sell TATAMOTORS 460 493 482 471 460 449 439 417 Down Sell TATAMTRDVR 295 324 315 305 296 286 277 258 Down Sell TATAPOWER 71 74 73 72 71 70 69 66 Up Buy TATASTEEL 391 422 412 401 391 381 371 350 Down Sell TCS 2188 2289 2249 2218 2178 2147 2107 2036 Up Buy TECHM 445 466 457 451 442 436 427 412 Up Buy ULTRACEMCO 3374 3570 3518 3446 3395 3322 3271 3147 Down Sell WIPRO 444 464 459 452 447 439 434 422 Down Sell YESBANK 1177 1272 1235 1206 1170 1141 1104 1039 Up Buy ZEEL 473 507 494 484 472 461 449 426 Up Buy
- 5. Equity Bazaar SEBI Registered– Research Analyst Equities I Commodities I Currencies I Mutual Funds Contact Us www.choicebroking.in Kkunal Parar Sr. Research Associate kkunal.parar@choiceindia.com Vikas Chaudhari Research Associate vikas.chaudhari@choiceindia.com www.choicebroking.incustomercare@choiceindia.com Disclaimer This is solely for information of clients of Choice Broking and does not construe to be an investment advice. It is also not intended as an offer or solicitation for the purchase and sale of any financial instruments. Any action taken by you on the basis of the information contained herein is your responsibility alone and Choice Broking its subsidiaries or its employees or associates will not be liable in any manner for the consequences of such action taken by you. We have exercised due diligence in checking the correctness and authenticity of the information contained in this recommendation, but Choice Broking or any of its subsidiaries or associates or employees shall not be in any way responsible for any loss or damage that may arise to any person from any inadvertent error in the information contained in this recommendation or any action taken on basis of this information. Technical analysis studies market psychology, price patterns and volume levels. It is used to forecast future price and market movements. Technical analysis is complementary to fundamental analysis and news sources. The recommendations issued herewith might be contrary to recommendations issued by Choice Broking in the company research undertaken as the recommendations stated in this report is derived purely from technical analysis. Choice Broking has based this document on information obtained from sources it believes to be reliable but which it has not independently verified; Choice Broking makes no guarantee, representation or warranty and accepts no responsibility or liability as to its accuracy or completeness. The opinions contained within the report are based upon publicly available information at the time of publication and are subject to change without notice. The information and any disclosures provided herein are in summary form and have been prepared for informational purposes. The recommendations and suggested price levels are intended purely for trading purposes. The recommendations are valid for the day of the report however trading trends and volumes might vary substantially on an intraday basis and the recommendations may be subject to change. The information and any disclosures provided herein may be considered confidential. Any use, distribution, modification, copying, forwarding or disclosure by any person is strictly prohibited. The information and any disclosures provided herein do not constitute a solicitation or offer to purchase or sell any security or other financial product or instrument. The current performance may be unaudited. Past performance does not guarantee future returns. There can be no assurance that investments will achieve any targeted rates of return, and there is no guarantee against the loss of your entire investment. POTENTIAL CONFLICT OF INTEREST DISCLOSURE (as on date of report) Disclosure of interest statement – • Analyst interest of the stock /Instrument(s): - No. • Firm interest of the stock / Instrument (s): - No. Amit Pathania Research Associate amit.pathania@choiceindia.com 17th November 2016 Kapil Shah Research Associate kapil.shah@choiceindia.com Kapil Shah Digitally signed by Kapil Shah DN: cn=Kapil Shah, o=Choice Equity Pvt Ltd, ou=Research Team, email=kapil.shah@choiceindia.com, c=US Date: 2016.11.17 08:56:07 +05'30'