
Recommended
More Related Content
What's hot
What's hot (20)
Similar to Equity bazaar 24.05.2016
Similar to Equity bazaar 24.05.2016 (15)
Recently uploaded
Recently uploaded (20)
Equity bazaar 24.05.2016
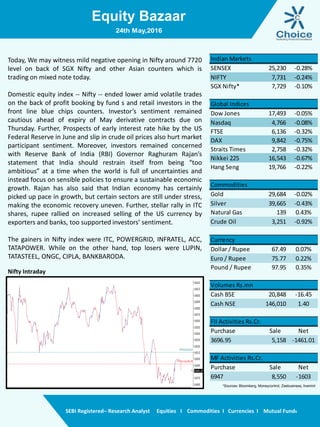
- 1. Equity Bazaar SEBI Registered– Research Analyst Equities I Commodities I Currencies I Mutual Funds Nifty Intraday Today, We may witness mild negative opening in Nifty around 7720 level on back of SGX Nifty and other Asian counters which is trading on mixed note today. Domestic equity index -- Nifty -- ended lower amid volatile trades on the back of profit booking by fund s and retail investors in the front line blue chips counters. Investor’s sentiment remained cautious ahead of expiry of May derivative contracts due on Thursday. Further, Prospects of early interest rate hike by the US Federal Reserve in June and slip in crude oil prices also hurt market participant sentiment. Moreover, investors remained concerned with Reserve Bank of India (RBI) Governor Raghuram Rajan’s statement that India should restrain itself from being “too ambitious” at a time when the world is full of uncertainties and instead focus on sensible policies to ensure a sustainable economic growth. Rajan has also said that Indian economy has certainly picked up pace in growth, but certain sectors are still under stress, making the economic recovery uneven. Further, stellar rally in ITC shares, rupee rallied on increased selling of the US currency by exporters and banks, too supported investors’ sentiment. The gainers in Nifty index were ITC, POWERGRID, INFRATEL, ACC, TATAPOWER. While on the other hand, top losers were LUPIN, TATASTEEL, ONGC, CIPLA, BANKBARODA. 24th May,2016 SENSEX 25,230 -0.28% NIFTY 7,731 -0.24% SGX Nifty* 7,729 -0.10% Global Indices Dow Jones 17,493 -0.05% Nasdaq 4,766 -0.08% FTSE 6,136 -0.32% DAX 9,842 -0.75% Straits Times 2,758 -0.32% Nikkei 225 16,543 -0.67% Hang Seng 19,766 -0.22% Commodities Gold 29,684 -0.02% Silver 39,665 -0.43% Natural Gas 139 0.43% Crude Oil 3,251 -0.92% Currency Dollar / Rupee 67.49 0.07% Euro / Rupee 75.77 0.22% Pound / Rupee 97.95 0.35% Volumes Rs.mn Cash BSE 20,848 -16.45 Cash NSE 146,010 1.40 FII Activities Rs.Cr. Purchase Sale Net 3696.95 5,158 -1461.01 MF Activities Rs.Cr. Purchase Sale Net 6947 8,550 -1603 Indian Markets *Sources- Bloomberg, Moneycontrol, Zeebusiness, livemint
- 2. Equity Bazaar SEBI Registered– Research Analyst Equities I Commodities I Currencies I Mutual Funds Nifty Outlook BankNifty Outlook 21 DEMA 7830 50 DEMA 7731 100 DEMA 7576 Moving Averages L1 L2 L3 R 7790 7850 7884 S 7697 7663 7604 L1 L2 L3 R 17137 16692 16782 S 16318 16228 16086 21 DEMA 16638 50 DEMA 16070 100 DEMA 15707 Moving Averages Bank Nifty closed at 16407 with loss of -0.45%. Bank Nifty opened on strong positive note but did not able to sustain at higher level and continued to slide down thereafter. Bank Nifty is sliding for past 8 trading session and recently index has breached its 21 and 250 days moving average. Among Bank Nifty index 9 banking stock ended on negative note, major pain came from public sector banks. Going forward, Bank Nifty likely to trade with negative bias till it sustain below 17000 level from positional perspective. On down side immediate support will be 16350 level. 24th May,2016 Nifty opened on strong positive note but did not able to sustain at higher level and continued to slide down thereafter. Volatility continued on 10th day as Nifty kept on swung between green zone to red zone. Nifty closed at 7731 level with loss of -18 points or -0.24%. From candlestick perspective Nifty has formed bear candle. Nifty again started to trade below 21 DMA and 250 DMA which are potential support point for Nifty. Going forward, Nifty seems to be in the range of 7700 to 7900. Fresh upside momentum can be expected above 7900 level only. On downside immediate support will be around 7680 level.
- 3. Equity Bazaar SEBI Registered– Research Analyst Equities I Commodities I Currencies I Mutual Funds Derivative Front: The VIX decreased by 1.61% and reached 16.16. The 50-share Nifty was down by 18.65 points or 0.24% to settle at 7,731.05. The top gainers from the F&O segment were The ITC, Shriram Transport Finance Company and Biocon. On the other hand, the top losers were Lupin, Tata Steel and Oil & Natural Gas Corporation. In the index options segment, maximum OI was being seen in the 7700-8500 calls and 7000-7900 puts. In today's session, while the traders preferred to exit 7800 put, heavy buildup was seen in the 7650 put. On the other hand, traders exited from 7900 Call, while 7750 call witnessed considerable OI addition. The Nifty Put Call Ratio (PCR) finally stood at 0.76 for May month contract. The top five scrips with highest PCR on OI were Indiabulls Real Estate (1.33), Indusind Bank (1.32), ITC (1.13), Bharti Infratel of India (1.07) and Axis bank (1.05). Long Built Up Symbol Close Price Chng % OI Chng % Buy Above TATACHEM 415.85 2.05 1.81 417.65 Short Covering Symbol Close Price Chng % OI Chng % Buy Above CESC 567.80 6.28 -57.56 577.16 IBULHSGFIN 692.25 1.34 -49.34 700.46 JSWSTEEL 1319.65 1.67 -49.17 1331.28 SKSMICRO 605.55 2.73 -40.44 612.94 Short Built Up Symbol Close Price Chng % OI Chng % Sell Below AMARAJABAT 919.40 -3.87 15.92 939.84 JUSTDIAL 682.50 -2.96 9.92 724.37 CASTROLIND 370.40 -12.90 3.26 373.21 PETRONET 260.4 -6.16 2.27 263.63 Long Liquidation Symbol Close Price Chng % OI Chng % Sell Below BHARTIARTL 345.55 -4.05 -40.73 348.32 SUNPHARMA 784.85 -1.66 -40.20 790.54 HDFCBANK 1138.90 -0.32 -38.64 1144.52 HDFC 1163.15 -3.64 -35.77 1172.01 24th May,2016
- 4. Equity Bazaar SEBI Registered– Research Analyst Equities I Commodities I Currencies I Mutual Funds Symbols OPEN HIGH LOW CLOSE R3 R2 R1 P S1 S2 S3 Trend Action ACC 1393 1428 1390 1420 1489 1451 1435 1413 1397 1375 1337 Up Buy ADANIPORTS 179 182 178 181 189 185 183 180 178 176 171 Up Buy AMBUJACEM 210 213 209 212 221 216 214 212 210 207 202 Up Buy ASIANPAINT 960 960 944 949 984 967 958 951 942 935 918 Down Sell AUROPHARMA 776 780 754 754 815 789 771 763 745 737 711 Down Sell AXISBANK 495 495 485 486 510 499 492 489 482 478 468 Down Sell BAJAJ-AUTO 2461 2464 2409 2413 2539 2484 2448 2428 2393 2373 2318 Down Sell BANKBARODA 136 136 131 132 143 138 135 133 130 128 123 Down Sell BHARTIARTL 347 349 342 346 360 353 349 345 342 338 331 Up Buy BHEL 120 120 118 119 123 121 120 119 118 117 115 Down Sell BOSCHLTD 21114 21394 20866 20970 22132 21604 21287 21077 20760 20549 20022 Down Sell BPCL 927 932 911 918 962 941 929 920 908 899 878 Down Sell CIPLA 510 510 495 495 530 515 505 500 490 485 470 Down Sell COALINDIA 281 282 278 281 287 284 283 280 279 277 274 Up Buy DRREDDY 3020 3047 3019 3034 3090 3062 3048 3033 3020 3005 2977 Up Buy EICHERMOT 18380 18440 18200 18200 18760 18520 18360 18280 18120 18040 17800 Down Sell GAIL 375 380 368 370 397 385 378 373 366 361 349 Down Sell GRASIM 4225 4259 4191 4206 4354 4287 4246 4219 4179 4151 4083 Down Sell HCLTECH 738 740 732 732 750 743 737 735 730 727 719 Down Sell HDFC 1184 1187 1158 1162 1227 1198 1180 1169 1151 1140 1112 Down Sell HDFCBANK 1142 1150 1133 1135 1173 1156 1146 1139 1129 1123 1106 Down Sell HEROMOTOCO 2902 2905 2869 2890 2959 2924 2907 2888 2871 2852 2817 Up Buy HINDALCO 88 88 86 87 92 89 88 87 86 85 83 Down Sell HINDUNILVR 817 826 813 819 845 832 825 819 813 806 794 Down Sell ICICIBANK 222 224 220 221 229 225 223 222 219 218 215 Down Sell IDEA 110 111 109 110 115 112 111 110 109 108 105 Up Buy INDUSINDBK 1072 1080 1050 1054 1121 1091 1072 1061 1043 1032 1002 Down Sell INFRATEL 378 388 376 385 407 395 390 383 378 371 358 Up Buy INFY 1203 1205 1185 1188 1233 1213 1201 1193 1180 1173 1152 Down Sell ITC 350 355 340 347 377 362 355 347 340 332 317 Up Buy KOTAKBANK 706 711 701 701 724 714 707 704 698 695 685 Down Sell LT 1264 1266 1238 1244 1305 1277 1260 1249 1232 1221 1193 Down Sell LUPIN 1522 1527 1451 1455 1629 1553 1504 1478 1429 1402 1327 Down Sell M&M 1301 1301 1280 1286 1331 1310 1298 1289 1277 1268 1247 Down Sell MARUTI 3964 3968 3900 3904 4061 3992 3948 3924 3880 3856 3788 Down Sell NTPC 137 138 135 136 142 139 138 136 135 134 131 Down Sell ONGC 214 215 208 208 224 217 212 210 205 203 196 Down Sell POWERGRID 146 149 145 149 155 151 150 148 146 144 140 Up Buy RELIANCE 937 941 926 931 963 948 939 932 924 917 902 Down Sell SBIN 172 173 168 168 179 174 171 170 167 165 161 Down Sell SUNPHARMA 793 794 779 785 815 800 793 786 778 772 757 Down Sell TATAMOTORS 389 390 380 383 404 394 389 384 379 375 365 Down Sell TATAMTRDVR 266 266 259 260 276 269 265 262 257 255 247 Down Sell TATAPOWER 71 71 70 71 73 72 71 71 70 70 68 Down Sell TATASTEEL 325 326 313 314 344 331 322 317 309 304 291 Down Sell TCS 2544 2546 2480 2483 2634 2569 2526 2503 2460 2437 2372 Down Sell TECHM 478 481 473 475 493 484 480 476 472 468 460 Down Sell ULTRACEMCO 3136 3157 3110 3130 3225 3179 3154 3132 3108 3086 3039 Down Sell WIPRO 544 544 538 539 553 547 543 541 537 534 528 Down Sell YESBANK 983 985 975 975 999 989 982 978 971 968 957 Down Sell 24th May,2016
- 5. Equity Bazaar SEBI Registered– Research Analyst Equities I Commodities I Currencies I Mutual Funds Contact Us www.choiceindia.com Kunal Parmar Research Associate kunal.parmar@choiceindia.com Vikas Chaudhari Research Associate vikas.chaudhari@choiceindia.com www.choiceindia.comcustomercare@choiceindia.com Disclaimer This is solely for information of clients of Choice Broking and does not construe to be an investment advice. It is also not intended as an offer or solicitation for the purchase and sale of any financial instruments. Any action taken by you on the basis of the information contained herein is your responsibility alone and Choice Broking its subsidiaries or its employees or associates will not be liable in any manner for the consequences of such action taken by you. We have exercised due diligence in checking the correctness and authenticity of the information contained in this recommendation, but Choice Broking or any of its subsidiaries or associates or employees shall not be in any way responsible for any loss or damage that may arise to any person from any inadvertent error in the information contained in this recommendation or any action taken on basis of this information. Technical analysis studies market psychology, price patterns and volume levels. It is used to forecast future price and market movements. Technical analysis is complementary to fundamental analysis and news sources. The recommendations issued herewith might be contrary to recommendations issued by Choice Broking in the company research undertaken as the recommendations stated in this report is derived purely from technical analysis. Choice Broking has based this document on information obtained from sources it believes to be reliable but which it has not independently verified; Choice Broking makes no guarantee, representation or warranty and accepts no responsibility or liability as to its accuracy or completeness. The opinions contained within the report are based upon publicly available information at the time of publication and are subject to change without notice. The information and any disclosures provided herein are in summary form and have been prepared for informational purposes. The recommendations and suggested price levels are intended purely for trading purposes. The recommendations are valid for the day of the report however trading trends and volumes might vary substantially on an intraday basis and the recommendations may be subject to change. The information and any disclosures provided herein may be considered confidential. Any use, distribution, modification, copying, forwarding or disclosure by any person is strictly prohibited. The information and any disclosures provided herein do not constitute a solicitation or offer to purchase or sell any security or other financial product or instrument. The current performance may be unaudited. Past performance does not guarantee future returns. There can be no assurance that investments will achieve any targeted rates of return, and there is no guarantee against the loss of your entire investment. POTENTIAL CONFLICT OF INTEREST DISCLOSURE (as on date of report) Disclosure of interest statement – • Analyst interest of the stock /Instrument(s): - No. • Firm interest of the stock / Instrument (s): - No. Amit Pathania Research Associate amit.pathania@choiceindia.com 24th May,2016 Kapil Shah Research Associate kapil.shah@choiceindia.com Kapil Shah Digitally signed by Kapil Shah DN: cn=Kapil Shah, o=Choice Equity Broking Pvt Ttd., ou=Research Department, email=kapil.shah@choiceindia.com, c=IN Date: 2016.05.24 08:46:57 +05'30'