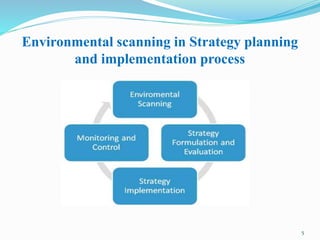
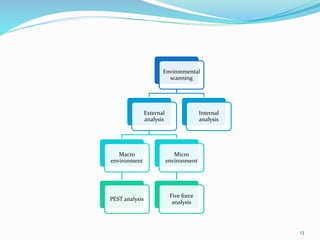
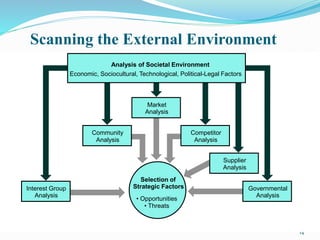
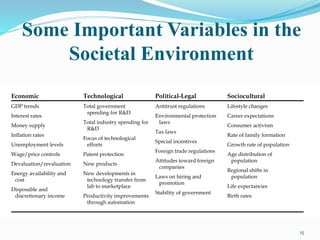
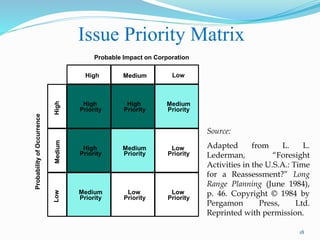
Environmental scanning is the process of gathering information about events and relationships within a company's external environment that could impact its strategy. It aims to identify potential opportunities and threats from trends and events in the political, economic, social and technological spheres. Effective environmental scanning involves continuously collecting both quantitative and qualitative data, analyzing and interpreting it, and using the insights to inform strategic planning and decision-making. There are various techniques for conducting environmental scans, such as SWOT analysis, PEST analysis, and issue priority matrices, which help assess trends and their potential impact on the organization.