Download as PDF, PPTX

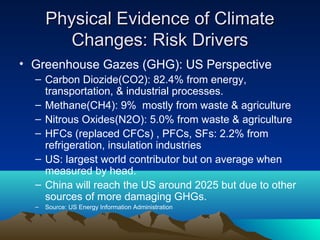
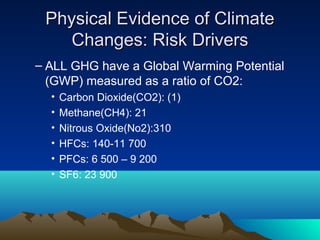
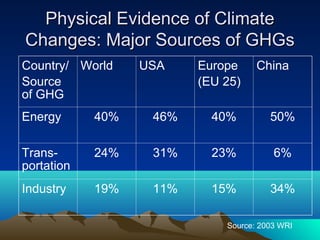
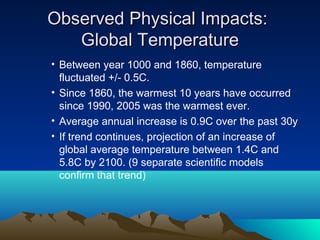
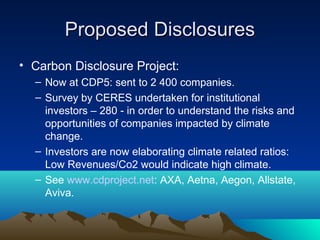
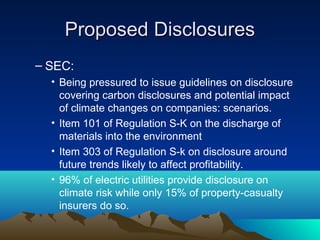
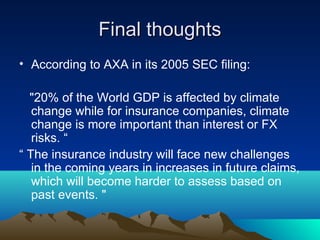

This document summarizes key points from a presentation on climate risk given by Michel Rochette. The presentation covers physical evidence of climate change, observed and projected impacts such as rising temperatures and sea levels, government and industry efforts to address climate change, and risks to businesses from climate change including regulatory, investment, litigation, physical, and reputational risks. The presentation also discusses proposed disclosure requirements from organizations like the SEC, Carbon Disclosure Project, and Global Reporting Initiative regarding companies' climate-related risks and impacts.


