Download to read offline


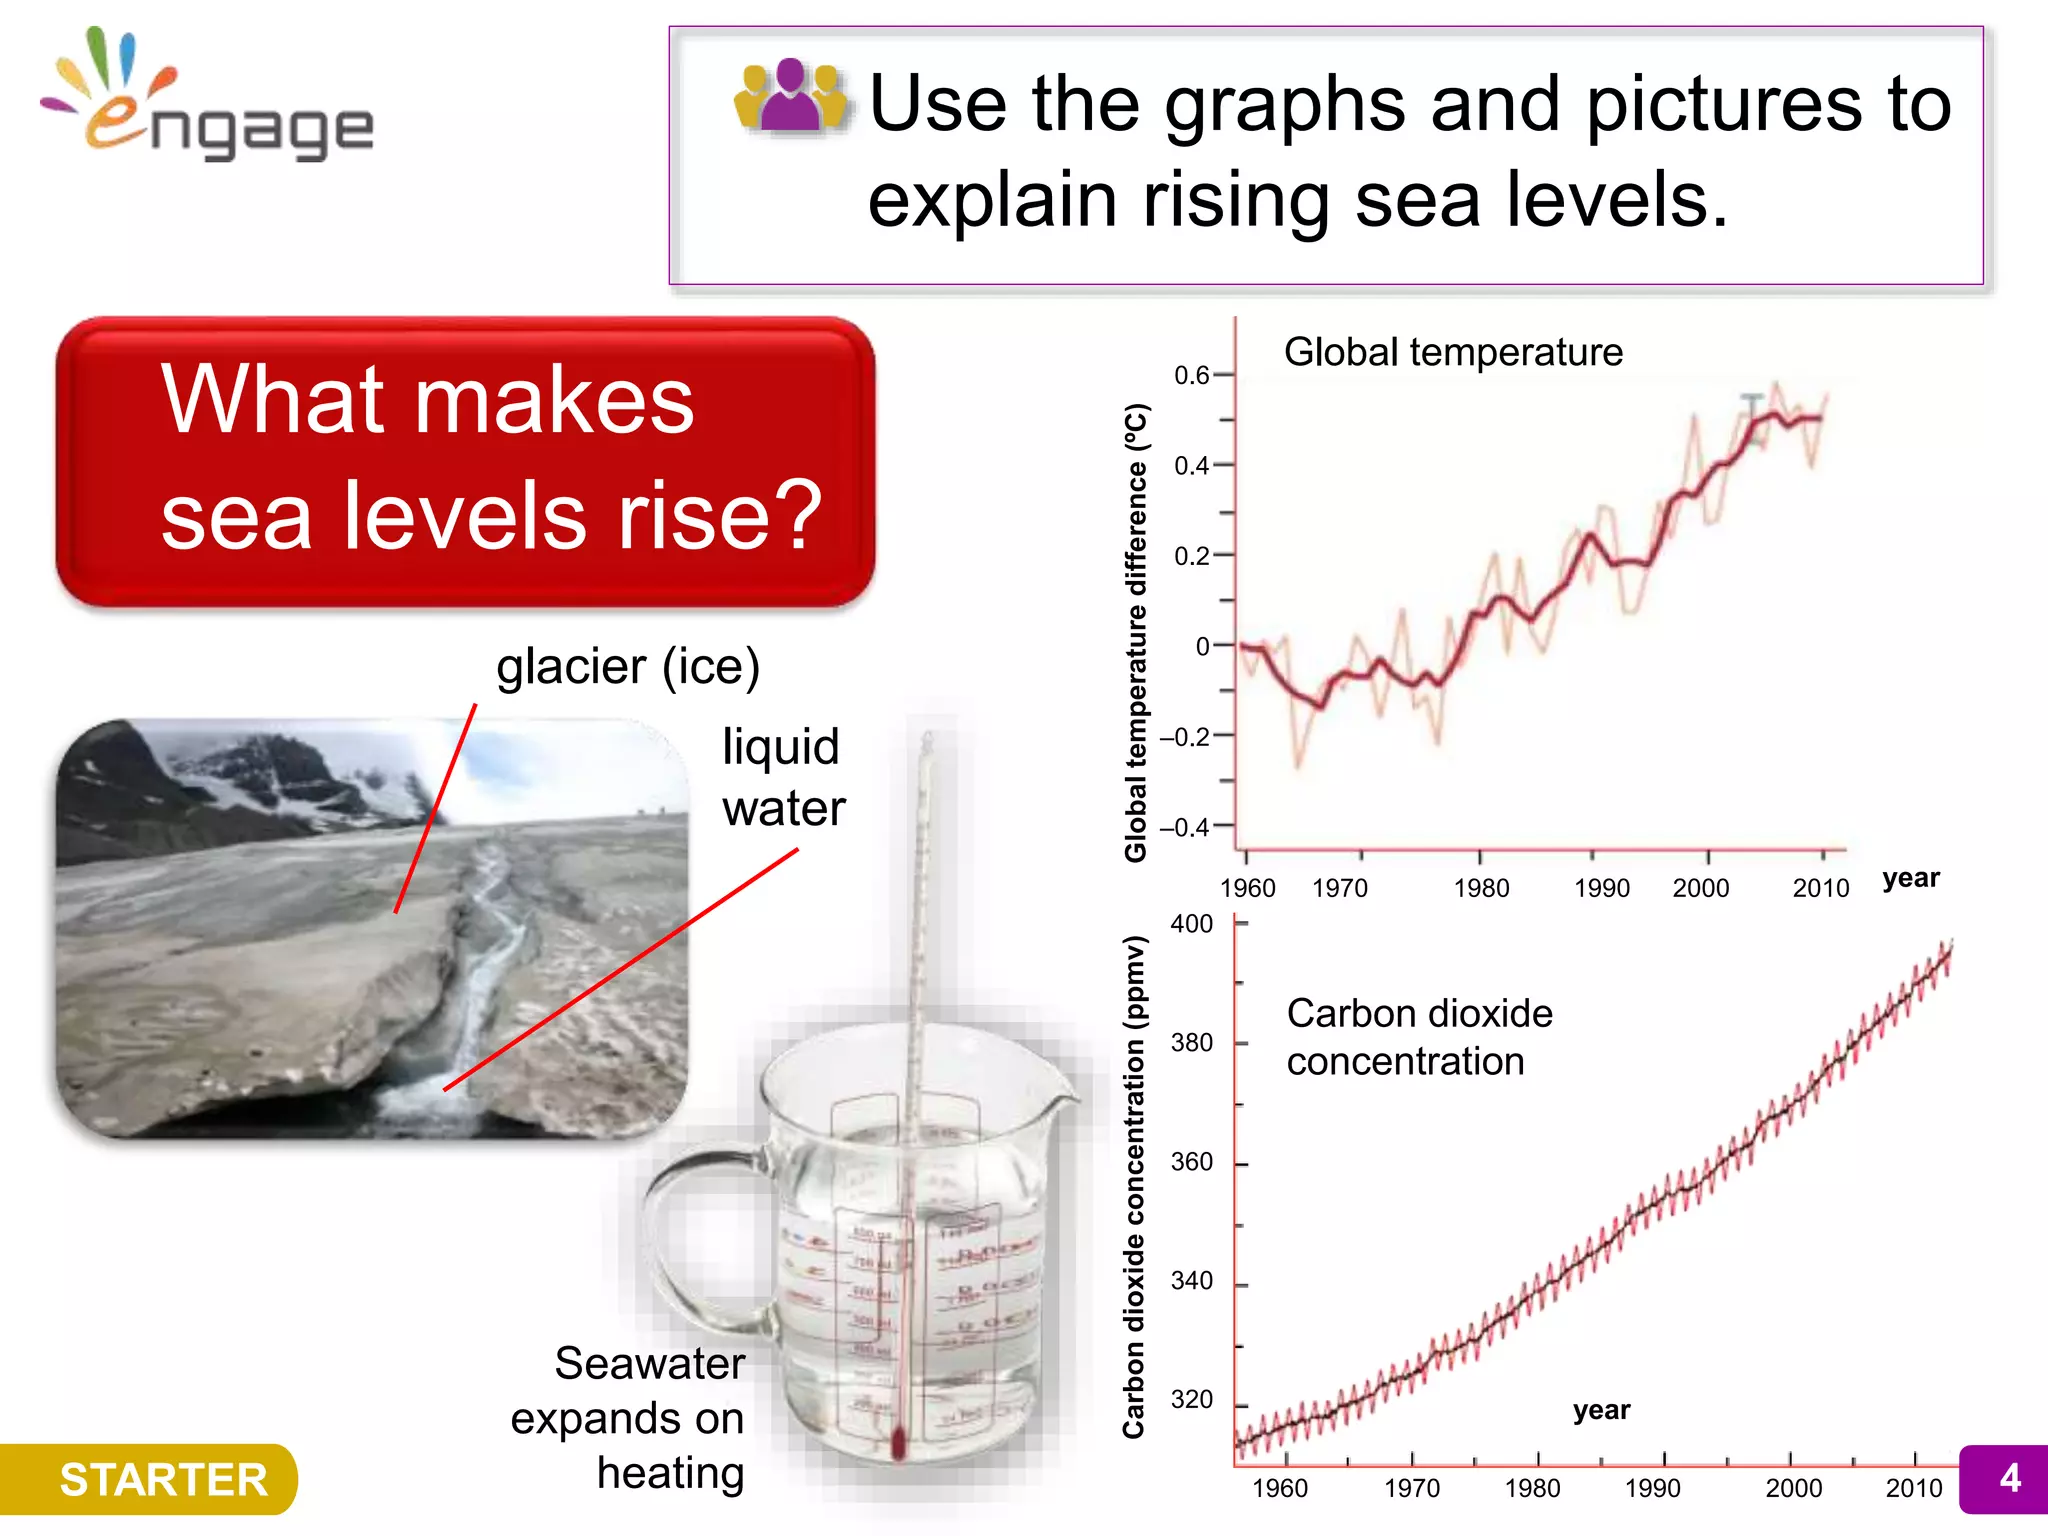
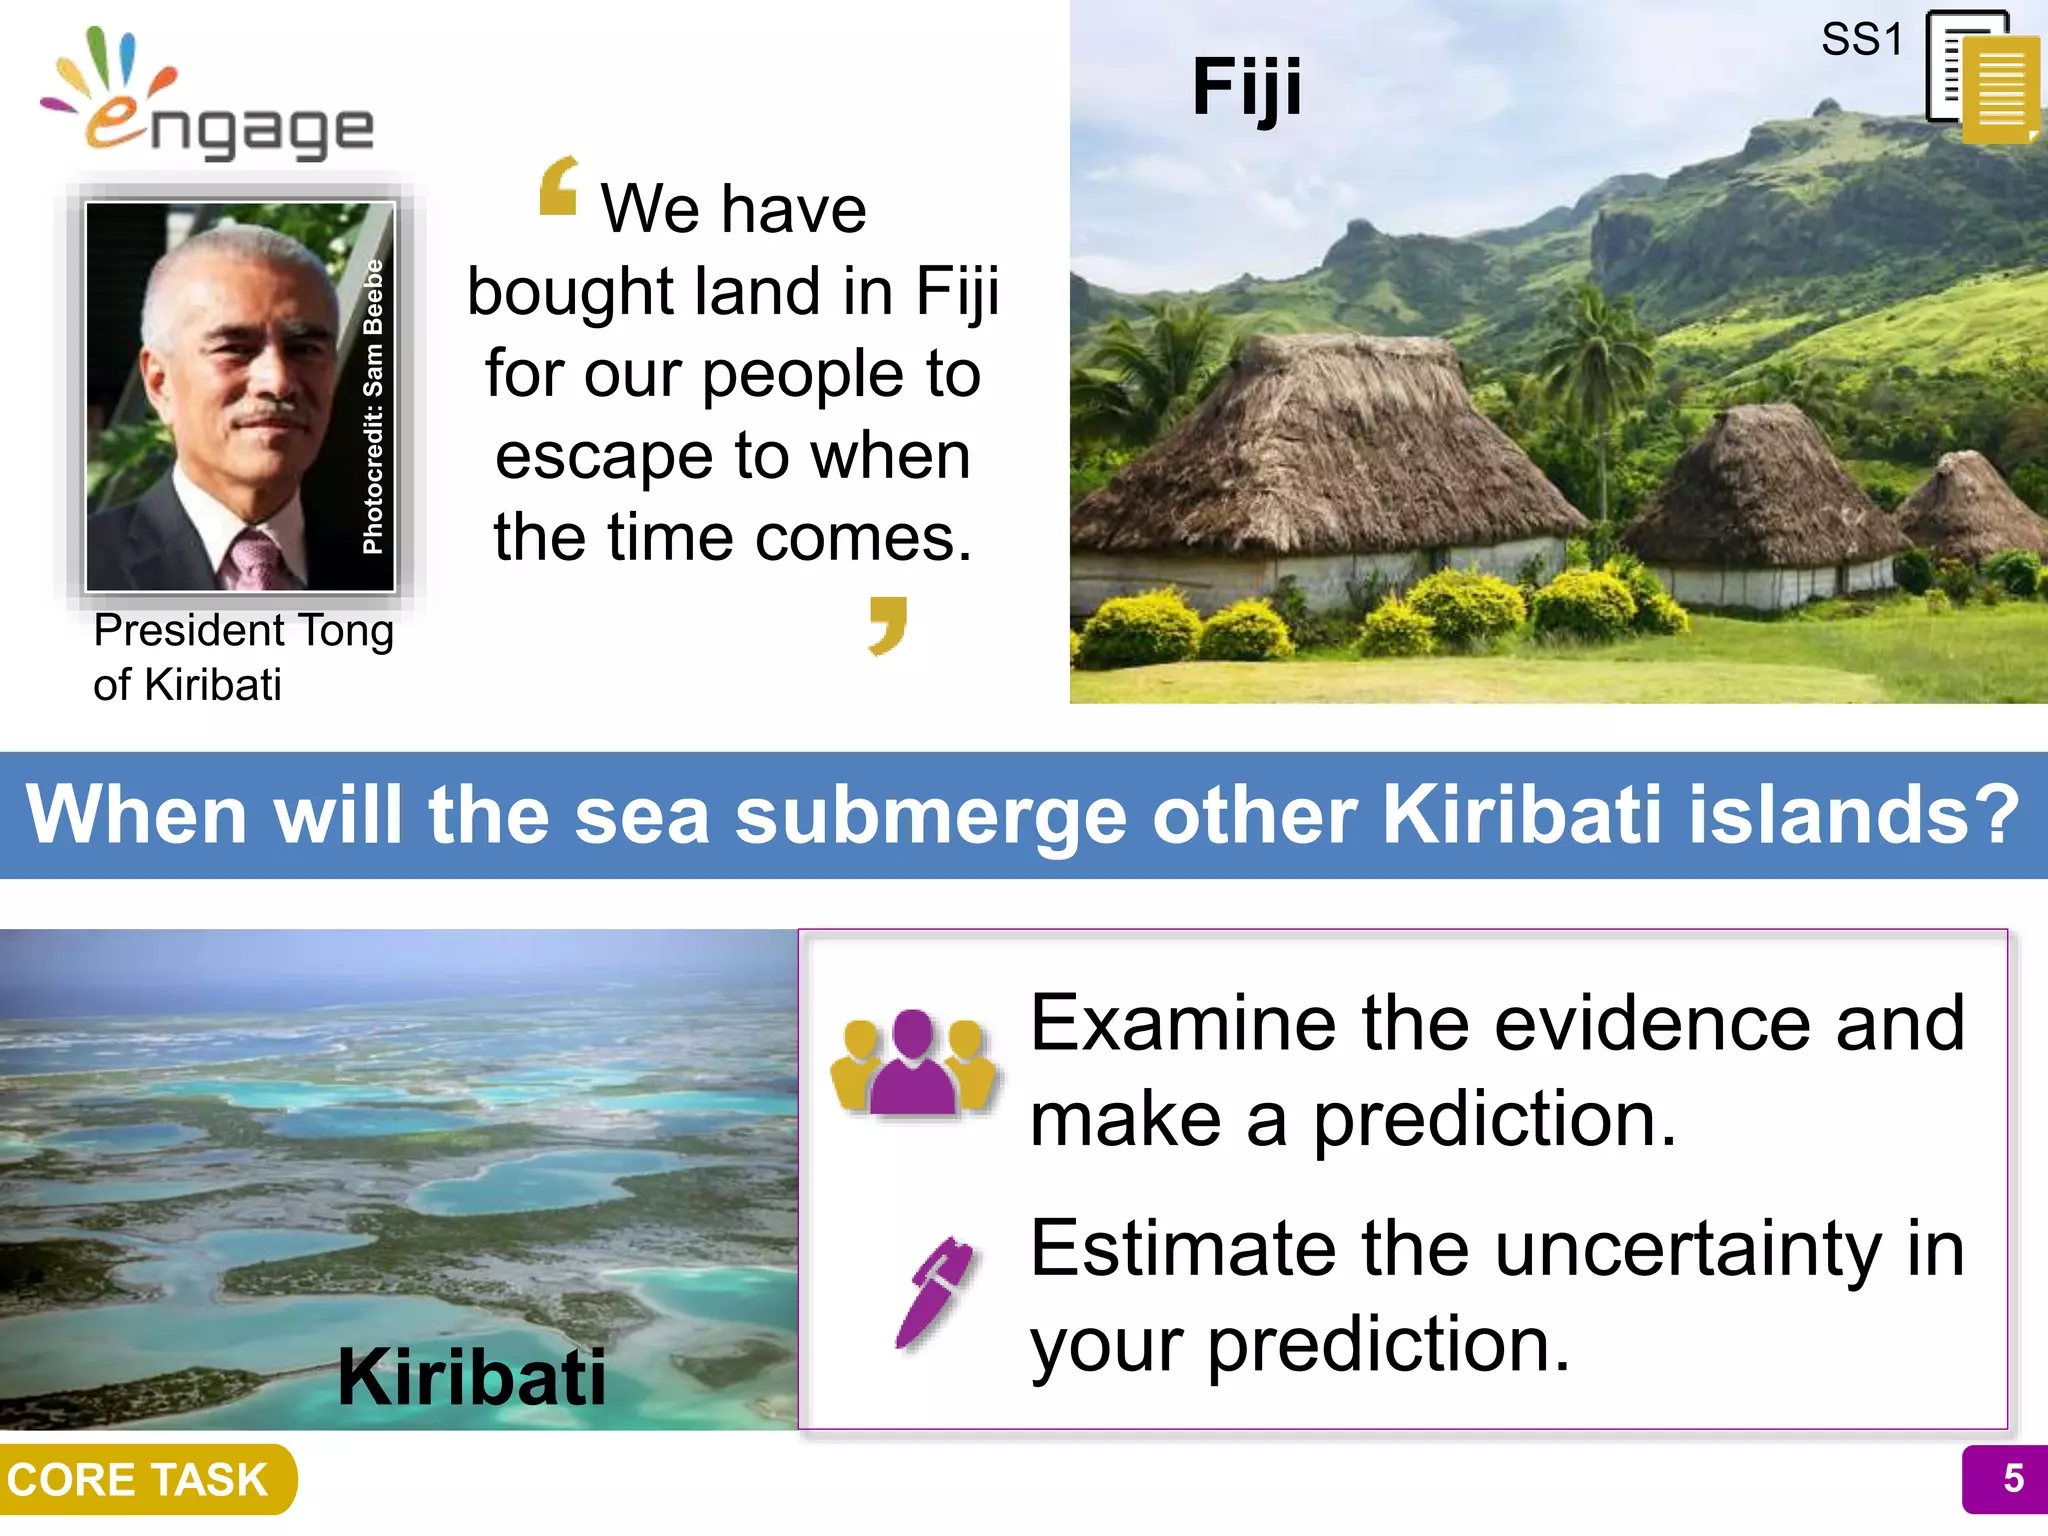


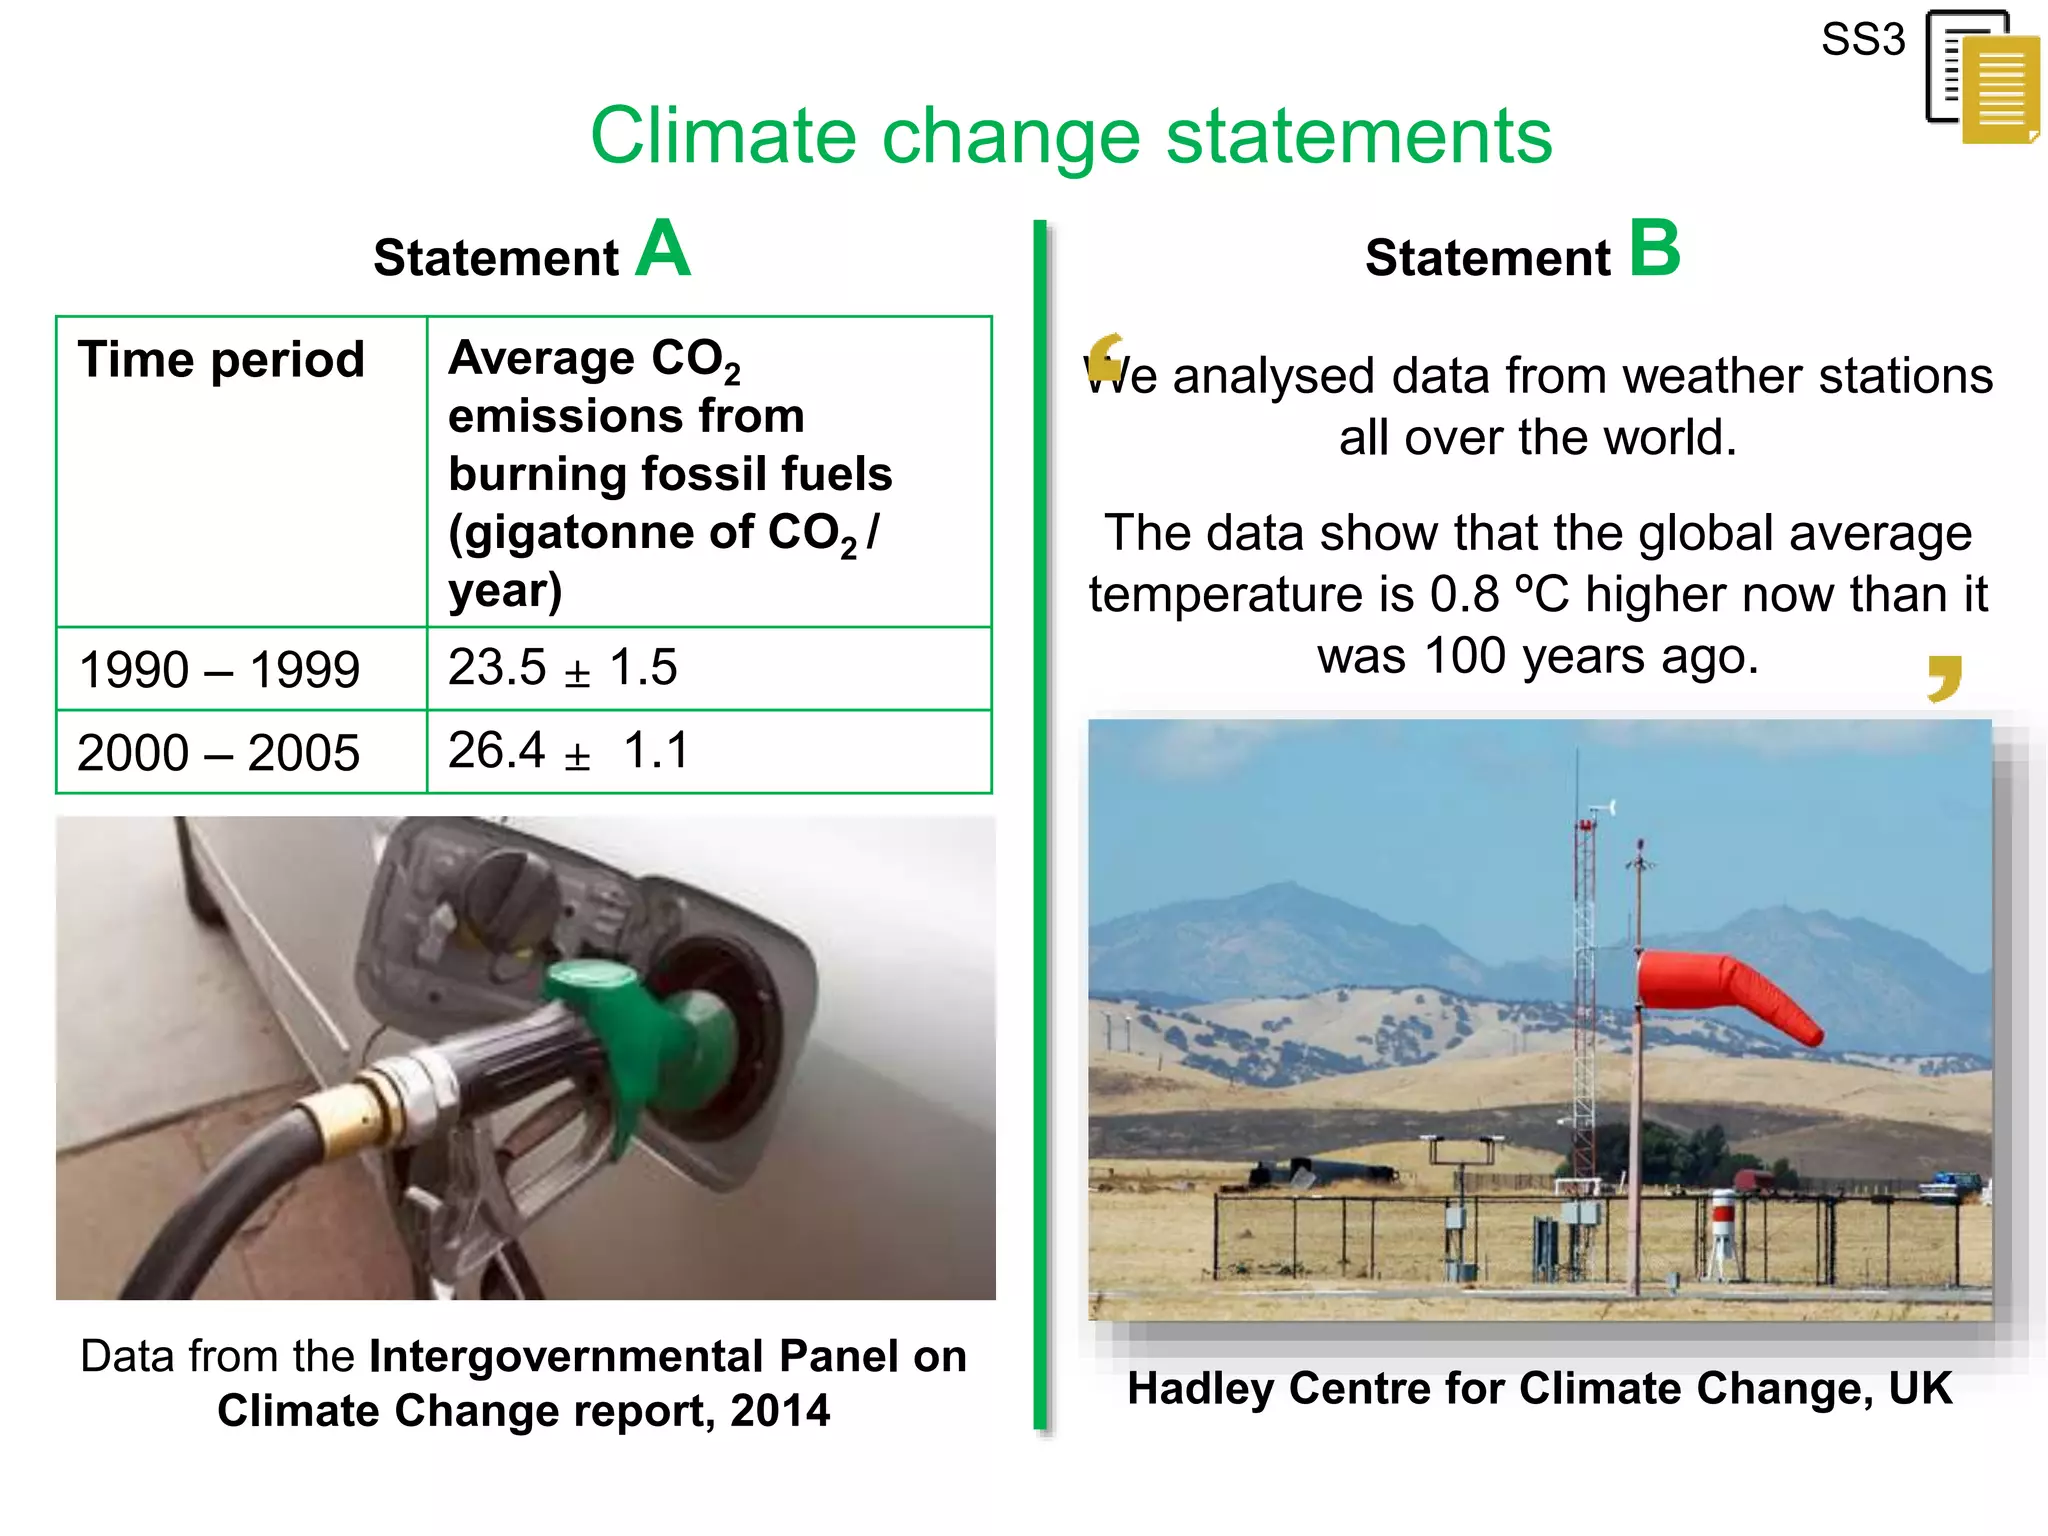


The document discusses the impact of rising sea levels due to climate change, particularly focusing on the island nation of Kiribati, where residents fear their homes will be submerged. It includes educational activities that involve analyzing evidence, predicting future sea level rises, and discussing the role of humans in climate change. The document aims to engage students in scientific reasoning and critical thinking regarding environmental issues.


