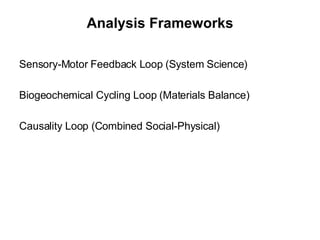
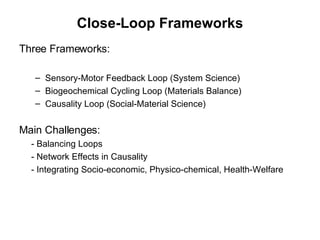
The document discusses three analysis frameworks for sustainability:
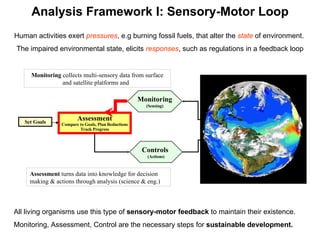
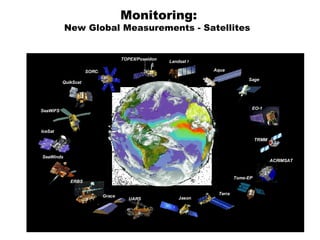
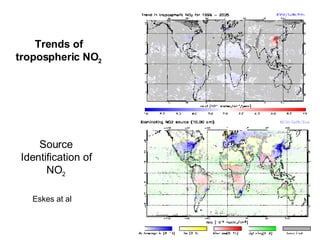
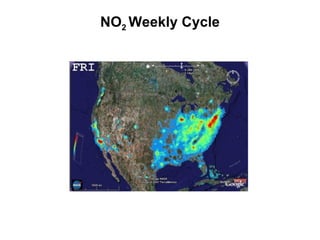
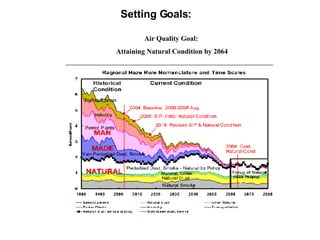
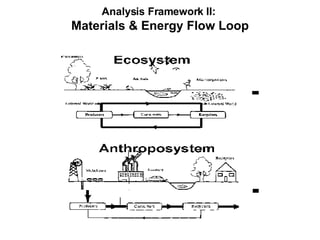
1. The sensory-motor feedback loop which involves monitoring environmental data, assessing it against goals, and implementing controls through actions and policy.
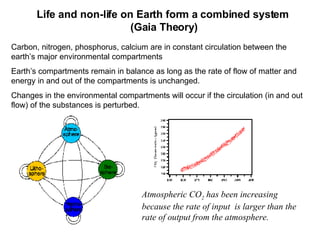
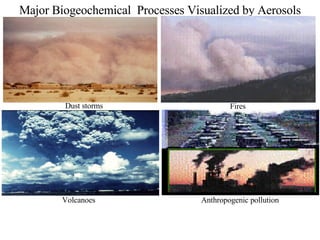
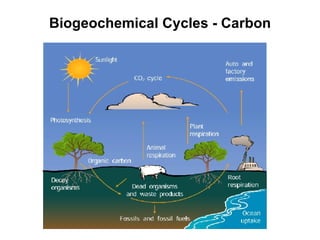
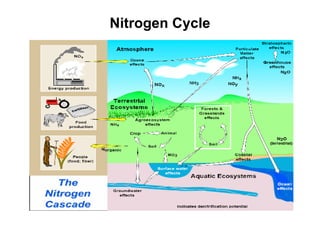
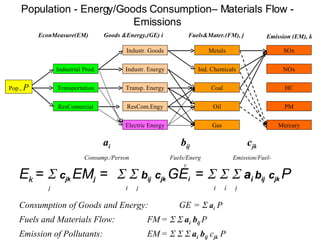
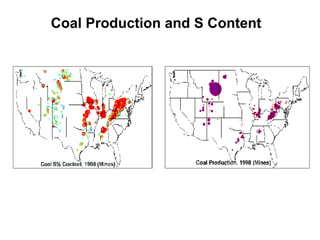
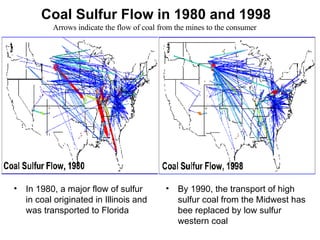
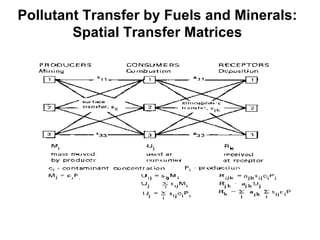
2. The biogeochemical cycling loop which looks at how elements like carbon and nitrogen circulate through ecosystems.
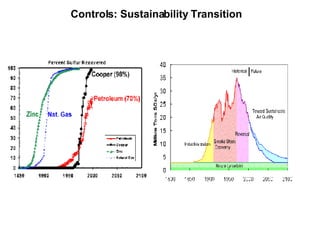
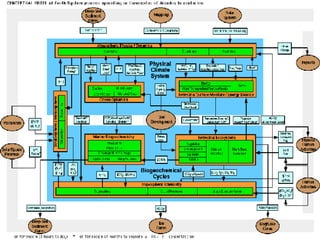
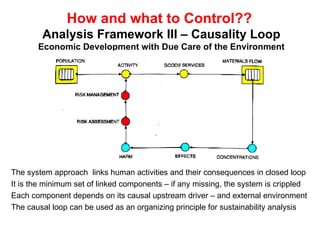
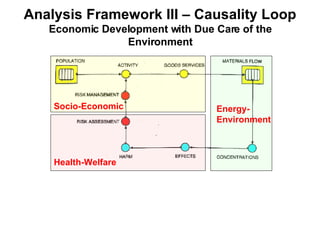
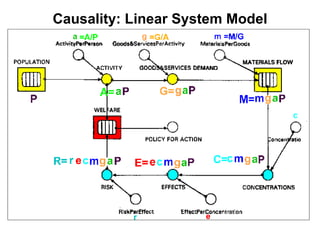
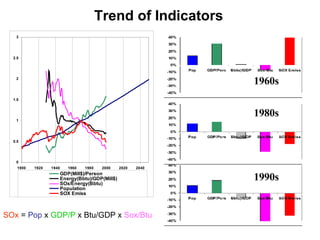
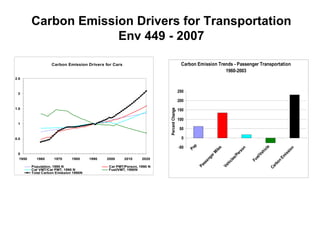
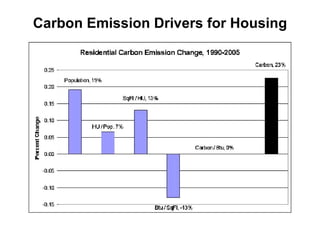
3. The causality loop which links human activities to their environmental and social consequences through indicators and trends over time. Integrating these perspectives is key to sustainable development analysis.