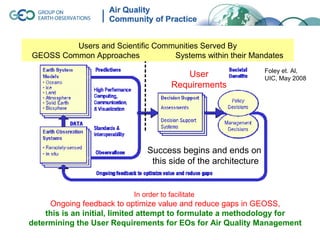
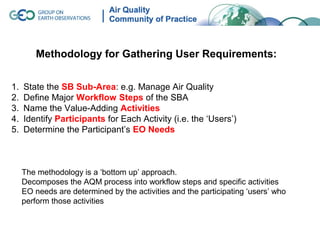
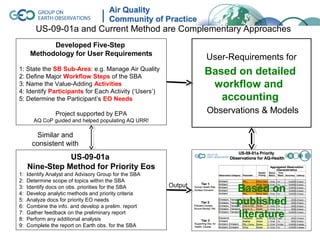
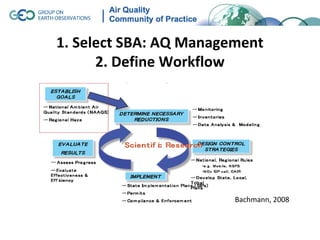
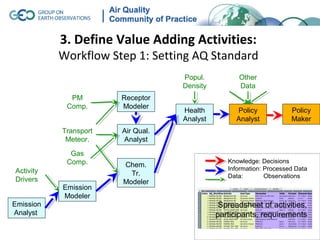
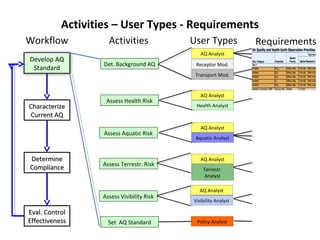
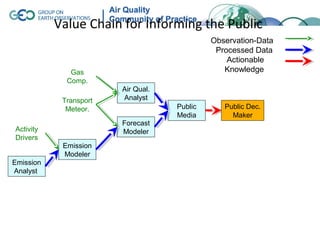
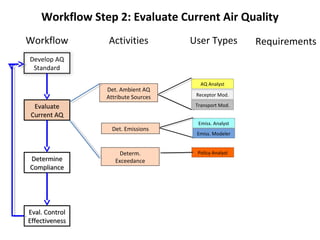
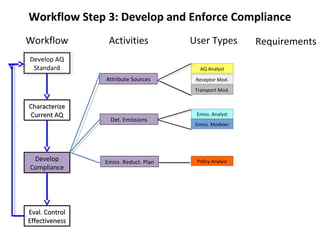
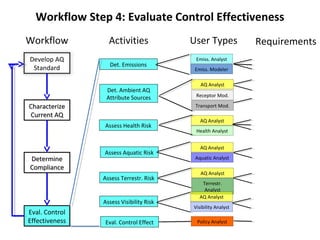
A Workflow-Accounting Methodology
                   to Determine
   Earth Observation Requirements for Air Quality


                                 A Contribution from the
                          GEO Air Quality Community of Practice
                                Members who shared their ideas and resources:
G. Foley, L. Friedl, K. Hoijarvi, S. Falke, J. Husar, R. Poirot, M. Schulz., K. Torsett, E. Robinson, A, Surijavong, W. White
                                              Contact: R. Husar, rhusar@wustl.edu

                                     Submitted to the Workshop:
         Building a User-Driven GEOSS: Methods to Capture, Analyze, and Prioritize User Needs
                                   Sydney, Australia, April 10, 2011
Earth Observations and Air Quality
•     Air Quality Management (AQM) and
      Science relies on EOs for
      emissions, transport and ambient
      concentration of air pollutants.

•     The required EOs are obtained
      mostly by the AQM Agencies
      themselves, using in-situ sensors
      and monitoring networks.


                                         However,
    •AQM-relevant EOs are only available for small regions of the world
    •There also need to include emerging remote sensing and AQ model data.
    •There is a need to integrate and reconcile the existing diverse observations
GEOSS Goal:
Facilitate access and integration of a broad range of EOs
               to SBAs, including Air Quality
Users and Scientific Communities Served By
GEOSS Common Approaches           Systems within their Mandates
                                                                Foley et. Al,
                                           User                 UIC, May 2008
                                        Requirements


                               Success begins and ends on
                                this side of the architecture


                           In order to facilitate
     Ongoing feedback to optimize value and reduce gaps in GEOSS,
    this is an initial, limited attempt to formulate a methodology for
determining the User Requirements for EOs for Air Quality Management
Methodology for Gathering User Requirements:


1.   State the SB Sub-Area: e.g. Manage Air Quality
2.   Define Major Workflow Steps of the SBA
3.   Name the Value-Adding Activities
4.   Identify Participants for Each Activity (i.e. the ‘Users’)
5.   Determine the Participant’s EO Needs


     The methodology is a ‘bottom up’ approach.
     Decomposes the AQM process into workflow steps and specific activities
     EO needs are determined by the activities and the participating ‘users’ who
     perform those activities
US-09-01a and Current Method are Complementary Approaches
            Developed Five-Step
      Methodology for User Requirements
                                                                User-Requirements for
1: State the SB Sub-Area: e.g. Manage Air Quality
2: Define Major Workflow Steps of the SBA
                                                                Based on detailed
3: Name the Value-Adding Activities                              workflow and
4: Identify Participants for Each Activity (‘Users’)
5: Determine the Participant’s EO Needs                            accounting
                Project supported by EPA                        Observations & Models
       AQ CoP guided and helped populating AQ URR!

        Similar and
       consistent with
                US-09-01a
     Nine-Step Method for Priority Eos
1:   Identify Analyst and Advisory Group for the SBA
2:   Determine scope of topics within the SBA
                                                       Output
3:
4:
     Identify docs on obs. priorities for the SBA
     Develop analytic methods and priority criteria
                                                                       Based on
5:
6:
     Analyze docs for priority EO needs
     Combine the info. and develop a prelim. report
                                                                       published
7:
8:
     Gather feedback on the preliminary report
     Perform any additional analysis
                                                                       literature
9:   Complete the report on Earth obs. for the SBA
1. Select SBA: AQ Management
      2. Define Workflow


                        Bachmann, 2008
3. Define Value Adding Activities:
           Workflow Step 1: Setting AQ Standard
                                   Popul.          Other
                                   Density         Data
             PM        Receptor
            Comp.      Modeler
                                   Health          Policy            Policy
                                   Analyst         Analyst           Maker
           Transport   Air Qual.
            Meteor.    Analyst
             Gas
            Comp.                               Knowledge: Decisions
                       Chem.
Activity                                        Information: Processed Data
                         Tr.                    Data:        Observations
Drivers                Modeler
           Emission
           Modeler
Emission                                      Spreadsheet of activities,
Analyst                                      participants, requirements
Activities – User Types - Requirements
Workflow             Activities             User Types           Requirements
                                               AQ Analyst
Develop AQ
                   Det. Background AQ        Receptor Mod.
 Standard
                                             Transport Mod.


                                               AQ Analyst
                    Assess Health Risk
Characterize                                 Health Analyst
Current AQ
                                               AQ Analyst
                   Assess Aquatic Risk
                                             Aquatic Analyst


Determine                                      AQ Analyst
                   Assess Terrestr. Risk
Compliance                                      Terrestr.
                                                 Analyst

                                              AQ Analyst
                   Assess Visibility Risk
                                            Visibility Analyst

Eval. Control
Effectiveness        Set AQ Standard         Policy Analyst
The Method is compatible with the
        GEO User Requirements Registry (URR)


The URR is a facility for collection, sharing and describing:
• User types among the nine SBAs;
• Applications that use Earth observations;
• Requirements for Earth observations and derived products;
• Links among user types, applications, and requirements.
Matching Offerings and Needs
            To be Tested in AIP 4
  AQ Community Catalog – Extracted from GCI


                                              Observation
                                              Parameters


                                              Matching
                                              Needs and
AQ Requirements – Extracted from GEO URR      Offerings


                                              User Needs
                                              Parameters
Strengths and Weaknesses of the Method
                                Strengths
•It is ‘observation-based’, using the actual activities, and EO uses
•Is methodical, so it can be broadly applied as a pattern
•The EO needs can be expressed in the same way as EO offerings


                               Weaknesses
•Method is tedious, requires detailed workflow, users, their EO needs
•Applicable to well-established AQM activities, not for ad-hoc uses
•Not tested for different environments and problem domains

               EO Prioritization not yet considered
•EO prioritization by this method is a multi-faceted, subtle activity
•Not yet addressed by the GEO AQ CoP
• Extra slides
Value Chain for Informing the Public
                                             Observation-Data
                                              Processed Data
                                                 Actionable
              Gas                               Knowledge
             Comp.
                        Air Qual.
            Transport   Analyst
             Meteor.                Public      Public Dec.
                                    Media         Maker
                        Forecast
Activity                Modeler
Drivers
            Emission
            Modeler
Emission
Analyst
Workflow Step 2: Evaluate Current Air Quality
Workflow        Activities          User Types         Requirements
Develop AQ
 Standard

                                       AQ Analyst
                Det. Ambient AQ
                Attribute Sources    Receptor Mod.

 Evaluate                            Transport Mod.
Current AQ
                                      Emiss. Analyst
                  Det. Emissions
                                     Emiss. Modeler


                     Determ.         Policy Analyst
Determine          Exceedance
Compliance


Eval. Control
Effectiveness
Workflow Step 3: Develop and Enforce Compliance
Workflow         Activities           User Types        Requirements
Develop AQ
 Standard                                AQ Analyst
                Attribute Sources      Receptor Mod.
                                       Transport Mod.


Characterize
Current AQ                             Emiss. Analyst
                  Det. Emissions
                                       Emiss. Modeler


 Develop        Emiss. Reduct. Plan    Policy Analyst
Compliance


Eval. Control
Effectiveness
Workflow Step 4: Evaluate Control Effectiveness
Workflow          Activities             User Types           Requirements
Develop AQ                                Emiss. Analyst
                  Det. Emissions
 Standard                                 Emiss. Modeler

                                            AQ Analyst
                 Det. Ambient AQ
                 Attribute Sources        Receptor Mod.

Characterize                              Transport Mod.
Current AQ
                                            AQ Analyst
                Assess Health Risk
                                          Health Analyst


                                            AQ Analyst
                Assess Aquatic Risk
Determine                                 Aquatic Analyst
Compliance
                                            AQ Analyst
                Assess Terrestr. Risk
                                             Terrestr.
                                              Analyst
                                            AQ Analyst
                Assess Visibility Risk
                                         Visibility Analyst
Eval. Control
Effectiveness    Eval. Control Effect     Policy Analyst
AQ Management: Science View


Processes and Earth Observations for AQ:
Emissions, Transport and ambient Concentrations/Depositions

User Types: Emission Analysts, Emission Modeler, AQ Data Analyst, AQ
   Transport Modeler, AQ Receptor Modeler, Health Analyst, Aquatic
   Analyst, Terrestrial Analyst, Visibility Analyst
AQ Management: Science View
Emissions, Transport and ambient Concentrations/Depositions causing Effects on Health and Welfare


               Emission Analysts        Transport Modeler        Health Analyst
               Emission Modeler         Receptor Modeler         Aquatic Analyst
                                        AQ Data Analyst          Terrestrial Analyst
                                                                 Visibility Analyst
AQ Management: Information Flow View


                                             GEOSS Information
                                              Flow Framework


GEOSS     AQ Analyst     AQ Domain         Policy          Policy
 Core      Modeler        Analyst         Analyst          Maker


 The AQ Information system processes Earth and other observations
 into actionable knowledge for policy/decision makers.

 User Types: AQ data analysts and modelers; health, aquatic and
 other domain analysts, policy analysts and policy/decision makers

110410 aq user_req_methodology_sydney_subm

  • 1.
    A Workflow-Accounting Methodology to Determine Earth Observation Requirements for Air Quality A Contribution from the GEO Air Quality Community of Practice Members who shared their ideas and resources: G. Foley, L. Friedl, K. Hoijarvi, S. Falke, J. Husar, R. Poirot, M. Schulz., K. Torsett, E. Robinson, A, Surijavong, W. White Contact: R. Husar, rhusar@wustl.edu Submitted to the Workshop: Building a User-Driven GEOSS: Methods to Capture, Analyze, and Prioritize User Needs Sydney, Australia, April 10, 2011
  • 2.
    Earth Observations andAir Quality • Air Quality Management (AQM) and Science relies on EOs for emissions, transport and ambient concentration of air pollutants. • The required EOs are obtained mostly by the AQM Agencies themselves, using in-situ sensors and monitoring networks. However, •AQM-relevant EOs are only available for small regions of the world •There also need to include emerging remote sensing and AQ model data. •There is a need to integrate and reconcile the existing diverse observations
  • 3.
    GEOSS Goal: Facilitate accessand integration of a broad range of EOs to SBAs, including Air Quality
  • 4.
    Users and ScientificCommunities Served By GEOSS Common Approaches Systems within their Mandates Foley et. Al, User UIC, May 2008 Requirements Success begins and ends on this side of the architecture In order to facilitate Ongoing feedback to optimize value and reduce gaps in GEOSS, this is an initial, limited attempt to formulate a methodology for determining the User Requirements for EOs for Air Quality Management
  • 5.
    Methodology for GatheringUser Requirements: 1. State the SB Sub-Area: e.g. Manage Air Quality 2. Define Major Workflow Steps of the SBA 3. Name the Value-Adding Activities 4. Identify Participants for Each Activity (i.e. the ‘Users’) 5. Determine the Participant’s EO Needs The methodology is a ‘bottom up’ approach. Decomposes the AQM process into workflow steps and specific activities EO needs are determined by the activities and the participating ‘users’ who perform those activities
  • 6.
    US-09-01a and CurrentMethod are Complementary Approaches Developed Five-Step Methodology for User Requirements User-Requirements for 1: State the SB Sub-Area: e.g. Manage Air Quality 2: Define Major Workflow Steps of the SBA Based on detailed 3: Name the Value-Adding Activities workflow and 4: Identify Participants for Each Activity (‘Users’) 5: Determine the Participant’s EO Needs accounting Project supported by EPA Observations & Models AQ CoP guided and helped populating AQ URR! Similar and consistent with US-09-01a Nine-Step Method for Priority Eos 1: Identify Analyst and Advisory Group for the SBA 2: Determine scope of topics within the SBA Output 3: 4: Identify docs on obs. priorities for the SBA Develop analytic methods and priority criteria Based on 5: 6: Analyze docs for priority EO needs Combine the info. and develop a prelim. report published 7: 8: Gather feedback on the preliminary report Perform any additional analysis literature 9: Complete the report on Earth obs. for the SBA
  • 7.
    1. Select SBA:AQ Management 2. Define Workflow Bachmann, 2008
  • 8.
    3. Define ValueAdding Activities: Workflow Step 1: Setting AQ Standard Popul. Other Density Data PM Receptor Comp. Modeler Health Policy Policy Analyst Analyst Maker Transport Air Qual. Meteor. Analyst Gas Comp. Knowledge: Decisions Chem. Activity Information: Processed Data Tr. Data: Observations Drivers Modeler Emission Modeler Emission Spreadsheet of activities, Analyst participants, requirements
  • 9.
    Activities – UserTypes - Requirements Workflow Activities User Types Requirements AQ Analyst Develop AQ Det. Background AQ Receptor Mod. Standard Transport Mod. AQ Analyst Assess Health Risk Characterize Health Analyst Current AQ AQ Analyst Assess Aquatic Risk Aquatic Analyst Determine AQ Analyst Assess Terrestr. Risk Compliance Terrestr. Analyst AQ Analyst Assess Visibility Risk Visibility Analyst Eval. Control Effectiveness Set AQ Standard Policy Analyst
  • 10.
    The Method iscompatible with the GEO User Requirements Registry (URR) The URR is a facility for collection, sharing and describing: • User types among the nine SBAs; • Applications that use Earth observations; • Requirements for Earth observations and derived products; • Links among user types, applications, and requirements.
  • 11.
    Matching Offerings andNeeds To be Tested in AIP 4 AQ Community Catalog – Extracted from GCI Observation Parameters Matching Needs and AQ Requirements – Extracted from GEO URR Offerings User Needs Parameters
  • 12.
    Strengths and Weaknessesof the Method Strengths •It is ‘observation-based’, using the actual activities, and EO uses •Is methodical, so it can be broadly applied as a pattern •The EO needs can be expressed in the same way as EO offerings Weaknesses •Method is tedious, requires detailed workflow, users, their EO needs •Applicable to well-established AQM activities, not for ad-hoc uses •Not tested for different environments and problem domains EO Prioritization not yet considered •EO prioritization by this method is a multi-faceted, subtle activity •Not yet addressed by the GEO AQ CoP
  • 13.
  • 14.
    Value Chain forInforming the Public Observation-Data Processed Data Actionable Gas Knowledge Comp. Air Qual. Transport Analyst Meteor. Public Public Dec. Media Maker Forecast Activity Modeler Drivers Emission Modeler Emission Analyst
  • 15.
    Workflow Step 2:Evaluate Current Air Quality Workflow Activities User Types Requirements Develop AQ Standard AQ Analyst Det. Ambient AQ Attribute Sources Receptor Mod. Evaluate Transport Mod. Current AQ Emiss. Analyst Det. Emissions Emiss. Modeler Determ. Policy Analyst Determine Exceedance Compliance Eval. Control Effectiveness
  • 16.
    Workflow Step 3:Develop and Enforce Compliance Workflow Activities User Types Requirements Develop AQ Standard AQ Analyst Attribute Sources Receptor Mod. Transport Mod. Characterize Current AQ Emiss. Analyst Det. Emissions Emiss. Modeler Develop Emiss. Reduct. Plan Policy Analyst Compliance Eval. Control Effectiveness
  • 17.
    Workflow Step 4:Evaluate Control Effectiveness Workflow Activities User Types Requirements Develop AQ Emiss. Analyst Det. Emissions Standard Emiss. Modeler AQ Analyst Det. Ambient AQ Attribute Sources Receptor Mod. Characterize Transport Mod. Current AQ AQ Analyst Assess Health Risk Health Analyst AQ Analyst Assess Aquatic Risk Determine Aquatic Analyst Compliance AQ Analyst Assess Terrestr. Risk Terrestr. Analyst AQ Analyst Assess Visibility Risk Visibility Analyst Eval. Control Effectiveness Eval. Control Effect Policy Analyst
  • 18.
    AQ Management: ScienceView Processes and Earth Observations for AQ: Emissions, Transport and ambient Concentrations/Depositions User Types: Emission Analysts, Emission Modeler, AQ Data Analyst, AQ Transport Modeler, AQ Receptor Modeler, Health Analyst, Aquatic Analyst, Terrestrial Analyst, Visibility Analyst
  • 19.
    AQ Management: ScienceView Emissions, Transport and ambient Concentrations/Depositions causing Effects on Health and Welfare Emission Analysts Transport Modeler Health Analyst Emission Modeler Receptor Modeler Aquatic Analyst AQ Data Analyst Terrestrial Analyst Visibility Analyst
  • 20.
    AQ Management: InformationFlow View GEOSS Information Flow Framework GEOSS AQ Analyst AQ Domain Policy Policy Core Modeler Analyst Analyst Maker The AQ Information system processes Earth and other observations into actionable knowledge for policy/decision makers. User Types: AQ data analysts and modelers; health, aquatic and other domain analysts, policy analysts and policy/decision makers

Editor's Notes

  • #2 This is a report addressing the Earth Observation needs for air quality. This phase involved primarily the domain experts who are either part of or familiar with the air quality management process including the activities, participants and their respective Earth Observation needs. Identifying and describing the requirements for air quality observations and then finding and harmonizing those observations is a key activity of the AQ CoP. This phase was performed using the voluntary participatory approach of the AQ CoP.
  • #3 The procedures and the outcome of AQM are defined by laws and regulations in most countries including the workflow/activities, the key participants and their respective needs. AQ Management (AQM) and Science relies on a range of Earth Observations (EO) from in-situ and remote sensing platforms. Hence, AQM is a suitable application area of the Global Observing System of Systems (GEOSS) where the user needs are satisfied by services offered . This is an initial attempt to formulate User Requirements for AQM. The AQ Community of Practice is encouraged to continue its active participation in this effort.
  • #4 The vision is to have these data available through an interoperability framework that allows them to be used via various subsets and combinations to support specific research and decision applications There are numerous Earth Observations that are available and in principle useful for air quality applications such as informing the public and enforcing AQ standards. However, connecting a user to the right observations or models is accompanied by an array of hurdles. The GEOSS Common Infrastructure allows the reuse of observations and models for multiple purposes
  • #6 Consultation within AQ CoP has resulted in the following systematic methodology for determining EO Requirements for air quality. The method seeks a comprehensive assessment of the needs that are determined based on the consideration of all the key activities. In the method the EO requirements are determined by the needs of the participants (users) in the respective activities. The methodology is consistent with observation of Dr. Gary Foley (EPA), that when gathering user requirements you don ’t ask managers what they need, but what they DO. Based on what they do (and who they are) you determine their requirements. The methodology is analogous to the systematic, 9-step process applied in GEO Task US-0901a developed and applied by Lawrence Friedl, NASA. Step 1: Selecting a societal benefit sub-area for which the user requirements are to be determined. Step 2: Examine the workflow for the selected sub-SBA and delineate the main steps in the overall workflow. Step 3: Identify the individual value-adding activities within each workflow step. Step 4: Associate each workflow step with the participants who perform those activities. Step 5: Determine the EO needs for each participant to perform the specified activities within the workflow. ----- Step 6: Determine the EOs that are available and accessible to the participants. Step 7: Compare the stated needs with the available/accessible EOs and communicate GAP. Step 8: Communicate new EOs that may be relevant to SBAs Step 9: Monitor the GAP (EOs available/accessible and Needs)
  • #8 The first stage of management is to establish air quality goals, i.e. setting the level of air quality to healthy level. In most cases the criteria is based on risk of human health, expressed as air quality standards. Setting air quality standards includes a broad range of participants, most notably air quality Data Analysts and air quality Health Effects Researchers. The second stage is the determination of compliance with the standard and the necessary emission reductions. This involves monitoring the air quality at suitable locations and evaluating whether the air quality is violating the standard set in stage one. For regions of non-compliance specific emission reductions are set. This stage of air quality management involves primarily air quality analysts, modelers and Policy Analysts. In the third stage emission reduction programs are developed to achieve acceptable air quality. This phase involves Policy Analysts and Policy Makers. The fourth stage focuses on the implementation and enforcing of control strategies. This stage is primarily in the domain of air quality Policy Makers. The last stage of Air Quality Management loop has the goal of tracking and evaluating the effectiveness of the control strategy. This phase again involves many user types such as air quality and emission Analysts, Modelers, Domain Experts on health and environmental effects as well as Policy Analysts.
  • #10 So, AQM workflow can be divided into four steps, starting with setting an AQ standard.
  • #19 From “ Critical Earth Observation Priorities ” GEO Task US-09-01a ; Air Quality and Health   Final Report to the GEO User Interface Committee , Feb 2010. The term “ Earth observation ” refers to parameters and variables (e.g., physical, geophysical, chemical, biological) sensed or measured, derived parameters and products, and related parameters from model outputs. In the context of AQH, Earth observation refers to measurements or models that help characterizing the air quality and health systems, specifically emissions, source-receptor relationship, and ambient concentrations . The AQ process can be described using a well-accepted, causality-based framework , shown in the simplified, systems diagram of AQ management (Figure 1). Air pollution is caused primarily by Human Activities (HA), and through a feedback-control loop, it is also mitigated by societal actions that reduce the levels of air pollution (Bachmann, 2007; Chow et al., 2007). Figure 1 defines the system components and the scope of EOs needed for the AQH sub-area. In the industrial world, the overwhelming majority of air pollution Emissions originate from the combustion of energy-producing fossil fuels, coal, oil, and natural gas. The magnitude of the emissions is determined by the Emission Factors (EF) associated with human activities. The emission rates, along with the SRR, atmospheric dispersion, chemical transformation, and removal processes, determines the Ambient Pollutant (AP) concentrations. The overall global-scale Health Damage (HD) is the consequence of the ambient pollutant burden end exposure. Its magnitude is determined by the Damage Function (DF) and population density. This generalized framework is applicable to all human-induced AQ problems, regardless of the sources of the human-induced emissions and the nature of the resulting AQ damage (NARSTO, 2004; Bachmann, 2007). Figure 1 indicates that major elements of the AQ system are quantifiable through EOs (i.e., measurements and suitably evaluated air quality models). In particular, the characterization of the ambient pollutant concentration and evaluating the SRR depends largely on EOs and the underlying atmospheric science (dark shading). The key “essential AQ variables”— ozone and PM 2.5 —are secondary pollutants (i.e., most of the ambient O 3 and PM 2.5 is formed within the atmosphere through chemical reactions of their precursors). A key role of the SRR is to incorporate these chemical transformations. The SRR is generally derived from AQ models that simulate the atmospheric processes. The models themselves are developed, calibrated, and verified using EOs. Advanced AQ models are now assimilating EOs to improve their forecast performance (IGACO, 2004; USWRP, 2006). EOs can improve emission estimates and forecasting. EO-based "top-down" emission measurements are gaining increasing applicability (Dabberdt and McHenry, 2004; NARSTO, 2005). The above systems approach yielded progress on improving air quality in many parts of the world, particularly over North America and Western Europe (NAWE). The emission reductions were motivated by scientific evidence of adverse impacts, and the progress was  achieved through the implementation of science-based policies and through advances in technology (Brook et al., 2009). The estimation of health impacts based on research conducted in NAWE is only partially applicable to developing countries. While many similarities exist regarding the constituents of air pollution around the globe, the nature of air pollution in developing regions is significantly different from those in NAWE. The human activities, emissions, and ambient concentrations are all specific to particular regions.  Major cities in Asia and Africa have many diffuse, difficult-to-control sources (e.g., open burning, low-quality indoor fuels, uncontrolled small businesses and industries) (HEI, 2004; Molina and Molina, 2004). The transportation-related emissions and ambient concentrations near roadways are also region-specific. In many areas of the world, a significant fraction of the ambient pollutants originates from agricultural or domestic biomass burning, forest or savannah fires, or dust storms.  Additional Earth observation needs are given in companion GEO US0901-a Health reports on Aeroallergen Infectious Diseases. Unfortunately, the variability of AQ in the developing world is very poorly characterized. The uncertainties span all of the components of the observable AQ system: emissions, SRR, ambient concentrations, and exposure damage. Consequently, health impact estimation for the developing regions is highly uncertain (HEI, 2004; Vliet and Kinney, 2007; Cohen et. al., 2004).
  • #20 From “ Critical Earth Observation Priorities ” GEO Task US-09-01a ; Air Quality and Health   Final Report to the GEO User Interface Committee , Feb 2010. The term “ Earth observation ” refers to parameters and variables (e.g., physical, geophysical, chemical, biological) sensed or measured, derived parameters and products, and related parameters from model outputs. In the context of AQH, Earth observation refers to measurements or models that help characterizing the air quality and health systems, specifically emissions, source-receptor relationship, and ambient concentrations . The AQ process can be described using a well-accepted, causality-based framework , shown in the simplified, systems diagram of AQ management (Figure 1). Air pollution is caused primarily by Human Activities (HA), and through a feedback-control loop, it is also mitigated by societal actions that reduce the levels of air pollution (Bachmann, 2007; Chow et al., 2007). Figure 1 defines the system components and the scope of EOs needed for the AQH sub-area. In the industrial world, the overwhelming majority of air pollution Emissions originate from the combustion of energy-producing fossil fuels, coal, oil, and natural gas. The magnitude of the emissions is determined by the Emission Factors (EF) associated with human activities. The emission rates, along with the SRR, atmospheric dispersion, chemical transformation, and removal processes, determines the Ambient Pollutant (AP) concentrations. The overall global-scale Health Damage (HD) is the consequence of the ambient pollutant burden end exposure. Its magnitude is determined by the Damage Function (DF) and population density. This generalized framework is applicable to all human-induced AQ problems, regardless of the sources of the human-induced emissions and the nature of the resulting AQ damage (NARSTO, 2004; Bachmann, 2007). Figure 1 indicates that major elements of the AQ system are quantifiable through EOs (i.e., measurements and suitably evaluated air quality models). In particular, the characterization of the ambient pollutant concentration and evaluating the SRR depends largely on EOs and the underlying atmospheric science (dark shading). The key “essential AQ variables”— ozone and PM 2.5 —are secondary pollutants (i.e., most of the ambient O 3 and PM 2.5 is formed within the atmosphere through chemical reactions of their precursors). A key role of the SRR is to incorporate these chemical transformations. The SRR is generally derived from AQ models that simulate the atmospheric processes. The models themselves are developed, calibrated, and verified using EOs. Advanced AQ models are now assimilating EOs to improve their forecast performance (IGACO, 2004; USWRP, 2006). EOs can improve emission estimates and forecasting. EO-based "top-down" emission measurements are gaining increasing applicability (Dabberdt and McHenry, 2004; NARSTO, 2005). The above systems approach yielded progress on improving air quality in many parts of the world, particularly over North America and Western Europe (NAWE). The emission reductions were motivated by scientific evidence of adverse impacts, and the progress was  achieved through the implementation of science-based policies and through advances in technology (Brook et al., 2009). The estimation of health impacts based on research conducted in NAWE is only partially applicable to developing countries. While many similarities exist regarding the constituents of air pollution around the globe, the nature of air pollution in developing regions is significantly different from those in NAWE. The human activities, emissions, and ambient concentrations are all specific to particular regions.  Major cities in Asia and Africa have many diffuse, difficult-to-control sources (e.g., open burning, low-quality indoor fuels, uncontrolled small businesses and industries) (HEI, 2004; Molina and Molina, 2004). The transportation-related emissions and ambient concentrations near roadways are also region-specific. In many areas of the world, a significant fraction of the ambient pollutants originates from agricultural or domestic biomass burning, forest or savannah fires, or dust storms.  Additional Earth observation needs are given in companion GEO US0901-a Health reports on Aeroallergen Infectious Diseases. Unfortunately, the variability of AQ in the developing world is very poorly characterized. The uncertainties span all of the components of the observable AQ system: emissions, SRR, ambient concentrations, and exposure damage. Consequently, health impact estimation for the developing regions is highly uncertain (HEI, 2004; Vliet and Kinney, 2007; Cohen et. al., 2004).
  • #21 A typical air quality decision support system consists of several active participants: The models and the observations are interpreted by experienced Technical Analysts who summarize their findings in 'just in time ’ reports. Often these reports are also evaluated and augmented by Regulatory Analysts who then inform the decision-making m anagers. With actionable knowledge in hand, decision makers act in response to the pollution situation. While the arrows indicate unidirectional flow of information, each interaction generally involves considerable iteration. For example, analysts explore and choose from numerous candidate datasets. Also most reports are finalized after considerable feedback. Note that the key users of formal information systems are the technical analysts. Hence, the system needs to be tailored primarily to the analysts needs.