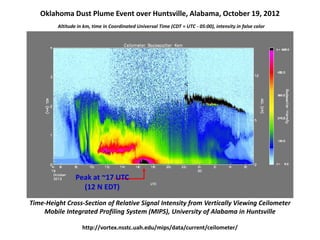
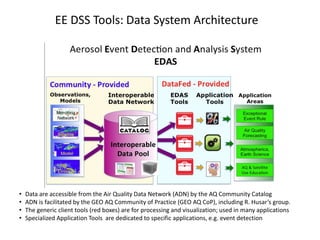
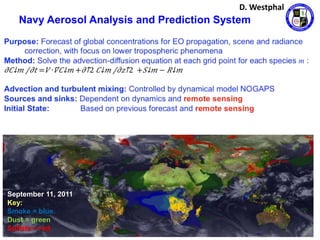
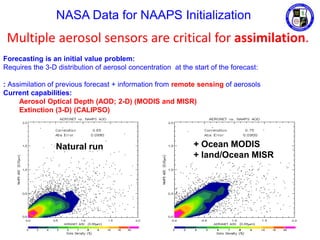
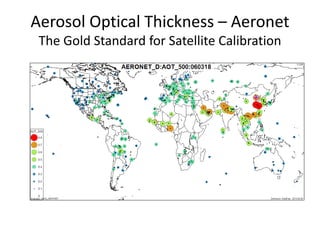
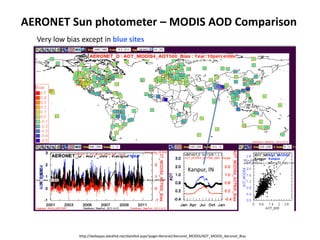
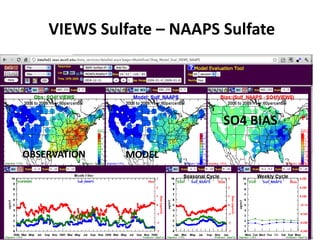
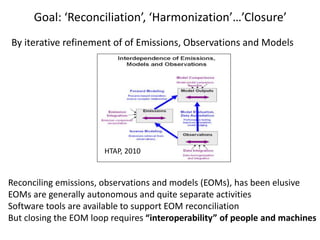
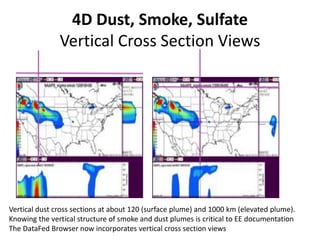
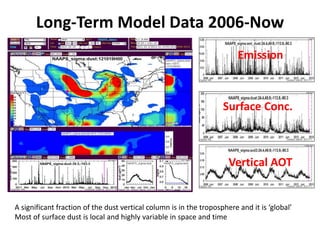
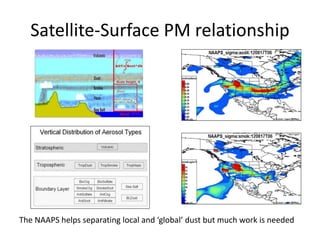
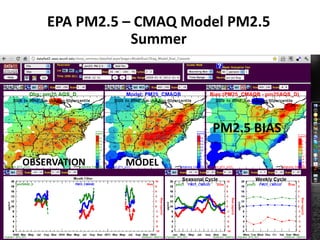
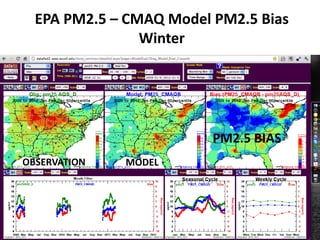
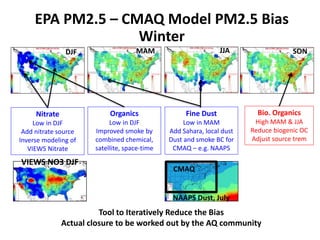
SlideShare a Scribd company logo
1 of 41
Rudolf B. Husar
Washington University, St. Louis
Seminar Presented at
Environmental Protection Agency, Research Triangle Park
February 5, 2013
Exceptional Event Analysis for 2012
Smoke and Dust Events
Exceptional Events: Past, Present, Future
Data, Models, Tools: Decision Support Systems
NRL NAAPS Model: Advancement in Science
Mexican Smoke over the E. U, May 1998
Record Smoke Impact on PM Concentrations
Smoke Event
Asian Dust Cloud over N. America
On April 27, the dust cloud arrived in
North America.
Regional average PM10
concentrations increased to 65 mg/m3
In Washington State, PM10
concentrations exceeded 100 mg/m3
Asian Dust 100 mg/m3
Hourly PM10
Continental/Hemispheric Dust Events over the US
Gobi dust in spring
Sahara in summer
Regional-scale fine dust
events are mainly
from
intercontinental transport
Fine Dust Events, 1992-2003 - VIEWS
ug/m3
EE Rule Features – RH Perspective
• Not rigid, weight of evidence approach
• Not based on single FRM measurement
• Encourages use of diverse data and models
• Satellites, real-time, model etc.
• There is a role of science in AQ Management
• EE events demand science, particularly the ‘but for’ clause
Near-Real-Time Data for May 11, 07 GA Smoke
Displayed on DataFed Analysts Console
Pane 1,2: MODIS visible satellite images – smoke pattern
Pane 3,4: AirNOW PM2.5, Surf. Visibility – PM surface conc.
Pane 5,6: AirNOW Ozone, Surf. Wind – Ozone, transport pattern
Pane 7,8: OMI satellite Total, Tropospheric NO2 – NO2 column conc.
Pane 9,10: OMI satellite Aerosol Index, Fire P-xels – Smoke, Fire
Pane 11,12: GOCART, NAAPS Models of smoke – Smoke forecast
1
10
2 4
5 8
7
6
3
9 12
11
Console Links
May 07, 2007,
May 08, 2007
May 09, 2007
May 10, 2007
May 11, 2007
May 12, 2007
May 13, 2007
May 14, 2007
May 15, 2007
‘But for’ demonstration: May 2007 Georgia Smoke
Red backtrajectories pass through
source area
NO2 form Fires Evidence: OMI
Sweat Water fire in S.
Georgia (May 2007)
NO2 form Fires Evidence: OMI
Sweat Water fire in S.
Georgia (May 2007)
2007: Exceptional Event Rule in
Federal Register
EPA-Approved EE Flags, 2006-2011
EE flags were added to FRM PM2.5 and ozone data in AQS
Foreign Sources
Pattern of EE flagged PM2.5 data, 2006-2012
Domestic Sources
Trend of PM2.5 Concentration
A reason for the 2006-2010 EE flag decline is the
overall reduction in PM2.5 concentrations.
2000-2003 avg. 2009-2012 avg.
As a result of PM2.5 decline, the number of
>35ug/m3 samples has also declined dramatically.
No NAAQS exceedances-no EE flag.
>35 ug/m3 station count
Regional Haze Rule: Natural Aerosol
The goal is to attain natural conditions by 2064;
Baseline during 2000-2004, first Natural Cond. SIP in 2008;
SIP & Natural Condition Revisions every 10 yrs
PM2.5 EE Flag Decline
Expected Increase in 2012
Trend of EE flags for PM2.5between 2006 and 2012
based on the official EPA AQS database. The EE
flags declined tenfold between 2007-8 and 2010-11
However, in 2012 the average AOT from smoke
was higher than any year between 2006 and 2012,
probably due the severe drought. The EE flags for
2012 are expected to rise again in 2012.
Drought
Anomaly,
2012
Smoke Super-Events in 2012:
August 1- August
20 20
June 20- July 10
Average Smoke
Emission Rate
Average Smoke
Optical Depth
Average Smoke Surface
Concentration
O3 ‘Violation’ Trends
Number of CONUS Stations with O3>75 ppb
2010-2013
1993-2013
Apr-Oct 2012
Exceptional Event
Decision Support System (EE DSS)
EE_CATT Screencast
NASA Grant: 2009-2012
NASA and NAAPS Products for Air Quality Decision Making,
D. Westphal, PI, R. Husar, CoI
Washington University, McDonald Academy for Global Energy
and Environmental Partnership (MAGEEP)
Ozone Exceedances Apr-Sep 2011
October 2012 MT-KS Dust Event
121015_Montana_Dust Event
October 2012 Dust Event: Passage of the dust plume
Oklahoma Dust Plume Event over Huntsville, Alabama
October 19, 2012
NSSTC Rooftop Camera, Looking East, without and with Dust
Kevin Knupp, Michael Newchurch, Udaysankar Nair, Dustin Phillips, David Bowdle, Shih Kuang, Wesley Cantrel,
University of Alabama in Huntsville
Kathy Jones
Chattanooga-Hamilton County Air Pollution Control Bureau
Claire Aiello
WHNT TV, Huntsville, Alabama
Atmospheric Science Brown Bag Mini-Seminar, October 23, 2012
Fort Payne (Kim Pendergrass)
Colbert Heights Mountain
Looking East, (Carter Watkins)
Lake Guntersville
Monte Sano (Rebekah Bynum)
Donegal Drive, looking west
(Megan Hayes, WHNT)
WHNT TV photographs
Monte Sano
(Jacks Camera Network, WHNT)
Oklahoma Dust Plume Event over Huntsville, Alabama, October 19, 2012
October 2012 Dust Event
Oklahoma Dust Plume Event over Huntsville, Alabama, October 19, 2012
http://vortex.nsstc.uah.edu/mips/data/current/ceilometer/
Time-Height Cross-Section of Relative Signal Intensity from Vertically Viewing Ceilometer
Mobile Integrated Profiling System (MIPS), University of Alabama in Huntsville
Altitude in km, time in Coordinated Universal Time (CDT = UTC - 05:00), intensity in false color
Peak at ~17 UTC
(12 N EDT)
EE DSS Tools: Data System Architecture
• Data are accessible from the Air Quality Data Network (ADN) by the AQ Community Catalog
• ADN is facilitated by the GEO AQ Community of Practice (GEO AQ CoP), including R. Husar’s group.
• The generic client tools (red boxes) are for processing and visualization; used in many applications
• Specialized Application Tools are dedicated to specific applications, e.g. event detection
Application-Task-Centric Workspace
Example:
EventSpaces
Catalog - Find Dataset
Specific Exceptional Event
Harvest Resources
EE DSS Links
CATT – General
EE_CATT
121015_Montana_Dust Event
110414_Kansas_Smoke Event
Screencast
Anomaly Map
Navy Aerosol Analysis and Prediction System
NAAPS
by
D. Westphal et al, NRL
Why I luv NAAPS:
1. Assimilates satellite aerosol optical thickness and fire pixels
2. Provides 4D aerosol structure for dust, smoke, sulfate, sea salt
3. Open access to 10 years of global simulations (via DataFed)
Navy Aerosol Analysis and Prediction System
September 11, 2011
Key:
Smoke = blue
Dust = green
Sulfate = red
D. Westphal
NASA Data for NAAPS Initialization
Forecasting is an initial value problem:
Requires the 3-D distribution of aerosol concentration at the start of the forecast:
: Assimilation of previous forecast + information from remote sensing of aerosols
Current capabilities:
Aerosol Optical Depth (AOD; 2-D) (MODIS and MISR)
Extinction (3-D) (CALIPSO)
+ Land/Ocean MODIS
+ Land/Ocean MISR
Natural run + Ocean MODIS
+ land/Ocean MISR
Multiple aerosol sensors are critical for assimilation.
Aerosol Optical Thickness – Aeronet
The Gold Standard for Satellite Calibration
http://webapps.datafed.net/datafed.aspx?page=Aeronet/Aeronet_MODIS/AOT_MODIS_Aeronet_Bias
AERONET Sun photometer – MODIS AOD Comparison
Very low bias except in blue sites
Kanpur, IN
VIEWS Sulfate – NAAPS Sulfate
OBSERVATION MODEL
SO4 BIAS
Goal: ‘Reconciliation’, ‘Harmonization’…’Closure’
By iterative refinement of of Emissions, Observations and Models
HTAP, 2010
Reconciling emissions, observations and models (EOMs), has been elusive
EOMs are generally autonomous and quite separate activities
Software tools are available to support EOM reconciliation
But closing the EOM loop requires “interoperability” of people and machines
4D Dust, Smoke, Sulfate
Vertical Cross Section Views
Vertical dust cross sections at about 120 (surface plume) and 1000 km (elevated plume).
Knowing the vertical structure of smoke and dust plumes is critical to EE documentation
The DataFed Browser now incorporates vertical cross section views
Long-Term Model Data 2006-Now
A significant fraction of the dust vertical column is in the troposphere and it is ‘global’
Most of surface dust is local and highly variable in space and time
Emission
Vertical AOT
Surface Conc.
Satellite-Surface PM relationship
The NAAPS helps separating local and ‘global’ dust but much work is needed
OBSERVATION MODEL
PM2.5 BIAS
EPA PM2.5 – CMAQ Model PM2.5
Summer
EPA PM2.5 – CMAQ Model PM2.5 Bias
Winter
OBSERVATION MODEL
PM2.5 BIAS
Tool to Iteratively Reduce the Bias
Actual closure to be worked out by the AQ community
DJF JJA SON
MAM
Nitrate
Low in DJF
Add nitrate source
Inverse modeling of
VIEWS Nitrate
Organics
Low in DJF
Improved smoke by
combined chemical,
satellite, space-time
Fine Dust
Low in MAM
Add Sahara, local dust
Dust and smoke BC for
CMAQ – e.g. NAAPS
Bio. Organics
High MAM & JJA
Reduce biogenic OC
Adjust source trem
NAAPS Dust, July
VIEWS NO3 DJF
CMAQ
EPA PM2.5 – CMAQ Model PM2.5 Bias
Winter
Many Thanks:
• Kari Hoijarvi
• Erin Robinson
• Rich Poirot
• Doug Westphal
• Neil Frank

More Related Content

What's hot

2004-09-21 Natural Aerosol Event Detection and Characterization
2004-09-21 Natural Aerosol Event Detection and Characterization2004-09-21 Natural Aerosol Event Detection and Characterization
2004-09-21 Natural Aerosol Event Detection and CharacterizationRudolf Husar
 
2016Sum_LaRC_AppalachianTrailHealthAQ_Presentation_FD
2016Sum_LaRC_AppalachianTrailHealthAQ_Presentation_FD2016Sum_LaRC_AppalachianTrailHealthAQ_Presentation_FD
2016Sum_LaRC_AppalachianTrailHealthAQ_Presentation_FDAmy Wolfe
 
IUKWC Workshop Nov16: Developing Hydro-climatic Services for Water Security –...
IUKWC Workshop Nov16: Developing Hydro-climatic Services for Water Security –...IUKWC Workshop Nov16: Developing Hydro-climatic Services for Water Security –...
IUKWC Workshop Nov16: Developing Hydro-climatic Services for Water Security –...India UK Water Centre (IUKWC)
 
Air quality challenges and business opportunities in China: Fusion of environ...
Air quality challenges and business opportunities in China: Fusion of environ...Air quality challenges and business opportunities in China: Fusion of environ...
Air quality challenges and business opportunities in China: Fusion of environ...CLIC Innovation Ltd
 
2005-06-03 Aerosol Characterization and the Supporting Information Infrastruc...
2005-06-03 Aerosol Characterization and the Supporting Information Infrastruc...2005-06-03 Aerosol Characterization and the Supporting Information Infrastruc...
2005-06-03 Aerosol Characterization and the Supporting Information Infrastruc...Rudolf Husar
 
FR4.L09 - QUANTITATIVE ASSESSMENT ON THE REQUIREMENTS OF DESDYNI MISSION FOR ...
FR4.L09 - QUANTITATIVE ASSESSMENT ON THE REQUIREMENTS OF DESDYNI MISSION FOR ...FR4.L09 - QUANTITATIVE ASSESSMENT ON THE REQUIREMENTS OF DESDYNI MISSION FOR ...
FR4.L09 - QUANTITATIVE ASSESSMENT ON THE REQUIREMENTS OF DESDYNI MISSION FOR ...grssieee
 
Remote sensing of biophysical parameters: linking field, airborne and contine...
Remote sensing of biophysical parameters: linking field, airborne and contine...Remote sensing of biophysical parameters: linking field, airborne and contine...
Remote sensing of biophysical parameters: linking field, airborne and contine...TERN Australia
 
050405 Epa Satellite
050405 Epa Satellite050405 Epa Satellite
050405 Epa SatelliteRudolf Husar
 
DRI Cloud Seeding Forum - Science and Program History
DRI Cloud Seeding Forum - Science and Program HistoryDRI Cloud Seeding Forum - Science and Program History
DRI Cloud Seeding Forum - Science and Program HistoryDRIscience
 
Air pollution Assessment (GIS,RS Approach)
Air pollution Assessment (GIS,RS Approach)Air pollution Assessment (GIS,RS Approach)
Air pollution Assessment (GIS,RS Approach)Ehsan Hamzei
 
IUKWC Workshop Nov16: Developing Hydro-climatic Services for Water Security –...
IUKWC Workshop Nov16: Developing Hydro-climatic Services for Water Security –...IUKWC Workshop Nov16: Developing Hydro-climatic Services for Water Security –...
IUKWC Workshop Nov16: Developing Hydro-climatic Services for Water Security –...India UK Water Centre (IUKWC)
 
AIR POLLUTION MONITORING USING RS
AIR POLLUTION MONITORING USING RSAIR POLLUTION MONITORING USING RS
AIR POLLUTION MONITORING USING RSAbhiram Kanigolla
 

What's hot (19)

2004-09-21 Natural Aerosol Event Detection and Characterization
2004-09-21 Natural Aerosol Event Detection and Characterization2004-09-21 Natural Aerosol Event Detection and Characterization
2004-09-21 Natural Aerosol Event Detection and Characterization
 
2016Sum_LaRC_AppalachianTrailHealthAQ_Presentation_FD
2016Sum_LaRC_AppalachianTrailHealthAQ_Presentation_FD2016Sum_LaRC_AppalachianTrailHealthAQ_Presentation_FD
2016Sum_LaRC_AppalachianTrailHealthAQ_Presentation_FD
 
IUKWC Workshop Nov16: Developing Hydro-climatic Services for Water Security –...
IUKWC Workshop Nov16: Developing Hydro-climatic Services for Water Security –...IUKWC Workshop Nov16: Developing Hydro-climatic Services for Water Security –...
IUKWC Workshop Nov16: Developing Hydro-climatic Services for Water Security –...
 
Air quality challenges and business opportunities in China: Fusion of environ...
Air quality challenges and business opportunities in China: Fusion of environ...Air quality challenges and business opportunities in China: Fusion of environ...
Air quality challenges and business opportunities in China: Fusion of environ...
 
2005-06-03 Aerosol Characterization and the Supporting Information Infrastruc...
2005-06-03 Aerosol Characterization and the Supporting Information Infrastruc...2005-06-03 Aerosol Characterization and the Supporting Information Infrastruc...
2005-06-03 Aerosol Characterization and the Supporting Information Infrastruc...
 
FR4.L09 - QUANTITATIVE ASSESSMENT ON THE REQUIREMENTS OF DESDYNI MISSION FOR ...
FR4.L09 - QUANTITATIVE ASSESSMENT ON THE REQUIREMENTS OF DESDYNI MISSION FOR ...FR4.L09 - QUANTITATIVE ASSESSMENT ON THE REQUIREMENTS OF DESDYNI MISSION FOR ...
FR4.L09 - QUANTITATIVE ASSESSMENT ON THE REQUIREMENTS OF DESDYNI MISSION FOR ...
 
Remote sensing of biophysical parameters: linking field, airborne and contine...
Remote sensing of biophysical parameters: linking field, airborne and contine...Remote sensing of biophysical parameters: linking field, airborne and contine...
Remote sensing of biophysical parameters: linking field, airborne and contine...
 
050405 Epa Satellite
050405 Epa Satellite050405 Epa Satellite
050405 Epa Satellite
 
Poster Nov19 V2
Poster Nov19 V2Poster Nov19 V2
Poster Nov19 V2
 
Trial and error in determining carbon budgets at policy relevant scales
Trial and error in determining carbon budgets at policy relevant scalesTrial and error in determining carbon budgets at policy relevant scales
Trial and error in determining carbon budgets at policy relevant scales
 
DRI Cloud Seeding Forum - Science and Program History
DRI Cloud Seeding Forum - Science and Program HistoryDRI Cloud Seeding Forum - Science and Program History
DRI Cloud Seeding Forum - Science and Program History
 
Air pollution Assessment (GIS,RS Approach)
Air pollution Assessment (GIS,RS Approach)Air pollution Assessment (GIS,RS Approach)
Air pollution Assessment (GIS,RS Approach)
 
Observing methane flux distributions using high resolution air-borne mapping
Observing methane flux distributions using high resolution air-borne mappingObserving methane flux distributions using high resolution air-borne mapping
Observing methane flux distributions using high resolution air-borne mapping
 
CSU_Poster
CSU_PosterCSU_Poster
CSU_Poster
 
IUKWC Workshop Nov16: Developing Hydro-climatic Services for Water Security –...
IUKWC Workshop Nov16: Developing Hydro-climatic Services for Water Security –...IUKWC Workshop Nov16: Developing Hydro-climatic Services for Water Security –...
IUKWC Workshop Nov16: Developing Hydro-climatic Services for Water Security –...
 
Olympics slides
Olympics slidesOlympics slides
Olympics slides
 
AIR POLLUTION MONITORING USING RS
AIR POLLUTION MONITORING USING RSAIR POLLUTION MONITORING USING RS
AIR POLLUTION MONITORING USING RS
 
PARABLE POSTER
PARABLE POSTERPARABLE POSTER
PARABLE POSTER
 
Poster Nov19 V1
Poster Nov19 V1Poster Nov19 V1
Poster Nov19 V1
 

Viewers also liked

2004-09-23 Eastern US Regional Haze Events: Automated Detection and Documenta...
2004-09-23 Eastern US Regional Haze Events: Automated Detection and Documenta...2004-09-23 Eastern US Regional Haze Events: Automated Detection and Documenta...
2004-09-23 Eastern US Regional Haze Events: Automated Detection and Documenta...Rudolf Husar
 
Husar Report to UIC Plenary
Husar Report to UIC PlenaryHusar Report to UIC Plenary
Husar Report to UIC PlenaryRudolf Husar
 
2004-10-15 AIR-257: Satellite Detection of Aerosols: Satellite data and tools...
2004-10-15 AIR-257: Satellite Detection of Aerosols: Satellite data and tools...2004-10-15 AIR-257: Satellite Detection of Aerosols: Satellite data and tools...
2004-10-15 AIR-257: Satellite Detection of Aerosols: Satellite data and tools...Rudolf Husar
 
120612 geia closure_ofeo_ms_soa_subm
120612 geia closure_ofeo_ms_soa_subm120612 geia closure_ofeo_ms_soa_subm
120612 geia closure_ofeo_ms_soa_submRudolf Husar
 
2004-06-20 Fast Aerosol Sensing Tools for Natural Event Tracking FASTNET
2004-06-20 Fast Aerosol Sensing Tools for Natural Event Tracking FASTNET2004-06-20 Fast Aerosol Sensing Tools for Natural Event Tracking FASTNET
2004-06-20 Fast Aerosol Sensing Tools for Natural Event Tracking FASTNETRudolf Husar
 
110510 aq co_p_network
110510 aq co_p_network110510 aq co_p_network
110510 aq co_p_networkRudolf Husar
 
111018 geo sif_aq_interop
111018 geo sif_aq_interop111018 geo sif_aq_interop
111018 geo sif_aq_interopRudolf Husar
 
110823 data fed_solta11
110823 data fed_solta11110823 data fed_solta11
110823 data fed_solta11Rudolf Husar
 
110823 solta11 intro
110823 solta11 intro110823 solta11 intro
110823 solta11 introRudolf Husar
 
Conjugaciones Sing Plur
Conjugaciones Sing PlurConjugaciones Sing Plur
Conjugaciones Sing Plurclark0978
 
070416 Egu Vienna Husar
070416 Egu Vienna Husar070416 Egu Vienna Husar
070416 Egu Vienna HusarRudolf Husar
 

Viewers also liked (11)

2004-09-23 Eastern US Regional Haze Events: Automated Detection and Documenta...
2004-09-23 Eastern US Regional Haze Events: Automated Detection and Documenta...2004-09-23 Eastern US Regional Haze Events: Automated Detection and Documenta...
2004-09-23 Eastern US Regional Haze Events: Automated Detection and Documenta...
 
Husar Report to UIC Plenary
Husar Report to UIC PlenaryHusar Report to UIC Plenary
Husar Report to UIC Plenary
 
2004-10-15 AIR-257: Satellite Detection of Aerosols: Satellite data and tools...
2004-10-15 AIR-257: Satellite Detection of Aerosols: Satellite data and tools...2004-10-15 AIR-257: Satellite Detection of Aerosols: Satellite data and tools...
2004-10-15 AIR-257: Satellite Detection of Aerosols: Satellite data and tools...
 
120612 geia closure_ofeo_ms_soa_subm
120612 geia closure_ofeo_ms_soa_subm120612 geia closure_ofeo_ms_soa_subm
120612 geia closure_ofeo_ms_soa_subm
 
2004-06-20 Fast Aerosol Sensing Tools for Natural Event Tracking FASTNET
2004-06-20 Fast Aerosol Sensing Tools for Natural Event Tracking FASTNET2004-06-20 Fast Aerosol Sensing Tools for Natural Event Tracking FASTNET
2004-06-20 Fast Aerosol Sensing Tools for Natural Event Tracking FASTNET
 
110510 aq co_p_network
110510 aq co_p_network110510 aq co_p_network
110510 aq co_p_network
 
111018 geo sif_aq_interop
111018 geo sif_aq_interop111018 geo sif_aq_interop
111018 geo sif_aq_interop
 
110823 data fed_solta11
110823 data fed_solta11110823 data fed_solta11
110823 data fed_solta11
 
110823 solta11 intro
110823 solta11 intro110823 solta11 intro
110823 solta11 intro
 
Conjugaciones Sing Plur
Conjugaciones Sing PlurConjugaciones Sing Plur
Conjugaciones Sing Plur
 
070416 Egu Vienna Husar
070416 Egu Vienna Husar070416 Egu Vienna Husar
070416 Egu Vienna Husar
 

Similar to Exceptional Event Analysis Tools and Models

2005-10-31 Satellite Aerosol Climatology
2005-10-31 Satellite Aerosol Climatology2005-10-31 Satellite Aerosol Climatology
2005-10-31 Satellite Aerosol ClimatologyRudolf Husar
 
ONLINE SCALABLE SVM ENSEMBLE LEARNING METHOD (OSSELM) FOR SPATIO-TEMPORAL AIR...
ONLINE SCALABLE SVM ENSEMBLE LEARNING METHOD (OSSELM) FOR SPATIO-TEMPORAL AIR...ONLINE SCALABLE SVM ENSEMBLE LEARNING METHOD (OSSELM) FOR SPATIO-TEMPORAL AIR...
ONLINE SCALABLE SVM ENSEMBLE LEARNING METHOD (OSSELM) FOR SPATIO-TEMPORAL AIR...IJDKP
 
2005-10-31 Characterization of Aerosol Events
2005-10-31 Characterization of Aerosol Events2005-10-31 Characterization of Aerosol Events
2005-10-31 Characterization of Aerosol EventsRudolf Husar
 
2005-10-31 Concepts on Aerosol Characterization
2005-10-31 Concepts on Aerosol Characterization2005-10-31 Concepts on Aerosol Characterization
2005-10-31 Concepts on Aerosol CharacterizationRudolf Husar
 
2005-11-12 Characterization of Aerosol Events using the Federated Data System...
2005-11-12 Characterization of Aerosol Events using the Federated Data System...2005-11-12 Characterization of Aerosol Events using the Federated Data System...
2005-11-12 Characterization of Aerosol Events using the Federated Data System...Rudolf Husar
 
0507 Event Analysis 051101 Event Seminar2
0507 Event Analysis 051101 Event Seminar20507 Event Analysis 051101 Event Seminar2
0507 Event Analysis 051101 Event Seminar2Rudolf Husar
 
2008-04-15 EGU Mtg Vienna Exceptional Events
2008-04-15 EGU Mtg Vienna Exceptional Events2008-04-15 EGU Mtg Vienna Exceptional Events
2008-04-15 EGU Mtg Vienna Exceptional EventsRudolf Husar
 
2008-02-11: EPA DataFed Presentation
2008-02-11: EPA DataFed Presentation2008-02-11: EPA DataFed Presentation
2008-02-11: EPA DataFed PresentationRudolf Husar
 
2003-12-04 Evaluation of the ASOS Light Scattering Network
2003-12-04 Evaluation of the ASOS Light Scattering Network2003-12-04 Evaluation of the ASOS Light Scattering Network
2003-12-04 Evaluation of the ASOS Light Scattering NetworkRudolf Husar
 
2004-06-24 Satellite Data Us in PM Management: A Retrospective Assessment
2004-06-24 Satellite Data Us in PM Management: A Retrospective Assessment2004-06-24 Satellite Data Us in PM Management: A Retrospective Assessment
2004-06-24 Satellite Data Us in PM Management: A Retrospective AssessmentRudolf Husar
 
TH3.L10.1: THE NASA SOIL MOISTURE ACTIVE PASSIVE (SMAP) MISSION: OVERVIEW
TH3.L10.1: THE NASA SOIL MOISTURE ACTIVE PASSIVE (SMAP) MISSION: OVERVIEWTH3.L10.1: THE NASA SOIL MOISTURE ACTIVE PASSIVE (SMAP) MISSION: OVERVIEW
TH3.L10.1: THE NASA SOIL MOISTURE ACTIVE PASSIVE (SMAP) MISSION: OVERVIEWgrssieee
 
050405 Epa Characterization
050405 Epa Characterization050405 Epa Characterization
050405 Epa CharacterizationRudolf Husar
 
Smoke Emission Draft
Smoke Emission DraftSmoke Emission Draft
Smoke Emission DraftRudolf Husar
 
2003-10-15 Biomass Smoke Emissions and Transport: Community-based Satellite a...
2003-10-15 Biomass Smoke Emissions and Transport: Community-based Satellite a...2003-10-15 Biomass Smoke Emissions and Transport: Community-based Satellite a...
2003-10-15 Biomass Smoke Emissions and Transport: Community-based Satellite a...Rudolf Husar
 
Citizen Sensing Efforts November 2011
Citizen Sensing Efforts   November 2011Citizen Sensing Efforts   November 2011
Citizen Sensing Efforts November 2011timsdye
 

Similar to Exceptional Event Analysis Tools and Models (20)

EPA Transboundary Air Pollution Workshop Overview - David Dodd, EPA
EPA Transboundary Air Pollution Workshop Overview - David Dodd, EPAEPA Transboundary Air Pollution Workshop Overview - David Dodd, EPA
EPA Transboundary Air Pollution Workshop Overview - David Dodd, EPA
 
2005-10-31 Satellite Aerosol Climatology
2005-10-31 Satellite Aerosol Climatology2005-10-31 Satellite Aerosol Climatology
2005-10-31 Satellite Aerosol Climatology
 
ONLINE SCALABLE SVM ENSEMBLE LEARNING METHOD (OSSELM) FOR SPATIO-TEMPORAL AIR...
ONLINE SCALABLE SVM ENSEMBLE LEARNING METHOD (OSSELM) FOR SPATIO-TEMPORAL AIR...ONLINE SCALABLE SVM ENSEMBLE LEARNING METHOD (OSSELM) FOR SPATIO-TEMPORAL AIR...
ONLINE SCALABLE SVM ENSEMBLE LEARNING METHOD (OSSELM) FOR SPATIO-TEMPORAL AIR...
 
ONLINE SCALABLE SVM ENSEMBLE LEARNING METHOD (OSSELM) FOR SPATIO-TEMPORAL AIR...
ONLINE SCALABLE SVM ENSEMBLE LEARNING METHOD (OSSELM) FOR SPATIO-TEMPORAL AIR...ONLINE SCALABLE SVM ENSEMBLE LEARNING METHOD (OSSELM) FOR SPATIO-TEMPORAL AIR...
ONLINE SCALABLE SVM ENSEMBLE LEARNING METHOD (OSSELM) FOR SPATIO-TEMPORAL AIR...
 
2005-10-31 Characterization of Aerosol Events
2005-10-31 Characterization of Aerosol Events2005-10-31 Characterization of Aerosol Events
2005-10-31 Characterization of Aerosol Events
 
2005-10-31 Concepts on Aerosol Characterization
2005-10-31 Concepts on Aerosol Characterization2005-10-31 Concepts on Aerosol Characterization
2005-10-31 Concepts on Aerosol Characterization
 
2005-11-12 Characterization of Aerosol Events using the Federated Data System...
2005-11-12 Characterization of Aerosol Events using the Federated Data System...2005-11-12 Characterization of Aerosol Events using the Federated Data System...
2005-11-12 Characterization of Aerosol Events using the Federated Data System...
 
0507 Event Analysis 051101 Event Seminar2
0507 Event Analysis 051101 Event Seminar20507 Event Analysis 051101 Event Seminar2
0507 Event Analysis 051101 Event Seminar2
 
4 Sat Rpo Fastnet
4 Sat Rpo Fastnet4 Sat Rpo Fastnet
4 Sat Rpo Fastnet
 
2008-04-15 EGU Mtg Vienna Exceptional Events
2008-04-15 EGU Mtg Vienna Exceptional Events2008-04-15 EGU Mtg Vienna Exceptional Events
2008-04-15 EGU Mtg Vienna Exceptional Events
 
2008-02-11: EPA DataFed Presentation
2008-02-11: EPA DataFed Presentation2008-02-11: EPA DataFed Presentation
2008-02-11: EPA DataFed Presentation
 
PosterV2small
PosterV2smallPosterV2small
PosterV2small
 
2003-12-04 Evaluation of the ASOS Light Scattering Network
2003-12-04 Evaluation of the ASOS Light Scattering Network2003-12-04 Evaluation of the ASOS Light Scattering Network
2003-12-04 Evaluation of the ASOS Light Scattering Network
 
2004-06-24 Satellite Data Us in PM Management: A Retrospective Assessment
2004-06-24 Satellite Data Us in PM Management: A Retrospective Assessment2004-06-24 Satellite Data Us in PM Management: A Retrospective Assessment
2004-06-24 Satellite Data Us in PM Management: A Retrospective Assessment
 
TH3.L10.1: THE NASA SOIL MOISTURE ACTIVE PASSIVE (SMAP) MISSION: OVERVIEW
TH3.L10.1: THE NASA SOIL MOISTURE ACTIVE PASSIVE (SMAP) MISSION: OVERVIEWTH3.L10.1: THE NASA SOIL MOISTURE ACTIVE PASSIVE (SMAP) MISSION: OVERVIEW
TH3.L10.1: THE NASA SOIL MOISTURE ACTIVE PASSIVE (SMAP) MISSION: OVERVIEW
 
050405 Epa Characterization
050405 Epa Characterization050405 Epa Characterization
050405 Epa Characterization
 
Smoke Emission Draft
Smoke Emission DraftSmoke Emission Draft
Smoke Emission Draft
 
2003-10-15 Biomass Smoke Emissions and Transport: Community-based Satellite a...
2003-10-15 Biomass Smoke Emissions and Transport: Community-based Satellite a...2003-10-15 Biomass Smoke Emissions and Transport: Community-based Satellite a...
2003-10-15 Biomass Smoke Emissions and Transport: Community-based Satellite a...
 
Citizen Sensing Efforts November 2011
Citizen Sensing Efforts   November 2011Citizen Sensing Efforts   November 2011
Citizen Sensing Efforts November 2011
 

More from Rudolf Husar

110509 aq co_p_solta
110509 aq co_p_solta110509 aq co_p_solta
110509 aq co_p_soltaRudolf Husar
 
110421 exploration of_pm_networks_and_data_over_the_us-_aqs_and_views
110421 exploration of_pm_networks_and_data_over_the_us-_aqs_and_views110421 exploration of_pm_networks_and_data_over_the_us-_aqs_and_views
110421 exploration of_pm_networks_and_data_over_the_us-_aqs_and_viewsRudolf Husar
 
110410 aq user_req_methodology_sydney_subm
110410 aq user_req_methodology_sydney_subm110410 aq user_req_methodology_sydney_subm
110410 aq user_req_methodology_sydney_submRudolf Husar
 
110408 aq co_p_uic_sydney_husar
110408 aq co_p_uic_sydney_husar110408 aq co_p_uic_sydney_husar
110408 aq co_p_uic_sydney_husarRudolf Husar
 
110105 htap pilot_aqco_p_esip_dc
110105 htap pilot_aqco_p_esip_dc110105 htap pilot_aqco_p_esip_dc
110105 htap pilot_aqco_p_esip_dcRudolf Husar
 
100615 htap network_brussels
100615 htap network_brussels100615 htap network_brussels
100615 htap network_brusselsRudolf Husar
 
120910 nasa satellite_outline
120910 nasa satellite_outline120910 nasa satellite_outline
120910 nasa satellite_outlineRudolf Husar
 
110414 extreme dustsmokesulfate
110414 extreme dustsmokesulfate110414 extreme dustsmokesulfate
110414 extreme dustsmokesulfateRudolf Husar
 
Aq Gci Infrastructure
Aq Gci InfrastructureAq Gci Infrastructure
Aq Gci InfrastructureRudolf Husar
 
AQ GCI Infrastructure
AQ GCI InfrastructureAQ GCI Infrastructure
AQ GCI InfrastructureRudolf Husar
 
2004-06-23 Retrieval of smoke aerosol loading from remote sensing data
2004-06-23 Retrieval of smoke aerosol loading from remote sensing data2004-06-23 Retrieval of smoke aerosol loading from remote sensing data
2004-06-23 Retrieval of smoke aerosol loading from remote sensing dataRudolf Husar
 
2004-06-24 Co-retrieval of Aerosol and Surface Reflectance: Analysis of Daily...
2004-06-24 Co-retrieval of Aerosol and Surface Reflectance: Analysis of Daily...2004-06-24 Co-retrieval of Aerosol and Surface Reflectance: Analysis of Daily...
2004-06-24 Co-retrieval of Aerosol and Surface Reflectance: Analysis of Daily...Rudolf Husar
 
2004-07-28 Fast Aerosol Sensing Tools for Natural Event Tracking FASTNET
2004-07-28 Fast Aerosol Sensing Tools for Natural Event Tracking FASTNET2004-07-28 Fast Aerosol Sensing Tools for Natural Event Tracking FASTNET
2004-07-28 Fast Aerosol Sensing Tools for Natural Event Tracking FASTNETRudolf Husar
 
2004-09-12 Data and Tools for Air Quality Management:
2004-09-12 Data and Tools for Air Quality Management:2004-09-12 Data and Tools for Air Quality Management:
2004-09-12 Data and Tools for Air Quality Management:Rudolf Husar
 
2004-09-12 Data and Tools for Web-Based Monitoring and Analysis
2004-09-12 Data and Tools for Web-Based Monitoring and Analysis2004-09-12 Data and Tools for Web-Based Monitoring and Analysis
2004-09-12 Data and Tools for Web-Based Monitoring and AnalysisRudolf Husar
 
2004-09-23 PM Event Detection from Time Series
2004-09-23 PM Event Detection from Time Series2004-09-23 PM Event Detection from Time Series
2004-09-23 PM Event Detection from Time SeriesRudolf Husar
 

More from Rudolf Husar (16)

110509 aq co_p_solta
110509 aq co_p_solta110509 aq co_p_solta
110509 aq co_p_solta
 
110421 exploration of_pm_networks_and_data_over_the_us-_aqs_and_views
110421 exploration of_pm_networks_and_data_over_the_us-_aqs_and_views110421 exploration of_pm_networks_and_data_over_the_us-_aqs_and_views
110421 exploration of_pm_networks_and_data_over_the_us-_aqs_and_views
 
110410 aq user_req_methodology_sydney_subm
110410 aq user_req_methodology_sydney_subm110410 aq user_req_methodology_sydney_subm
110410 aq user_req_methodology_sydney_subm
 
110408 aq co_p_uic_sydney_husar
110408 aq co_p_uic_sydney_husar110408 aq co_p_uic_sydney_husar
110408 aq co_p_uic_sydney_husar
 
110105 htap pilot_aqco_p_esip_dc
110105 htap pilot_aqco_p_esip_dc110105 htap pilot_aqco_p_esip_dc
110105 htap pilot_aqco_p_esip_dc
 
100615 htap network_brussels
100615 htap network_brussels100615 htap network_brussels
100615 htap network_brussels
 
120910 nasa satellite_outline
120910 nasa satellite_outline120910 nasa satellite_outline
120910 nasa satellite_outline
 
110414 extreme dustsmokesulfate
110414 extreme dustsmokesulfate110414 extreme dustsmokesulfate
110414 extreme dustsmokesulfate
 
Aq Gci Infrastructure
Aq Gci InfrastructureAq Gci Infrastructure
Aq Gci Infrastructure
 
AQ GCI Infrastructure
AQ GCI InfrastructureAQ GCI Infrastructure
AQ GCI Infrastructure
 
2004-06-23 Retrieval of smoke aerosol loading from remote sensing data
2004-06-23 Retrieval of smoke aerosol loading from remote sensing data2004-06-23 Retrieval of smoke aerosol loading from remote sensing data
2004-06-23 Retrieval of smoke aerosol loading from remote sensing data
 
2004-06-24 Co-retrieval of Aerosol and Surface Reflectance: Analysis of Daily...
2004-06-24 Co-retrieval of Aerosol and Surface Reflectance: Analysis of Daily...2004-06-24 Co-retrieval of Aerosol and Surface Reflectance: Analysis of Daily...
2004-06-24 Co-retrieval of Aerosol and Surface Reflectance: Analysis of Daily...
 
2004-07-28 Fast Aerosol Sensing Tools for Natural Event Tracking FASTNET
2004-07-28 Fast Aerosol Sensing Tools for Natural Event Tracking FASTNET2004-07-28 Fast Aerosol Sensing Tools for Natural Event Tracking FASTNET
2004-07-28 Fast Aerosol Sensing Tools for Natural Event Tracking FASTNET
 
2004-09-12 Data and Tools for Air Quality Management:
2004-09-12 Data and Tools for Air Quality Management:2004-09-12 Data and Tools for Air Quality Management:
2004-09-12 Data and Tools for Air Quality Management:
 
2004-09-12 Data and Tools for Web-Based Monitoring and Analysis
2004-09-12 Data and Tools for Web-Based Monitoring and Analysis2004-09-12 Data and Tools for Web-Based Monitoring and Analysis
2004-09-12 Data and Tools for Web-Based Monitoring and Analysis
 
2004-09-23 PM Event Detection from Time Series
2004-09-23 PM Event Detection from Time Series2004-09-23 PM Event Detection from Time Series
2004-09-23 PM Event Detection from Time Series
 

Exceptional Event Analysis Tools and Models

  • 1. Rudolf B. Husar Washington University, St. Louis Seminar Presented at Environmental Protection Agency, Research Triangle Park February 5, 2013 Exceptional Event Analysis for 2012 Smoke and Dust Events Exceptional Events: Past, Present, Future Data, Models, Tools: Decision Support Systems NRL NAAPS Model: Advancement in Science
  • 2. Mexican Smoke over the E. U, May 1998 Record Smoke Impact on PM Concentrations Smoke Event
  • 3. Asian Dust Cloud over N. America On April 27, the dust cloud arrived in North America. Regional average PM10 concentrations increased to 65 mg/m3 In Washington State, PM10 concentrations exceeded 100 mg/m3 Asian Dust 100 mg/m3 Hourly PM10
  • 4. Continental/Hemispheric Dust Events over the US Gobi dust in spring Sahara in summer Regional-scale fine dust events are mainly from intercontinental transport Fine Dust Events, 1992-2003 - VIEWS ug/m3
  • 5. EE Rule Features – RH Perspective • Not rigid, weight of evidence approach • Not based on single FRM measurement • Encourages use of diverse data and models • Satellites, real-time, model etc. • There is a role of science in AQ Management • EE events demand science, particularly the ‘but for’ clause
  • 6. Near-Real-Time Data for May 11, 07 GA Smoke Displayed on DataFed Analysts Console Pane 1,2: MODIS visible satellite images – smoke pattern Pane 3,4: AirNOW PM2.5, Surf. Visibility – PM surface conc. Pane 5,6: AirNOW Ozone, Surf. Wind – Ozone, transport pattern Pane 7,8: OMI satellite Total, Tropospheric NO2 – NO2 column conc. Pane 9,10: OMI satellite Aerosol Index, Fire P-xels – Smoke, Fire Pane 11,12: GOCART, NAAPS Models of smoke – Smoke forecast 1 10 2 4 5 8 7 6 3 9 12 11 Console Links May 07, 2007, May 08, 2007 May 09, 2007 May 10, 2007 May 11, 2007 May 12, 2007 May 13, 2007 May 14, 2007 May 15, 2007
  • 7. ‘But for’ demonstration: May 2007 Georgia Smoke Red backtrajectories pass through source area
  • 8. NO2 form Fires Evidence: OMI Sweat Water fire in S. Georgia (May 2007)
  • 9. NO2 form Fires Evidence: OMI Sweat Water fire in S. Georgia (May 2007)
  • 10. 2007: Exceptional Event Rule in Federal Register EPA-Approved EE Flags, 2006-2011 EE flags were added to FRM PM2.5 and ozone data in AQS
  • 11. Foreign Sources Pattern of EE flagged PM2.5 data, 2006-2012 Domestic Sources
  • 12. Trend of PM2.5 Concentration A reason for the 2006-2010 EE flag decline is the overall reduction in PM2.5 concentrations. 2000-2003 avg. 2009-2012 avg. As a result of PM2.5 decline, the number of >35ug/m3 samples has also declined dramatically. No NAAQS exceedances-no EE flag. >35 ug/m3 station count
  • 13. Regional Haze Rule: Natural Aerosol The goal is to attain natural conditions by 2064; Baseline during 2000-2004, first Natural Cond. SIP in 2008; SIP & Natural Condition Revisions every 10 yrs
  • 14. PM2.5 EE Flag Decline Expected Increase in 2012 Trend of EE flags for PM2.5between 2006 and 2012 based on the official EPA AQS database. The EE flags declined tenfold between 2007-8 and 2010-11 However, in 2012 the average AOT from smoke was higher than any year between 2006 and 2012, probably due the severe drought. The EE flags for 2012 are expected to rise again in 2012. Drought Anomaly, 2012
  • 15. Smoke Super-Events in 2012: August 1- August 20 20 June 20- July 10 Average Smoke Emission Rate Average Smoke Optical Depth Average Smoke Surface Concentration
  • 16. O3 ‘Violation’ Trends Number of CONUS Stations with O3>75 ppb 2010-2013 1993-2013 Apr-Oct 2012
  • 17. Exceptional Event Decision Support System (EE DSS) EE_CATT Screencast NASA Grant: 2009-2012 NASA and NAAPS Products for Air Quality Decision Making, D. Westphal, PI, R. Husar, CoI Washington University, McDonald Academy for Global Energy and Environmental Partnership (MAGEEP)
  • 19. October 2012 MT-KS Dust Event 121015_Montana_Dust Event
  • 20. October 2012 Dust Event: Passage of the dust plume
  • 21. Oklahoma Dust Plume Event over Huntsville, Alabama October 19, 2012 NSSTC Rooftop Camera, Looking East, without and with Dust Kevin Knupp, Michael Newchurch, Udaysankar Nair, Dustin Phillips, David Bowdle, Shih Kuang, Wesley Cantrel, University of Alabama in Huntsville Kathy Jones Chattanooga-Hamilton County Air Pollution Control Bureau Claire Aiello WHNT TV, Huntsville, Alabama Atmospheric Science Brown Bag Mini-Seminar, October 23, 2012
  • 22. Fort Payne (Kim Pendergrass) Colbert Heights Mountain Looking East, (Carter Watkins) Lake Guntersville Monte Sano (Rebekah Bynum) Donegal Drive, looking west (Megan Hayes, WHNT) WHNT TV photographs Monte Sano (Jacks Camera Network, WHNT) Oklahoma Dust Plume Event over Huntsville, Alabama, October 19, 2012
  • 24. Oklahoma Dust Plume Event over Huntsville, Alabama, October 19, 2012 http://vortex.nsstc.uah.edu/mips/data/current/ceilometer/ Time-Height Cross-Section of Relative Signal Intensity from Vertically Viewing Ceilometer Mobile Integrated Profiling System (MIPS), University of Alabama in Huntsville Altitude in km, time in Coordinated Universal Time (CDT = UTC - 05:00), intensity in false color Peak at ~17 UTC (12 N EDT)
  • 25. EE DSS Tools: Data System Architecture • Data are accessible from the Air Quality Data Network (ADN) by the AQ Community Catalog • ADN is facilitated by the GEO AQ Community of Practice (GEO AQ CoP), including R. Husar’s group. • The generic client tools (red boxes) are for processing and visualization; used in many applications • Specialized Application Tools are dedicated to specific applications, e.g. event detection
  • 26. Application-Task-Centric Workspace Example: EventSpaces Catalog - Find Dataset Specific Exceptional Event Harvest Resources
  • 27. EE DSS Links CATT – General EE_CATT 121015_Montana_Dust Event 110414_Kansas_Smoke Event Screencast Anomaly Map
  • 28. Navy Aerosol Analysis and Prediction System NAAPS by D. Westphal et al, NRL Why I luv NAAPS: 1. Assimilates satellite aerosol optical thickness and fire pixels 2. Provides 4D aerosol structure for dust, smoke, sulfate, sea salt 3. Open access to 10 years of global simulations (via DataFed)
  • 29. Navy Aerosol Analysis and Prediction System September 11, 2011 Key: Smoke = blue Dust = green Sulfate = red D. Westphal
  • 30. NASA Data for NAAPS Initialization Forecasting is an initial value problem: Requires the 3-D distribution of aerosol concentration at the start of the forecast: : Assimilation of previous forecast + information from remote sensing of aerosols Current capabilities: Aerosol Optical Depth (AOD; 2-D) (MODIS and MISR) Extinction (3-D) (CALIPSO) + Land/Ocean MODIS + Land/Ocean MISR Natural run + Ocean MODIS + land/Ocean MISR Multiple aerosol sensors are critical for assimilation.
  • 31. Aerosol Optical Thickness – Aeronet The Gold Standard for Satellite Calibration
  • 33. VIEWS Sulfate – NAAPS Sulfate OBSERVATION MODEL SO4 BIAS
  • 34. Goal: ‘Reconciliation’, ‘Harmonization’…’Closure’ By iterative refinement of of Emissions, Observations and Models HTAP, 2010 Reconciling emissions, observations and models (EOMs), has been elusive EOMs are generally autonomous and quite separate activities Software tools are available to support EOM reconciliation But closing the EOM loop requires “interoperability” of people and machines
  • 35. 4D Dust, Smoke, Sulfate Vertical Cross Section Views Vertical dust cross sections at about 120 (surface plume) and 1000 km (elevated plume). Knowing the vertical structure of smoke and dust plumes is critical to EE documentation The DataFed Browser now incorporates vertical cross section views
  • 36. Long-Term Model Data 2006-Now A significant fraction of the dust vertical column is in the troposphere and it is ‘global’ Most of surface dust is local and highly variable in space and time Emission Vertical AOT Surface Conc.
  • 37. Satellite-Surface PM relationship The NAAPS helps separating local and ‘global’ dust but much work is needed
  • 38. OBSERVATION MODEL PM2.5 BIAS EPA PM2.5 – CMAQ Model PM2.5 Summer
  • 39. EPA PM2.5 – CMAQ Model PM2.5 Bias Winter OBSERVATION MODEL PM2.5 BIAS
  • 40. Tool to Iteratively Reduce the Bias Actual closure to be worked out by the AQ community DJF JJA SON MAM Nitrate Low in DJF Add nitrate source Inverse modeling of VIEWS Nitrate Organics Low in DJF Improved smoke by combined chemical, satellite, space-time Fine Dust Low in MAM Add Sahara, local dust Dust and smoke BC for CMAQ – e.g. NAAPS Bio. Organics High MAM & JJA Reduce biogenic OC Adjust source trem NAAPS Dust, July VIEWS NO3 DJF CMAQ EPA PM2.5 – CMAQ Model PM2.5 Bias Winter
  • 41. Many Thanks: • Kari Hoijarvi • Erin Robinson • Rich Poirot • Doug Westphal • Neil Frank

Editor's Notes

  1. The Exceptional Event that triggered the fist regulatory response by EPA was the May 1998 Mexican smoke event. The color images from the NASA SeaWiFS satellite (louched in 1997) allowed the detection and following the evolution of the smoke event.Based on the record smoke impact on the PM10 concentration over the entire Eastern US, the EPA issued a memorandum to the States, as a precursor of the Exceptional Event Rule, promulgated in 2007.------------------Since time immemorial, smoke from forest fires, wind-blown dust storms and other ‘exceptional events’ have punctuated the air quality with extreme concentrations of atmospheric particulates and gases. However, historically the spatio-temporal pattern of air quality during such events was sparse and patchy. This has changed dramatically during the sensing revolution of the 1990s, in particular through the near-real-time availability of color satellite images. Satellites the became the primary sensory inputs for event detection and spatio-temporal characterization. Satellite observations were also responsible for formally including Exceptional Events into the AQ management process. When combined with routine surface-based monitoring data …In the past, the definition and documentation of events has been subjective, dependent on the analyst, the is event type etc.The routine overall characterization of detected events is accomplished by the rich real-time data through delivered through the Analysts ConsolesObjective event definition is now possible through spatio-temporal statistical parameters derivable from routine monitoring dataand their causes is still poorly understood and largely unpredictable.
  2. The spatial distribution of EE flags attributed to Mexican and Canadian fires (left). EE flags attributed to prescribed and wild fires within the US (right). The time series below each map shows the number of flags throughout the country for each day. The spatial distribution of EE flags attributed to African and Asian dust. (left). EE flags attributed to dust origination within the US(right).
  3. NAAPS general description. Species are sulfate, dust, smoke, and sea salt. Aspects impacted by NASA remote sensing products are specification of sources and initialization.Each term in the equation can dominate at one time or another.  At a source grid point, S is dominant.  One grid point away, advection could be largest.  In a cloud R is largest. etc.Image is a composite of geostationary clouds, fires from FLAMBE (pink and yellow dots), and NAAPS aerosol plume forecasts (see legend). It shows 1) production and transport of anthropogenic aerosol in northern latitudes (red), 2) Saharan dust over the Atlantic being scavenged by two tropical cyclones, and 3) smoke from thousands of African fires transported to S. America.
  4. NAAPS initialization benefits from the current 2-D assimilation of aerosol optical depth (AOD) provided by satellite remote sensing (MODIS and MISR) and also 3-D extinction values derived from the CALIPSO CALIOP lidar. The initial conditions are thus improved by assimilating these two parameters.
  5. The August 2012 Western US smoke is a Continental-scale event.While the NAAPS AOT column concentration stretches over much of the continent (>5000 km), the smoke impact on the surface is diminished by about 1000 km. This indicates long distance smoke transport aloft. In fact the PM2.5 concentrations reported in Airnow, do not show smoke impact except near the fires in Idaho.