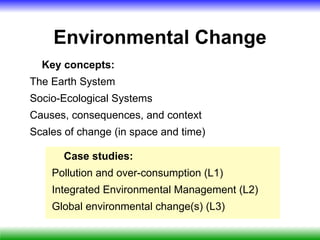
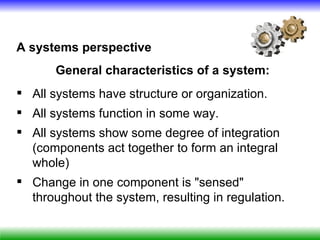
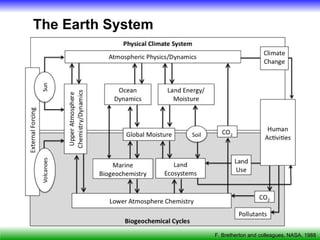
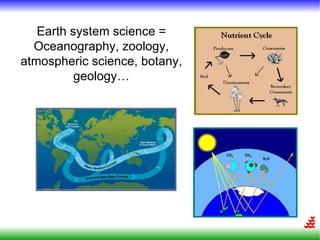
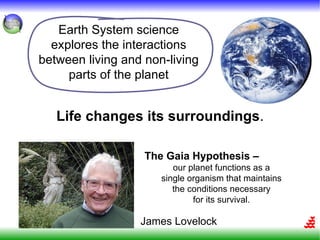
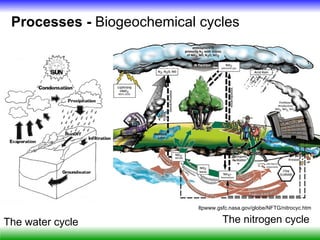
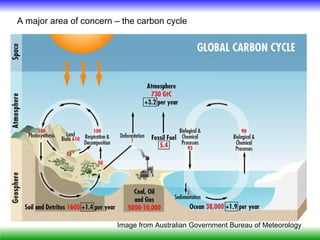
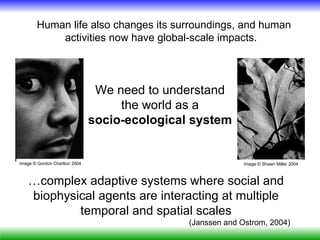
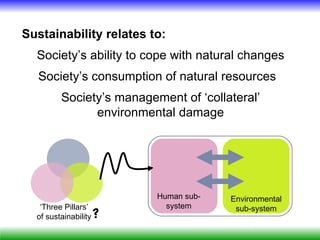
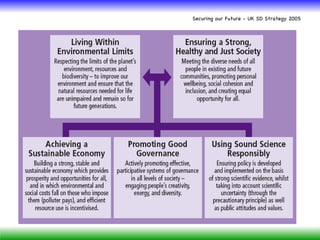
Sustainable Development
    and the Environment
     Dr Sarah Cornell
sarah.cornell@bristol.ac.uk


     Lecture slides and notes will be on Blackboard
Environmental Change
  Key concepts:
The Earth System
Socio-Ecological Systems
Causes, consequences, and context
Scales of change (in space and time)

      Case studies:
    Pollution and over-consumption (L1)
    Integrated Environmental Management (L2)
    Global environmental change(s) (L3)
A systems perspective
       General characteristics of a system:
 All systems have structure or organization.
 All systems function in some way.
 All systems show some degree of integration
  (components act together to form an integral
  whole)
 Change in one component is "sensed"
  throughout the system, resulting in regulation.
The Earth System


                   F. Bretherton and colleagues, NASA, 1988
Earth system science =
  Oceanography, zoology,
atmospheric science, botany,
          geology…
Earth System science
  explores the interactions
between living and non-living
     parts of the planet


   Life changes its surroundings.

                   The Gaia Hypothesis –
                         our planet functions as a
                      single organism that maintains
                         the conditions necessary
                              for its survival.

                  James Lovelock
Processes - Biogeochemical cycles


                            ltpwww.gsfc.nasa.gov/globe/NFTG/nitrocyc.htm

The water cycle                      The nitrogen cycle
A major area of concern – the carbon cycle


                        Image from Australian Government Bureau of Meteorology
Human life also changes its surroundings, and human
           activities now have global-scale impacts.


                                We need to understand
                                    the world as a
                               socio-ecological system


Image © Gordon Charlton 2004                                 Image © Shawn Miller 2004


   …complex adaptive systems where social and
   biophysical agents are interacting at multiple
           temporal and spatial scales
                                               (Janssen and Ostrom, 2004)
Sustainability relates to:
  Society’s ability to cope with natural changes
  Society’s consumption of natural resources
         Society’s management of ‘collateral’
               environmental damage


                          Human sub-   Environmental
   ‘Three Pillars’          system      sub-system
  of sustainability   ?
Securing our Future - UK SD Strategy 2005
PSR (or DSR or DPSIR)
            Framework -

   Many configurations - OECD, EEA, Defra, academic

• Allows for conceptual links in both directions
• Can be applied to multiple scales
• Can deal with processes - not just snapshot

       But it doesn’t point society along the right or
                     ‘good’ direction -
         It is a framework for tackling problems
Pressure-State-Response Framework

       D                  P               S                I
Driving Forces in                    State Change in   Impacts on
                      Pressures
     Society                          Environment        Society

  Agriculture
                       Land and                        Environmental
   Industry                              Physical,
                     Resource Use                        goods &
    Energy                             chemical and      services
                      Emissions         ecological
   Transport                               state       Human Society
                     Technological
   Services              risks
  Households


 S e c to r         Environmental     Statement of        Social
  P o lic y             Policy         Objectives      Prioritisation


                              Response
Pressure-State-Response Framework

D                P              S            I

    Human
                            Environment
    Society


                                          Human
                                          Society


              Environment


                     Response
More people, more affluence,
           more technology
   = much more demanding of resources


• Plots from Steffen et al., 2003. IGBP.
• Read about P-A-T in Ehrlich, P.R. and J.P. Holdren, 1971.
        Impact of Population Growth. Science 171: 1212-17.
Image from Australian Government Bureau of Meteorology


Undesirable consequences…
 Perturbed elemental cycles


Image from ORNL
Altered air chemistry   Land cover change


                            Growing evidence of
                           changing temperature
                                    and
                          Earth System feedbacks
Next two lectures –

looking at impacts and responses at
       local and global scales

For now –
    some unsustainability stories
The 1950s Smog Story
  Smoke and sulphur dioxide from
industrial sources and domestic coal
  fires accumulate in moist, still air


                                         SO2 dissolves to form
                                            concentrated
                                            sulphuric acid
                                               particles
             Water vapour
                                           Droplet tends to
            condenses onto
                                          absorb more water
              the fine soot
                                             fog thickens
4000 deaths in
       5 days
Each day:
• 1,000 tonnes of smoke particles
• 2,000 tonnes of carbon dioxide
• 140 tonnes of hydrochloric acid
• 370 tonnes of SO2 were converted
 into 800 tonnes of sulphuric acid.


           Image from Met Office
UK Government response:
     Clean Air Acts of 1956 and 1968  “smokeless zones”, controls on
     industrial sources of pollution (tall chimneys for waste gas dispersal).
     1997 National Air Quality Strategy set targets for 2005.
                        30% decrease since 1970
                                  Excess deposition of SO2 in Europe (in tons/km2)
European legislation:                             www.emep.int
    • controls pollution from
    industry and now transport
    • sets health limits for
    common air pollutants,
    including SO2, particulate
    matter, lead and NOx.
Controls:
Change fuel - coal and oil desulphurisation
Change combustion - pressurised fluidised bed
chambers - remove S as fuel burns
Change emissions - flue gas desulphurisation


               CaCO3 + H2SO4 → CaSO4 + H2O + CO2
             limestone               gypsum
Data from European Environment
                          Agency, 2000.
x1012 g S yr-1


                    Netherlands policy
                 initiatives have sharply
                 reduced SO2 emissions
                    to the atmosphere


                   Reference shows emissions at
                  1980 rate corrected for electricity
                             generation
The Water Quality story
  Nitrogen and phosphorus are
  essential nutrients for plants.


Sources of phosphorus - agricultural fertilizers and
pesticides, and wastewater treatment.
Sources of nitrogen - fertilizers, intensive agriculture
(NH3), wastewater, combustion processes (as NOx),
including vehicle engines.
What is the fate of N and P applied to land
    surface or released into the atmosphere?

                      Rain washes nutrients into
                         streams and rivers
                     Nutrients enhance growth of
                            aquatic plants
                    Algal blooms die back when the
                         nutrients are depleted


Rotting algae consume all the
dissolved oxygen in the water,
  causing eutrophication and
     ecosystem damage
                                         Photo courtesy of Stephanie Lindloff,
                                             River Alliance of Wisconsin.
http://www.defra.gov.uk/environment/water/quality

Water Quality and the Law
Important legislation affecting water policy (up to 2003)
Safeguarding water supplies and their quality for now and the future is a vital task. It is a legal duty not to cause or allow water
pollution, as well as an environmental and social responsibility.
The Environmental Protection Act 1990 established statutory provisions for a range of environment protection
purposes including integrated pollution control for dangerous processes.
The Water Resources            Act 1991 consolidated previous water legislation in respect of both the quality and quantity of
water resources.
The Water     Industry Act 1991 consolidated legislation relating to the supply of water and the provision of sewerage
services.
The Environment Act 1995 established the Environment Agency, and introduced measures to enhance protection of
the environment, including further powers for the prevention and remediation of water pollution.
The EC Surface Water Abstraction                  Directives (75/440/EEC) set quality objectives for the surface water
sources from which drinking water is taken.
The EC Bathing Water Directive (76/160/EEC) sets standards aimed at protecting the health of bathers and
maintaining the aesthetic quality of bathing waters.
The EC Freshwater Fish (78/659/EEC) and Shellfish Waters Directives (79/923/EEC) are aimed
at protecting the health of freshwater fish and shellfish populations, by designating waters in need of protection and setting
quality standards for those waters. There is also a directive that aims to protect the health of consumers of shellfish by
enforcing bacterial quality standards.
The EC Dangerous Substances Directives (76/464/EEC), together with the Water Resources Act 1991,
require control over inputs of dangerous substances into water.
The EC Groundwater Directive (80/68/EEC) is related to the Dangerous Substances Directives and applies to
groundwater protection. Groundwater is water held underground in rock formations.
The EC Urban Waste Water Treatment Directive (91/271/EEC) sets requirements for the provision of
collecting systems and the treatment of sewage according to the size of the discharge and the nature of the receiving water.
The EC Nitrate Directive          (91/676/EEC) requires member states to reduce the nitrate pollution in waters that arises
from agricultural inputs.
CSI report, 2005


Key policy question:
Is eutrophication in European surface waters decreasing?


                                            Key message:
                                There has been no general reduction in
                                    eutrophication (as measured by
                               chlorophyll-a concentrations) since 1985.
                                   Chlorophyll-a concentrations have
                                 increased in a few coastal areas and
                                         decreased in others.
What are the differences between the
        smog story and the water story?

• Point source pollution    • Diffuse source pollution
• One major source          • Multiple sources
• Substitutes for coal      • No substitution for N or P
• Technology available at   • No technological solution
  reasonable cost           • Indirect impact on humans,
• Direct and acute impact     usually cumulative not
  on humans                   acute
• Local impact              • Often displaced impact
What hope for Water Quality?
           EU Water Framework Directive

It requires all inland and coastal water bodies to reach at
least "good status" by 2015.
It promises joined-up science and joined-up governance:
• integration of surface/groundwater and quality/quantity.
• linking management of water with other policy sectors that
        have an impact on the water environment.
Stories of Irreversible Changes -
     use of non-renewable resources


                             Nauru
                        (2,500 miles SW of Honolulu)
Nauru’s phosphate mining started before 1900. For a period
after it became a republic, in 1968, its per capita income was
second only to Saudi Arabia’s.

       90% of the island surface has been mined.
  By 2005, virtually all phosphate reserves were depleted.


• The economy collapsed in the 1990s… notorious for
money-laundering, now largely dependent on aid.
• The island is widely regarded as an environmental
wasteland… (no birds, food and water are imported)
• The community has been struggling with weak governance
and reduced wellbeing – rehabilitation of the island is difficult
                            e.g., www.economist.com/node/11090649; CIA world factbook
Would we be so foolish…?

                           F o s s il f u e ls a n d
                           the H ub b e rt P e a k


                           Non-OPEC, non-FSU production
                                has already peaked.
Carrying capacity                            = the population level that can be supported,
                                                            given the life infrastructure present
                                                         (food, habitat, water and other resources)

                                                                                          Carrying
                                                                                          Capacity
                     Resources                                                                           }
                                                                                            Population


                                                        Sustainable (?)
                                                         development


                                                                                        time

A little warning note – this concept needs care in application. Lots of literature explains why…
Carrying capacity …

                                      Carrying
                                      Capacity
           Resources                                    Population


                           Too-rapid development


                                                                     time


   Recall earlier reference to Paul Ehrlich (IPAT) - http://dieoff.org/page112.htm
   Donella Meadows - http://www.sustainer.org/dhm_archive/
   http://www.sustainer.org/dhm_archive/index.php?display_article=vn385npped
Carrying Capacity … and Ecological Footprints
                                  Carrying
                                  Capacity            Capacity
Resources
                                               }    - Footprint
                                      Population
                                                   +ve or -ve?


             Sustainable (?)
              development


                               time


                                                      see pthbb.org/natural
Copyright 1993 Watterson (Universal Press Syndicate)

SD2011 env sci 1

  • 1.
    Sustainable Development and the Environment Dr Sarah Cornell sarah.cornell@bristol.ac.uk Lecture slides and notes will be on Blackboard
  • 2.
    Environmental Change Key concepts: The Earth System Socio-Ecological Systems Causes, consequences, and context Scales of change (in space and time) Case studies: Pollution and over-consumption (L1) Integrated Environmental Management (L2) Global environmental change(s) (L3)
  • 3.
    A systems perspective General characteristics of a system:  All systems have structure or organization.  All systems function in some way.  All systems show some degree of integration (components act together to form an integral whole)  Change in one component is "sensed" throughout the system, resulting in regulation.
  • 4.
    The Earth System F. Bretherton and colleagues, NASA, 1988
  • 5.
    Earth system science= Oceanography, zoology, atmospheric science, botany, geology…
  • 6.
    Earth System science explores the interactions between living and non-living parts of the planet Life changes its surroundings. The Gaia Hypothesis – our planet functions as a single organism that maintains the conditions necessary for its survival. James Lovelock
  • 7.
    Processes - Biogeochemicalcycles ltpwww.gsfc.nasa.gov/globe/NFTG/nitrocyc.htm The water cycle The nitrogen cycle
  • 8.
    A major areaof concern – the carbon cycle Image from Australian Government Bureau of Meteorology
  • 9.
    Human life alsochanges its surroundings, and human activities now have global-scale impacts. We need to understand the world as a socio-ecological system Image © Gordon Charlton 2004 Image © Shawn Miller 2004 …complex adaptive systems where social and biophysical agents are interacting at multiple temporal and spatial scales (Janssen and Ostrom, 2004)
  • 10.
    Sustainability relates to: Society’s ability to cope with natural changes Society’s consumption of natural resources Society’s management of ‘collateral’ environmental damage Human sub- Environmental ‘Three Pillars’ system sub-system of sustainability ?
  • 11.
    Securing our Future- UK SD Strategy 2005
  • 12.
    PSR (or DSRor DPSIR) Framework - Many configurations - OECD, EEA, Defra, academic • Allows for conceptual links in both directions • Can be applied to multiple scales • Can deal with processes - not just snapshot But it doesn’t point society along the right or ‘good’ direction - It is a framework for tackling problems
  • 13.
    Pressure-State-Response Framework D P S I Driving Forces in State Change in Impacts on Pressures Society Environment Society Agriculture Land and Environmental Industry Physical, Resource Use goods & Energy chemical and services Emissions ecological Transport state Human Society Technological Services risks Households S e c to r Environmental Statement of Social P o lic y Policy Objectives Prioritisation Response
  • 14.
    Pressure-State-Response Framework D P S I Human Environment Society Human Society Environment Response
  • 15.
    More people, moreaffluence, more technology = much more demanding of resources • Plots from Steffen et al., 2003. IGBP. • Read about P-A-T in Ehrlich, P.R. and J.P. Holdren, 1971. Impact of Population Growth. Science 171: 1212-17.
  • 16.
    Image from AustralianGovernment Bureau of Meteorology Undesirable consequences… Perturbed elemental cycles Image from ORNL
  • 17.
    Altered air chemistry Land cover change Growing evidence of changing temperature and Earth System feedbacks
  • 18.
    Next two lectures– looking at impacts and responses at local and global scales For now – some unsustainability stories
  • 19.
    The 1950s SmogStory Smoke and sulphur dioxide from industrial sources and domestic coal fires accumulate in moist, still air SO2 dissolves to form concentrated sulphuric acid particles Water vapour Droplet tends to condenses onto absorb more water the fine soot  fog thickens
  • 20.
    4000 deaths in 5 days Each day: • 1,000 tonnes of smoke particles • 2,000 tonnes of carbon dioxide • 140 tonnes of hydrochloric acid • 370 tonnes of SO2 were converted into 800 tonnes of sulphuric acid. Image from Met Office
  • 21.
    UK Government response: Clean Air Acts of 1956 and 1968  “smokeless zones”, controls on industrial sources of pollution (tall chimneys for waste gas dispersal). 1997 National Air Quality Strategy set targets for 2005. 30% decrease since 1970 Excess deposition of SO2 in Europe (in tons/km2) European legislation: www.emep.int • controls pollution from industry and now transport • sets health limits for common air pollutants, including SO2, particulate matter, lead and NOx.
  • 22.
    Controls: Change fuel -coal and oil desulphurisation Change combustion - pressurised fluidised bed chambers - remove S as fuel burns Change emissions - flue gas desulphurisation CaCO3 + H2SO4 → CaSO4 + H2O + CO2 limestone gypsum
  • 23.
    Data from EuropeanEnvironment Agency, 2000. x1012 g S yr-1 Netherlands policy initiatives have sharply reduced SO2 emissions to the atmosphere Reference shows emissions at 1980 rate corrected for electricity generation
  • 24.
    The Water Qualitystory Nitrogen and phosphorus are essential nutrients for plants. Sources of phosphorus - agricultural fertilizers and pesticides, and wastewater treatment. Sources of nitrogen - fertilizers, intensive agriculture (NH3), wastewater, combustion processes (as NOx), including vehicle engines.
  • 25.
    What is thefate of N and P applied to land surface or released into the atmosphere? Rain washes nutrients into streams and rivers Nutrients enhance growth of aquatic plants Algal blooms die back when the nutrients are depleted Rotting algae consume all the dissolved oxygen in the water, causing eutrophication and ecosystem damage Photo courtesy of Stephanie Lindloff, River Alliance of Wisconsin.
  • 26.
    http://www.defra.gov.uk/environment/water/quality Water Quality andthe Law Important legislation affecting water policy (up to 2003) Safeguarding water supplies and their quality for now and the future is a vital task. It is a legal duty not to cause or allow water pollution, as well as an environmental and social responsibility. The Environmental Protection Act 1990 established statutory provisions for a range of environment protection purposes including integrated pollution control for dangerous processes. The Water Resources Act 1991 consolidated previous water legislation in respect of both the quality and quantity of water resources. The Water Industry Act 1991 consolidated legislation relating to the supply of water and the provision of sewerage services. The Environment Act 1995 established the Environment Agency, and introduced measures to enhance protection of the environment, including further powers for the prevention and remediation of water pollution. The EC Surface Water Abstraction Directives (75/440/EEC) set quality objectives for the surface water sources from which drinking water is taken. The EC Bathing Water Directive (76/160/EEC) sets standards aimed at protecting the health of bathers and maintaining the aesthetic quality of bathing waters. The EC Freshwater Fish (78/659/EEC) and Shellfish Waters Directives (79/923/EEC) are aimed at protecting the health of freshwater fish and shellfish populations, by designating waters in need of protection and setting quality standards for those waters. There is also a directive that aims to protect the health of consumers of shellfish by enforcing bacterial quality standards. The EC Dangerous Substances Directives (76/464/EEC), together with the Water Resources Act 1991, require control over inputs of dangerous substances into water. The EC Groundwater Directive (80/68/EEC) is related to the Dangerous Substances Directives and applies to groundwater protection. Groundwater is water held underground in rock formations. The EC Urban Waste Water Treatment Directive (91/271/EEC) sets requirements for the provision of collecting systems and the treatment of sewage according to the size of the discharge and the nature of the receiving water. The EC Nitrate Directive (91/676/EEC) requires member states to reduce the nitrate pollution in waters that arises from agricultural inputs.
  • 27.
    CSI report, 2005 Keypolicy question: Is eutrophication in European surface waters decreasing? Key message: There has been no general reduction in eutrophication (as measured by chlorophyll-a concentrations) since 1985. Chlorophyll-a concentrations have increased in a few coastal areas and decreased in others.
  • 28.
    What are thedifferences between the smog story and the water story? • Point source pollution • Diffuse source pollution • One major source • Multiple sources • Substitutes for coal • No substitution for N or P • Technology available at • No technological solution reasonable cost • Indirect impact on humans, • Direct and acute impact usually cumulative not on humans acute • Local impact • Often displaced impact
  • 29.
    What hope forWater Quality? EU Water Framework Directive It requires all inland and coastal water bodies to reach at least "good status" by 2015. It promises joined-up science and joined-up governance: • integration of surface/groundwater and quality/quantity. • linking management of water with other policy sectors that have an impact on the water environment.
  • 30.
    Stories of IrreversibleChanges - use of non-renewable resources Nauru (2,500 miles SW of Honolulu)
  • 31.
    Nauru’s phosphate miningstarted before 1900. For a period after it became a republic, in 1968, its per capita income was second only to Saudi Arabia’s. 90% of the island surface has been mined. By 2005, virtually all phosphate reserves were depleted. • The economy collapsed in the 1990s… notorious for money-laundering, now largely dependent on aid. • The island is widely regarded as an environmental wasteland… (no birds, food and water are imported) • The community has been struggling with weak governance and reduced wellbeing – rehabilitation of the island is difficult e.g., www.economist.com/node/11090649; CIA world factbook
  • 32.
    Would we beso foolish…? F o s s il f u e ls a n d the H ub b e rt P e a k Non-OPEC, non-FSU production has already peaked.
  • 33.
    Carrying capacity = the population level that can be supported, given the life infrastructure present (food, habitat, water and other resources) Carrying Capacity Resources } Population Sustainable (?) development time A little warning note – this concept needs care in application. Lots of literature explains why…
  • 34.
    Carrying capacity … Carrying Capacity Resources Population Too-rapid development time Recall earlier reference to Paul Ehrlich (IPAT) - http://dieoff.org/page112.htm Donella Meadows - http://www.sustainer.org/dhm_archive/ http://www.sustainer.org/dhm_archive/index.php?display_article=vn385npped
  • 35.
    Carrying Capacity …and Ecological Footprints Carrying Capacity Capacity Resources } - Footprint Population +ve or -ve? Sustainable (?) development time see pthbb.org/natural
  • 36.
    Copyright 1993 Watterson(Universal Press Syndicate)

Editor's Notes

  • #5 This is the Bretherton Diagram that summarises the international research strategy for Earth System Science developed in the 1980s. Since then, climate models and Earth observation programmes have been developed that include all these components.
  • #6 Our understanding of the environment has been built up from scientific insights from many different specialist fields of study.
  • #8 Many of Earth’s processes have now been significant perturbed by human activity.
  • #11 Sustainability science
  • #15 The PSR framework explicitly allows for the two-way interaction between nature and society, and it implies a cycle of adaptive/responsive change.
  • #16 Initial premise: human population growth has consequences. Population growth acoompanied by economic growth, and globalised economy (ease of communications and travel). Urbanisation, increased resource demand, cultural homogenisation?
  • #28 Most recent data still shows a mixed picture: http://www.eea.europa.eu/data-and-maps/figures/country-wise-ecosystem-damage-area-for-eutrophication-in-europe-1995-2010.