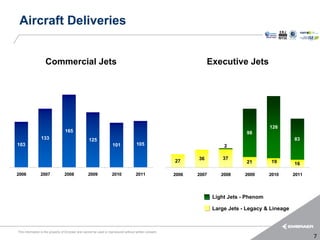
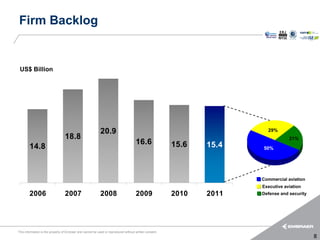
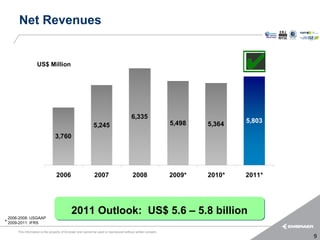
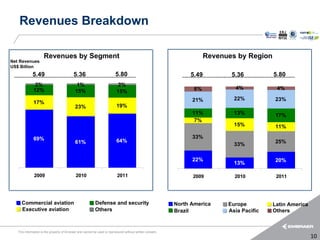
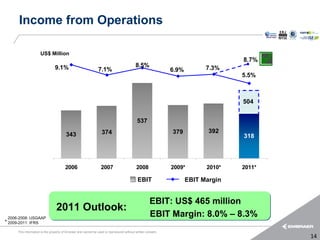
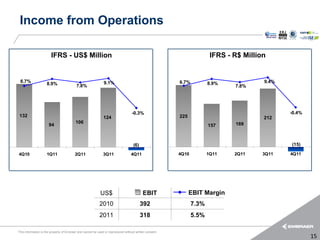
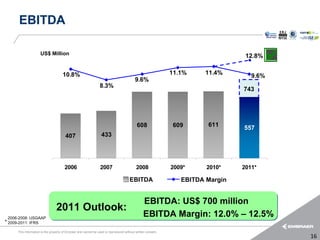
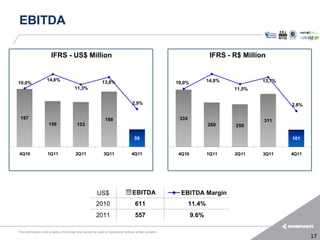
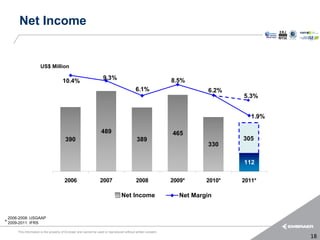
FY2011 Earnings Results


                March 21st, 2012
Forward Looking Statement


This presentation includes forward-looking statements or statements about events or
circumstances which have not occurred. We have based these forward-looking statements
largely on our current expectations and projections about future events and financial trends
affecting our business and our future financial performance. These forward-looking
statements are subject to risks, uncertainties and assumptions, including, among other things:
general economic, political and business conditions, both in Brazil and in our market. The
words “believes,” “may,” “will,” “estimates,” “continues,” “anticipates,” “intends,” “expects” and
similar words are intended to identify forward-looking statements. We undertake no
obligations to update publicly or revise any forward-looking statements because of new
information, future events or other factors. In light of these risks and uncertainties, the
forward-looking events and circumstances discussed in this presentation might not occur. Our
actual results could differ substantially from those anticipated in our forward-looking
statements.


  This information is the property of Embraer and cannot be used or reproduced without written consent.
                                                                                                          2
2011 Highlights


       • Delivery of 105 E-Jets in 2011 (32 in 4Q11), reaching 802 total
            deliveries since EIS.


      • Sale of 45 E-Jets in 4Q11 totaling 124 in 2011 (28% above 2010 sales),
           reaching 1,051 firm orders. Book to bill = 1


                                                                      • Increased presence with leasing companies
                                                                           (CIT, BOC Aviation, GECAS, Air Lease, CDB).


This information is the property of Embraer and cannot be used or reproduced without written consent.
                                                                                                                          3
2011 Highlights


• Delivery of 99 executive jets in 2011 (83 light jets and
     16 large jets). 50 jets delivered only in 4Q11.


                                                                                       • Global Customer Center opening in
                                                                                            Melbourne, FL and delivery of first
                                                                                            Phenom 100 made in the U.S.A.


                                     • Legacy 500 first prototype roll out.


                                                     • Globally renowned movie star Jackie Chan
                                                         joins Legacy 650 family.
This information is the property of Embraer and cannot be used or reproduced without written consent.
                                                                                                                                  4
2011 Highlights


                 • Modernization programs of AMX and A-4 Skyhawk on track.


                                                                          • AEW India program: maiden flight of the
                                                                               first of three aircraft in 4Q11.


       • KC-390 development program ongoing and on
           schedule. Selection of main suppliers.


                                 • Growth through acquisitions and partnerships.
                                                                                                                   JV Embraer/
                                                                                                          HARPIA     Telebrás

This information is the property of Embraer and cannot be used or reproduced without written consent.
                                                                                                                                 5
2011 Highlights


                     • Operational performance surpassed 2011 outlook.


                                             • Embraer elected for the 3rd consecutive year, one of
                                                  the best companies to work for in Brazil and for the
                                                  1st time in Florida.


                                                                 • Embraer selected as sector leader on the
                                                                     DJSI and also on the ISE.


This information is the property of Embraer and cannot be used or reproduced without written consent.
                                                                                                                          6
Aircraft Deliveries


                   Commercial Jets                                                                                  Executive Jets


                                                                                                                                            126
                                  165                                                                                              98
                133                                125                                                                                                83
103                                                                 101              105                                  2

                                                                                                               36         37
                                                                                                        27                         21        19       16

2006            2007             2008             2009              2010             2011               2006   2007      2008     2009      2010      2011


                                                                                                                      Light Jets - Phenom

                                                                                                                      Large Jets - Legacy & Lineage


This information is the property of Embraer and cannot be used or reproduced without written consent.
                                                                                                                                                             7
Firm Backlog


 US$ Billion


                                                           20.9                                                         29%
                                  18.8                                                                                            21%
                                                                                     16.6               15.6   15.4
        14.8                                                                                                          50%


                                                                                                                      Commercial aviation
                                                                                                                      Executive aviation
        2006                      2007                     2008                      2009               2010   2011   Defense and security


This information is the property of Embraer and cannot be used or reproduced without written consent.
                                                                                                                                             8
Net Revenues


                   US$ Million


                                                                                        6,335
                                                                                                              5,498           5,803
                                                            5,245                                                     5,364
                                3,760


                                 2006                        2007                        2008                 2009*   2010*   2011*


                                            2011 Outlook: US$ 5.6 – 5.8 billion
  2006-2008: USGAAP
* 2009-2011: IFRS
      This information is the property of Embraer and cannot be used or reproduced without written consent.
                                                                                                                                      9
Revenues Breakdown

                     Revenues by Segment                                                                               Revenues by Region
Net Revenues
US$ Billion
             5.49                          5.36                          5.80                                   5.49          5.36          5.80
               2%                            1%                            2%
              12%                                                                                                 6%           4%            4%
                                            15%                           15%
                                                                                                                 21%           22%          23%
              17%
                                            23%                           19%
                                                                                                                 11%           13%          17%
                                                                                                                  7%
                                                                                                                               15%          11%

              69%                                                                                                33%
                                            61%                           64%                                                               25%
                                                                                                                               33%

                                                                                                                 22%                        20%
                                                                                                                               13%

              2009                          2010                          2011                                   2009          2010          2011


     Commercial aviation                                  Defense and security                             North America     Europe         Latin America
     Executive aviation                                   Others                                           Brazil            Asia Pacific   Others


   This information is the property of Embraer and cannot be used or reproduced without written consent.
                                                                                                                                                            10
Net Revenues and Gross Margin

                        IFRS - US$ Million                                                                           IFRS - R$ Million


                                                                                     22.5%                                                       22.5%
                      24.3%                                                                                         24.3%
16.8%                                       22.4%            21.2%                                      16.8%                  22.4%   21.2%


                                                                                                                                               3,667
1,970                                                                            2,025                  3,342
                                         1,359               1,364                                                             2,169   2,266
                     1,056                                                                                          1,757


 4Q10                1Q11                2Q11                 3Q11                4Q11                  4Q10        1Q11       2Q11    3Q11    4Q11


                                                       US$                      Net Revenues                    Gross Margin
                                                      2010                           5,364                      19.1%
                                                      2011                           5,803                      22.5%

This information is the property of Embraer and cannot be used or reproduced without written consent.
                                                                                                                                                         11
SG&A Expenses

                        IFRS - US$ Million                                                                       IFRS - R$ Million

                                                                                  186
                                          173                 172                                                                      334
167
                     151                                                                                282              277     280
                                                                                   72                           252                    129
  61                                       64                  69
                       57                                                                               103              103     113
                                                                                                                 95


  106                                     109                 103                  114                                                 205
                       94                                                                               179              174     167
                                                                                                                 157


 4Q10                1Q11                2Q11                3Q11                 4Q11                  4Q10    1Q11     2Q11   3Q11   4Q11


                                                   US$                      G&A Expenses                  Selling Expenses
                                                  2010                               198                       374
                                                  2011                               262                       420

This information is the property of Embraer and cannot be used or reproduced without written consent.
                                                                                                                                              12
AMR Provisions and Additional Adjustments


 • American Airlines: US$ 317 million


 • Additional adjustments: US$ 43 million


 • Cancellations fees: US$ 67 million


                                                                                                                                         :
                                                                                                        Financial expenses           BIT act
                                                                                                                                    E p
                                                                                                        US$ 107 million               im
   2011 Results net impact                                                                                                         No

                   US$ 293 million                                                                      Other operating expenses
                                                                                                                                         :
                                                                                                                                      BIT t
                                                                                                                                     E ac
                                                                                                        US$ 186 million                p
                                                                                                                                     Im

This information is the property of Embraer and cannot be used or reproduced without written consent.
                                                                                                                                               13
Income from Operations

                      US$ Million
                                                                                                                                   8.7%
                                9.1%                                                       8.5%                            7.3%
                                                                7.1%                                          6.9%
                                                                                                                                   5.5%


                                                                                                                                   504


                                                                                            537
                                                                  374                                         379           392
                                        343                                                                                        318


                                        2006                      2007                     2008               2009*        2010*   2011*

                                                                                            EBIT                     EBIT Margin


                                                                                                     EBIT: US$ 465 million
                                 2011 Outlook:
 2006-2008: USGAAP
                                                                                                     EBIT Margin: 8.0% – 8.3%
* 2009-2011: IFRS
      This information is the property of Embraer and cannot be used or reproduced without written consent.
                                                                                                                                           14
Income from Operations

                        IFRS - US$ Million                                                                             IFRS - R$ Million


 6.7%                                                         9.1%                                      6.7%          8.9%             9.4%
                    8.9%                  7.8%                                                                                7.8%


                                                                                  -0.3%                                                       -0.4%
 132                                                          124                                       225                            212
                                         106                                                                                  169
                      94                                                                                              157


                                                                                   (6)                                                        (15)

4Q10                1Q11                 2Q11                3Q11                 4Q11                  4Q10          1Q11    2Q11     3Q11   4Q11


                                                           US$                            EBIT                EBIT Margin
                                                           2010                          392                   7.3%
                                                           2011                          318                   5.5%

This information is the property of Embraer and cannot be used or reproduced without written consent.
                                                                                                                                                      15
EBITDA

                      US$ Million                                                                                                 12.8%


                                      10.8%                                                                   11.1%    11.4%        9.6%
                                                                                          9.6%
                                                                 8.3%
                                                                                                                                 743


                                                                                            608                609      611      557
                                        407                       433


                                       2006                      2007                      2008               2009*     2010*    2011*

                                                                                       EBITDA                    EBITDA Margin


                                                                                                EBITDA: US$ 700 million
                                 2011 Outlook:
 2006-2008: USGAAP
                                                                                                EBITDA Margin: 12.0% – 12.5%
* 2009-2011: IFRS
      This information is the property of Embraer and cannot be used or reproduced without written consent.
                                                                                                                                           16
EBITDA

                        IFRS - US$ Million                                                                              IFRS - R$ Million


                    14,8%                                                                                              14,8%            13,7%
10,0%                                                        13,8%                                      10,0%
                                         11,3%                                                                                 11,5%

                                                                                  2,9%                                                          2,8%

 197                                                           188                                       335                            311
                      156                 153                                                                          260     250

                                                                                    59                                                          101


 4Q10                1Q11                2Q11                 3Q11                4Q11                  4Q10           1Q11    2Q11     3Q11    4Q11


                                                         US$                       EBITDA                 EBITDA Margin
                                                        2010                         611                       11.4%
                                                        2011                         557                        9.6%

This information is the property of Embraer and cannot be used or reproduced without written consent.
                                                                                                                                                       17
Net Income


                      US$ Million

                                      10.4%                        9.3%                                       8.5%
                                                                                           6.1%                           6.2%
                                                                                                                                 5.3%


                                                                                                                                    1.9%

                                                                  489                                         465
                                        390                                                 389                                  305
                                                                                                                          330

                                                                                                                                 112

                                       2006                      2007                      2008               2009*      2010*   2011*

                                                                                 Net Income                      Net Margin


 2006-2008: USGAAP
* 2009-2011: IFRS
      This information is the property of Embraer and cannot be used or reproduced without written consent.
                                                                                                                                           18
Net Income

                        IFRS - US$ Million                                                                             IFRS - R$ Million


                      10.0%                                                                                           9.9%
                                         7.1%                                                                                 7.1%
 6.2%                                                                                                   6.2%


  123                                                                                                   208
                      105                                                                                             174      154
                                           96                  0.1%                                                                        0.0%
                                                                 2                                                                     (0)
                                                                                  -4.5%                                                           -4.7%

                                                                                   (92)
                                                                                                                                                  (172)


 4Q10                1Q11                2Q11                 3Q11                4Q11                  4Q10          1Q11    2Q11     3Q11       4Q11


                                                           US$                    Net Income                  Net Margin
                                                           2010                         330                    6.2%
                                                           2011                         112                    1.9%

This information is the property of Embraer and cannot be used or reproduced without written consent.
                                                                                                                                                          19
EPADS and Pay Out


                   US$ Million
                                                                                                                                 115%
                                                              68%
                                       53%                                                52%
                                                                                                                        34%      35%
                                                                                                           26%


                                                             2.64                                          2.57
                                   2.11                                                2.14                                     1.68
                                                                                                                        1.83

                                                                                                                                0.62

                                   2006                      2007                      2008                2009*        2010*   2011*
                                                                                    EPADS                     Pay Out


* 2006-2008: US GAAP
 2009-2011: IFRS

   This information is the property of Embraer and cannot be used or reproduced without written consent.
                                                                                                                                        20
Inventories / Free Cash Flow

               Inventories - US$ Million                                                                       Free Cash Flow - US$ Million


                                                                                                                                                277
                                                                                                        193
                                                             2,872
                                         2,697
                    2,561
2,198                                                                            2,288
                                                                                                                           (38)
                                                                                                                  (126)                 (112)


 4Q10                1Q11                2Q11                3Q11                 4Q11                  4Q10       1Q11    2Q11         3Q11    4Q11


                      US$                                                                                         US$
                      2010                       2,198                                                            2010            287
                      2011                       2,288                                                            2011             1

This information is the property of Embraer and cannot be used or reproduced without written consent.
                                                                                                                                                       21
Indebtedness Profile Net Cash

                      Indebtedness Maturity                                                                      Net Cash - US$ Million


  5%                 10%                 13%                                      15%
                                                             26%
  6.3
                                           5.0                                     4.8
                       5.7                                      4.5


                                         87%                                                            692
                     90%                                                          85%
 95%                                                         74%
                                                                                                                   505
                                                                                                                           406              446

                                                                                                                                    193


 4Q10                1Q11                2Q11                3Q11                 4Q11                  4Q10       1Q11    2Q11    3Q11    4Q11


                Long-term      Short-term
                Loans Average Maturity (Years)


        Total Debt 4Q11: US$ 1.7 Billion                                                                      Total Cash 4Q11: US$ 2.1 Billion


This information is the property of Embraer and cannot be used or reproduced without written consent.
                                                                                                                                                  22
Investor Relations
                                                                                                          Phone: +55 12 3927 4404
                                                                                                        investor.relations@embraer.com.br

                                                                                                           www.embraer.com


This information is the property of Embraer and cannot be used or reproduced without written consent.

Embraer 4Q11 Results Presentation

  • 1.
    FY2011 Earnings Results March 21st, 2012
  • 2.
    Forward Looking Statement Thispresentation includes forward-looking statements or statements about events or circumstances which have not occurred. We have based these forward-looking statements largely on our current expectations and projections about future events and financial trends affecting our business and our future financial performance. These forward-looking statements are subject to risks, uncertainties and assumptions, including, among other things: general economic, political and business conditions, both in Brazil and in our market. The words “believes,” “may,” “will,” “estimates,” “continues,” “anticipates,” “intends,” “expects” and similar words are intended to identify forward-looking statements. We undertake no obligations to update publicly or revise any forward-looking statements because of new information, future events or other factors. In light of these risks and uncertainties, the forward-looking events and circumstances discussed in this presentation might not occur. Our actual results could differ substantially from those anticipated in our forward-looking statements. This information is the property of Embraer and cannot be used or reproduced without written consent. 2
  • 3.
    2011 Highlights • Delivery of 105 E-Jets in 2011 (32 in 4Q11), reaching 802 total deliveries since EIS. • Sale of 45 E-Jets in 4Q11 totaling 124 in 2011 (28% above 2010 sales), reaching 1,051 firm orders. Book to bill = 1 • Increased presence with leasing companies (CIT, BOC Aviation, GECAS, Air Lease, CDB). This information is the property of Embraer and cannot be used or reproduced without written consent. 3
  • 4.
    2011 Highlights • Deliveryof 99 executive jets in 2011 (83 light jets and 16 large jets). 50 jets delivered only in 4Q11. • Global Customer Center opening in Melbourne, FL and delivery of first Phenom 100 made in the U.S.A. • Legacy 500 first prototype roll out. • Globally renowned movie star Jackie Chan joins Legacy 650 family. This information is the property of Embraer and cannot be used or reproduced without written consent. 4
  • 5.
    2011 Highlights • Modernization programs of AMX and A-4 Skyhawk on track. • AEW India program: maiden flight of the first of three aircraft in 4Q11. • KC-390 development program ongoing and on schedule. Selection of main suppliers. • Growth through acquisitions and partnerships. JV Embraer/ HARPIA Telebrás This information is the property of Embraer and cannot be used or reproduced without written consent. 5
  • 6.
    2011 Highlights • Operational performance surpassed 2011 outlook. • Embraer elected for the 3rd consecutive year, one of the best companies to work for in Brazil and for the 1st time in Florida. • Embraer selected as sector leader on the DJSI and also on the ISE. This information is the property of Embraer and cannot be used or reproduced without written consent. 6
  • 7.
    Aircraft Deliveries Commercial Jets Executive Jets 126 165 98 133 125 83 103 101 105 2 36 37 27 21 19 16 2006 2007 2008 2009 2010 2011 2006 2007 2008 2009 2010 2011 Light Jets - Phenom Large Jets - Legacy & Lineage This information is the property of Embraer and cannot be used or reproduced without written consent. 7
  • 8.
    Firm Backlog US$Billion 20.9 29% 18.8 21% 16.6 15.6 15.4 14.8 50% Commercial aviation Executive aviation 2006 2007 2008 2009 2010 2011 Defense and security This information is the property of Embraer and cannot be used or reproduced without written consent. 8
  • 9.
    Net Revenues US$ Million 6,335 5,498 5,803 5,245 5,364 3,760 2006 2007 2008 2009* 2010* 2011* 2011 Outlook: US$ 5.6 – 5.8 billion 2006-2008: USGAAP * 2009-2011: IFRS This information is the property of Embraer and cannot be used or reproduced without written consent. 9
  • 10.
    Revenues Breakdown Revenues by Segment Revenues by Region Net Revenues US$ Billion 5.49 5.36 5.80 5.49 5.36 5.80 2% 1% 2% 12% 6% 4% 4% 15% 15% 21% 22% 23% 17% 23% 19% 11% 13% 17% 7% 15% 11% 69% 33% 61% 64% 25% 33% 22% 20% 13% 2009 2010 2011 2009 2010 2011 Commercial aviation Defense and security North America Europe Latin America Executive aviation Others Brazil Asia Pacific Others This information is the property of Embraer and cannot be used or reproduced without written consent. 10
  • 11.
    Net Revenues andGross Margin IFRS - US$ Million IFRS - R$ Million 22.5% 22.5% 24.3% 24.3% 16.8% 22.4% 21.2% 16.8% 22.4% 21.2% 3,667 1,970 2,025 3,342 1,359 1,364 2,169 2,266 1,056 1,757 4Q10 1Q11 2Q11 3Q11 4Q11 4Q10 1Q11 2Q11 3Q11 4Q11 US$ Net Revenues Gross Margin 2010 5,364 19.1% 2011 5,803 22.5% This information is the property of Embraer and cannot be used or reproduced without written consent. 11
  • 12.
    SG&A Expenses IFRS - US$ Million IFRS - R$ Million 186 173 172 334 167 151 282 277 280 72 252 129 61 64 69 57 103 103 113 95 106 109 103 114 205 94 179 174 167 157 4Q10 1Q11 2Q11 3Q11 4Q11 4Q10 1Q11 2Q11 3Q11 4Q11 US$ G&A Expenses Selling Expenses 2010 198 374 2011 262 420 This information is the property of Embraer and cannot be used or reproduced without written consent. 12
  • 13.
    AMR Provisions andAdditional Adjustments • American Airlines: US$ 317 million • Additional adjustments: US$ 43 million • Cancellations fees: US$ 67 million : Financial expenses BIT act E p US$ 107 million im 2011 Results net impact No US$ 293 million Other operating expenses : BIT t E ac US$ 186 million p Im This information is the property of Embraer and cannot be used or reproduced without written consent. 13
  • 14.
    Income from Operations US$ Million 8.7% 9.1% 8.5% 7.3% 7.1% 6.9% 5.5% 504 537 374 379 392 343 318 2006 2007 2008 2009* 2010* 2011* EBIT EBIT Margin EBIT: US$ 465 million 2011 Outlook: 2006-2008: USGAAP EBIT Margin: 8.0% – 8.3% * 2009-2011: IFRS This information is the property of Embraer and cannot be used or reproduced without written consent. 14
  • 15.
    Income from Operations IFRS - US$ Million IFRS - R$ Million 6.7% 9.1% 6.7% 8.9% 9.4% 8.9% 7.8% 7.8% -0.3% -0.4% 132 124 225 212 106 169 94 157 (6) (15) 4Q10 1Q11 2Q11 3Q11 4Q11 4Q10 1Q11 2Q11 3Q11 4Q11 US$ EBIT EBIT Margin 2010 392 7.3% 2011 318 5.5% This information is the property of Embraer and cannot be used or reproduced without written consent. 15
  • 16.
    EBITDA US$ Million 12.8% 10.8% 11.1% 11.4% 9.6% 9.6% 8.3% 743 608 609 611 557 407 433 2006 2007 2008 2009* 2010* 2011* EBITDA EBITDA Margin EBITDA: US$ 700 million 2011 Outlook: 2006-2008: USGAAP EBITDA Margin: 12.0% – 12.5% * 2009-2011: IFRS This information is the property of Embraer and cannot be used or reproduced without written consent. 16
  • 17.
    EBITDA IFRS - US$ Million IFRS - R$ Million 14,8% 14,8% 13,7% 10,0% 13,8% 10,0% 11,3% 11,5% 2,9% 2,8% 197 188 335 311 156 153 260 250 59 101 4Q10 1Q11 2Q11 3Q11 4Q11 4Q10 1Q11 2Q11 3Q11 4Q11 US$ EBITDA EBITDA Margin 2010 611 11.4% 2011 557 9.6% This information is the property of Embraer and cannot be used or reproduced without written consent. 17
  • 18.
    Net Income US$ Million 10.4% 9.3% 8.5% 6.1% 6.2% 5.3% 1.9% 489 465 390 389 305 330 112 2006 2007 2008 2009* 2010* 2011* Net Income Net Margin 2006-2008: USGAAP * 2009-2011: IFRS This information is the property of Embraer and cannot be used or reproduced without written consent. 18
  • 19.
    Net Income IFRS - US$ Million IFRS - R$ Million 10.0% 9.9% 7.1% 7.1% 6.2% 6.2% 123 208 105 174 154 96 0.1% 0.0% 2 (0) -4.5% -4.7% (92) (172) 4Q10 1Q11 2Q11 3Q11 4Q11 4Q10 1Q11 2Q11 3Q11 4Q11 US$ Net Income Net Margin 2010 330 6.2% 2011 112 1.9% This information is the property of Embraer and cannot be used or reproduced without written consent. 19
  • 20.
    EPADS and PayOut US$ Million 115% 68% 53% 52% 34% 35% 26% 2.64 2.57 2.11 2.14 1.68 1.83 0.62 2006 2007 2008 2009* 2010* 2011* EPADS Pay Out * 2006-2008: US GAAP 2009-2011: IFRS This information is the property of Embraer and cannot be used or reproduced without written consent. 20
  • 21.
    Inventories / FreeCash Flow Inventories - US$ Million Free Cash Flow - US$ Million 277 193 2,872 2,697 2,561 2,198 2,288 (38) (126) (112) 4Q10 1Q11 2Q11 3Q11 4Q11 4Q10 1Q11 2Q11 3Q11 4Q11 US$ US$ 2010 2,198 2010 287 2011 2,288 2011 1 This information is the property of Embraer and cannot be used or reproduced without written consent. 21
  • 22.
    Indebtedness Profile NetCash Indebtedness Maturity Net Cash - US$ Million 5% 10% 13% 15% 26% 6.3 5.0 4.8 5.7 4.5 87% 692 90% 85% 95% 74% 505 406 446 193 4Q10 1Q11 2Q11 3Q11 4Q11 4Q10 1Q11 2Q11 3Q11 4Q11 Long-term Short-term Loans Average Maturity (Years) Total Debt 4Q11: US$ 1.7 Billion Total Cash 4Q11: US$ 2.1 Billion This information is the property of Embraer and cannot be used or reproduced without written consent. 22
  • 23.
    Investor Relations Phone: +55 12 3927 4404 investor.relations@embraer.com.br www.embraer.com This information is the property of Embraer and cannot be used or reproduced without written consent.