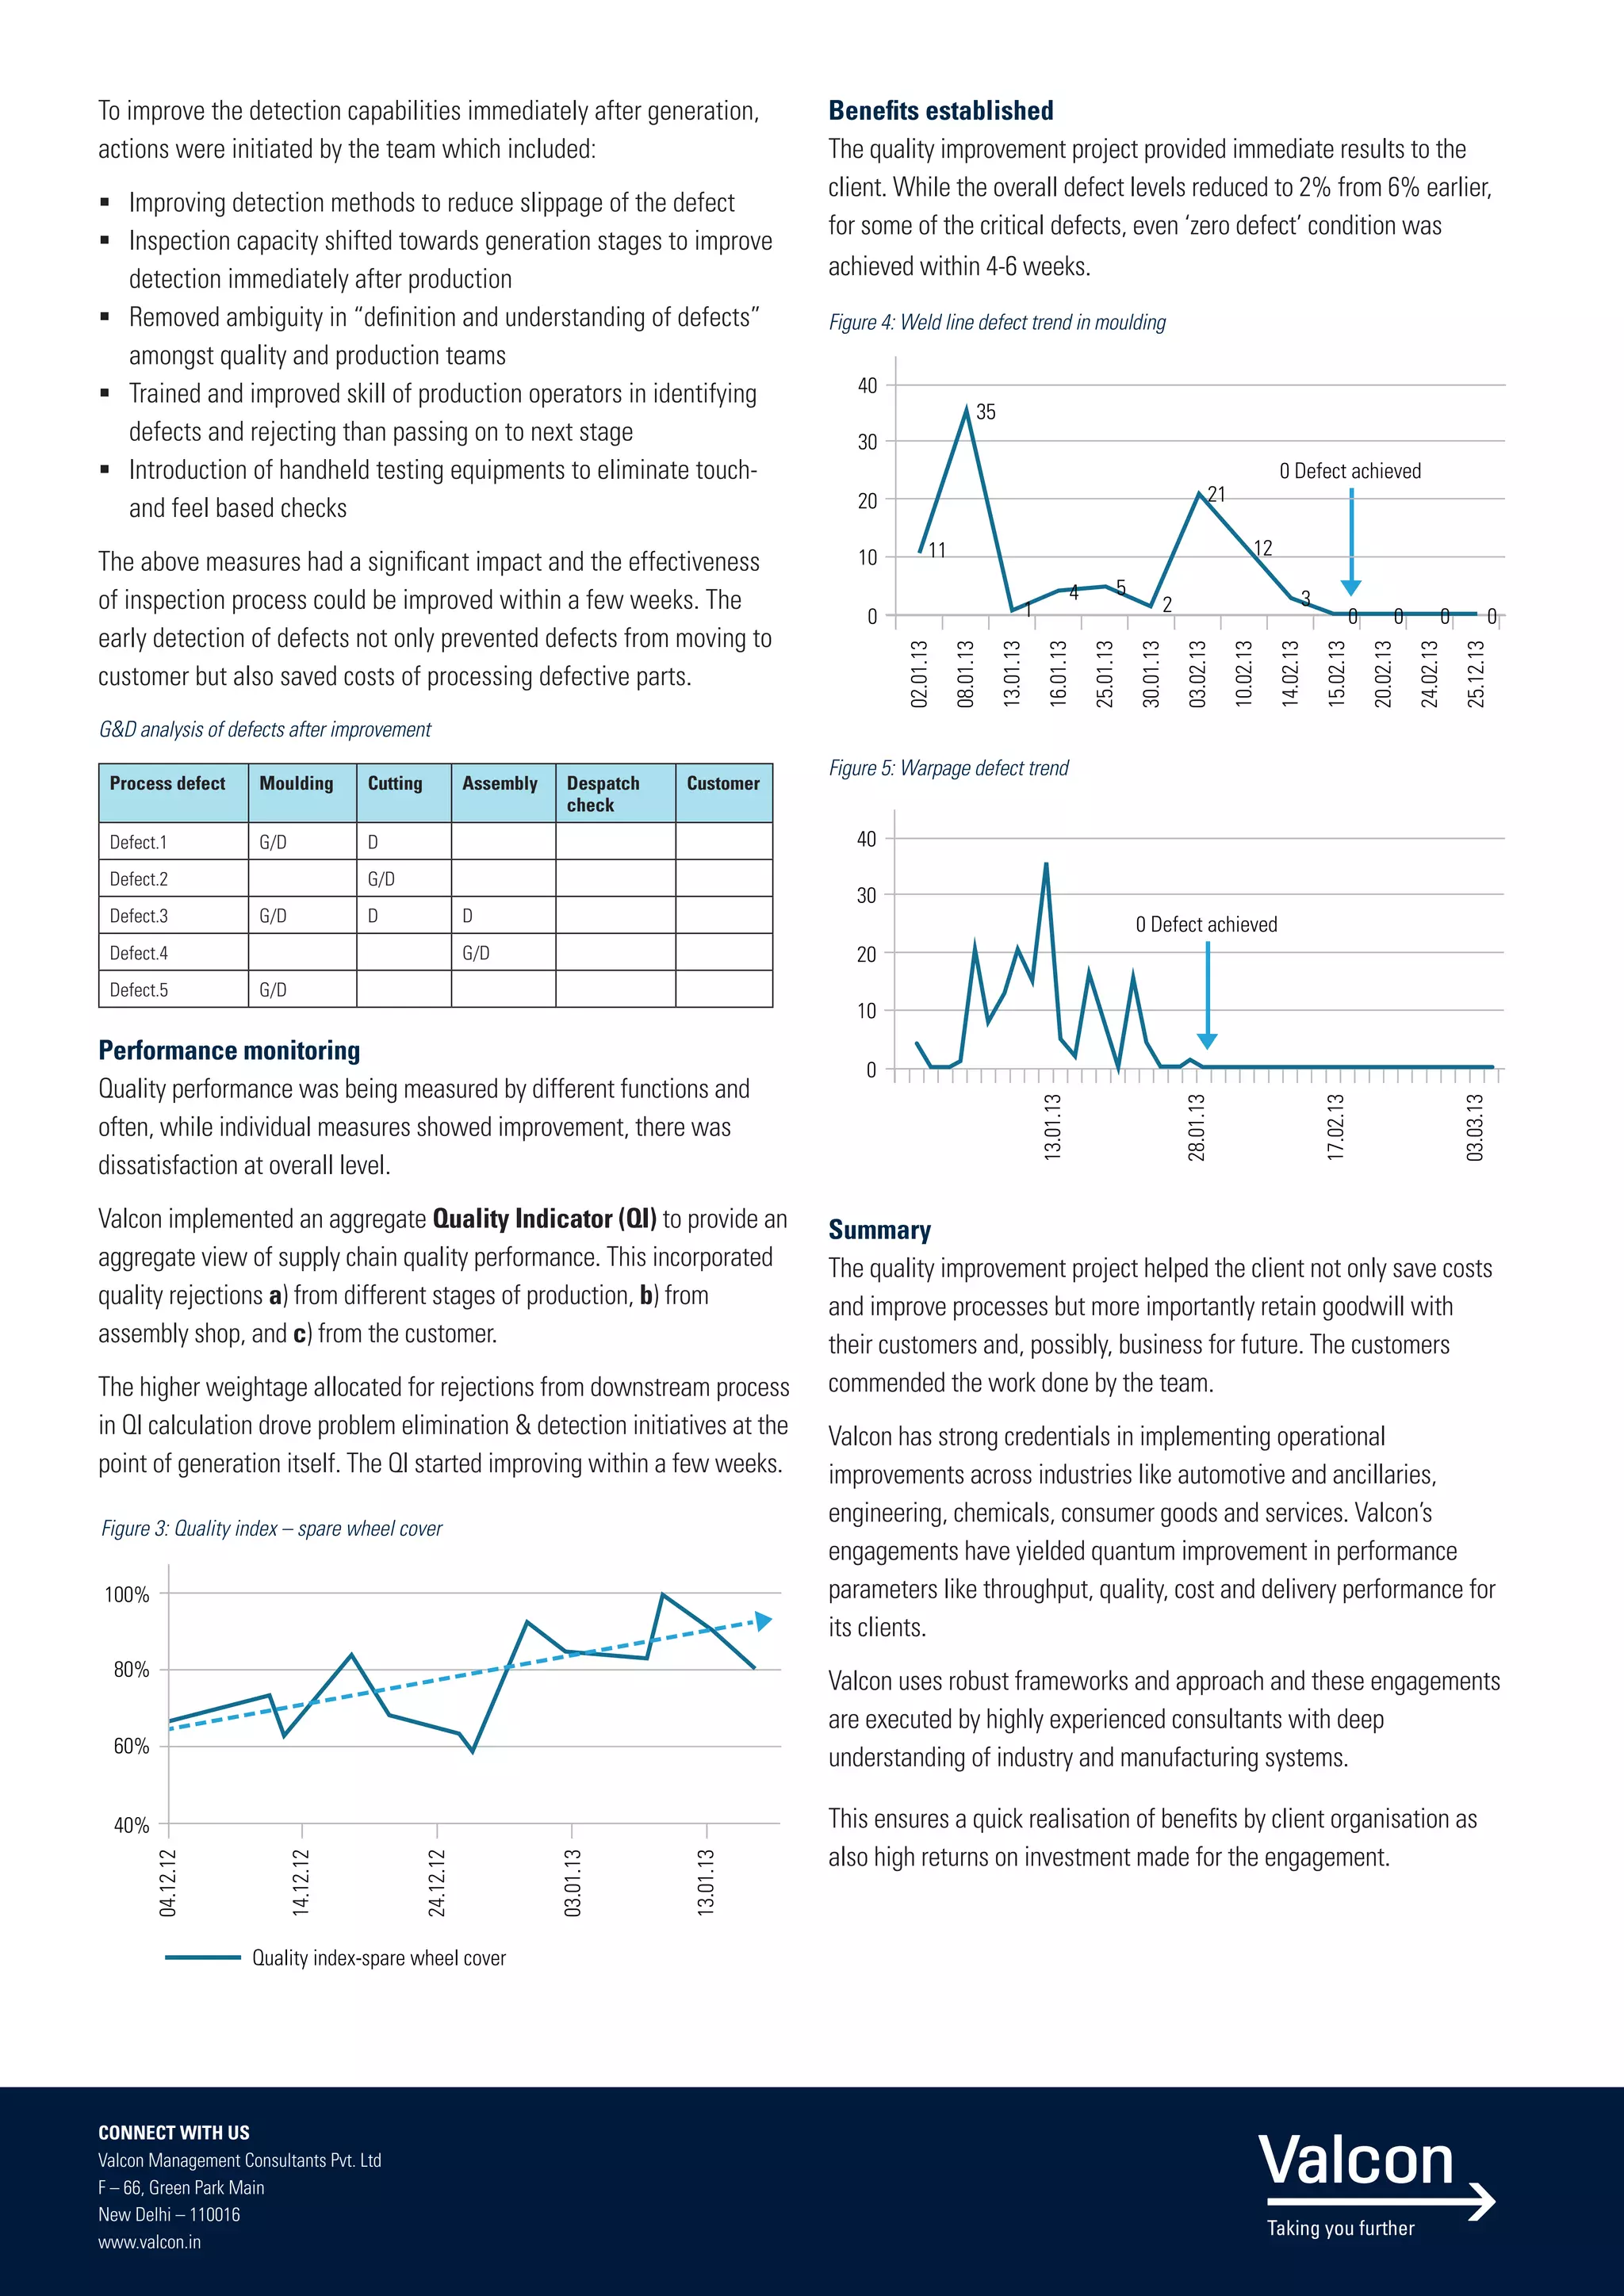
Valcon helped a plastic component manufacturer address quality defects that were impacting profitability and customer satisfaction. Valcon conducted a study of the manufacturing processes and quality systems, identifying issues with defect generation, inspection, and performance monitoring. They implemented process validation trials to optimize parameters, improved inspection methods, and created a quality index to track aggregate performance. These changes helped reduce defects from 6% to 2% within weeks, achieving zero defects for some critical issues, and improved relationships with customers.
1. Valcon helps a component manufacturer eliminate critical quality defects
to improve customer satisfaction
Business challenges
A moulded plastic component manufacturer and supplier to one of the
largest OEMs was facing a challenge of rejections due to poor quality.
This was affecting the plant performance in several ways:
ƒƒ As there were no re-working possibilities, this was impacting
profitability which was anyways quite low
ƒƒ Higher inventories had to be maintained to respond to unexpected
rejections
ƒƒ Loss of goodwill with customer
The OEM vehicle sales were in a growth phase and they were looking
at high reliability in suppliers to support them. Our client was not only
losing credibility but also faced the threat of losing business with OEM.
Valcon was invited to assist in improving processes to ensure high
quality performance.
How Valcon helped
Valcon conducted a detailed study of the manufacturing process as
well as the existing quality management systems to identify gaps and
improvement needs. These were structured around three broad areas for
deeper analysis and improvement
ƒƒ Defect generation
ƒƒ Defect identification (inspection)
ƒƒ Performance monitoring
Defect generation
For the critical defects identified, fishbone diagrams to identify high
level causes and areas were created. This was done in brainstorming
sessions along with members from production, quality, maintenance and
technical functions to utilise their knowledge and experience.
The cause analysis indicated areas for improvement and led to two kind
of initiatives:
Figure 1
Illustrative
MATERIAL MAN
Weld line problem
Wrong material
grade
Low injection speed
and pressure
Low injection speed
and pressure
Low melt and
barrel temperature
Hot runner
gate block
Air trap
Unbalanced
flow
Low melt and mould
temperature
METHOD MACHINE
i) Process validation
To identify the most appropriate values for process parameters, trials
were conducted by creating different combination of values.
The optimum set of parameter values was identified as the one which
was creating least rejections.
Figure 2: Defect rate with different process parameters
Defects
Trial number
** Defects/100 pieces produced
0%
40%
80%
120%
160%
200%
1 2 3 4 5 6 7 8 9 10 11 12
12 7
33
100 100
180
29
100
25
60
46
25
Once identified and validated, the process parameters levels were
incorporated in the quality manuals as well for standardisation.
ii) Process improvement
The cause analysis also indicated areas where specific actions were
required for improvement. An action list was generated with target
dates for completion to eliminate the root causes.
Defect Root cause Action
Weld line
ƒƒ Cooling line blockage breaks
nipple and causes variation
in temperature (act: 40~500
,
standard> 750
)
ƒƒ Nipple changed. 18th Jan
ƒƒ Nipple condition to be checked
once in a month. Included in mould
readiness check sheet
ƒƒ Variation in material weight
indicating improper material flow.
ƒƒ Circlip in the gate was found
missing causing O-ring damage
ƒƒ Circlip and O ring replaced. 13th Jan
ƒƒ O ring condition to be checked
once in a month. Included in mould
readiness check sheet
ƒƒ Cooling line blockage ƒƒ Air vent and flash correction in
mould. 10th Feb
Defect identification (inspection)
It was observed that while defects were being generated early in the
process, many of those pieces would pass on upto packing or even upto
customer’s end.
Valcon did a process defect Generation (G) and Detection (D)
Analysis which indicated that most of the defects were going
undetected – indicating poor effectiveness of the inspection systems.
G&D analysis of defects before improvement
Process defect Moulding Cutting Assembly Despatch
check
Customer
Defect.1 G/D D D D D
Defect.2 G D D
Defect.3 G/D D D D D
Defect.4 G/D D D
Defect.5 G D D D D
2. To improve the detection capabilities immediately after generation,
actions were initiated by the team which included:
ƒƒ Improving detection methods to reduce slippage of the defect
ƒƒ Inspection capacity shifted towards generation stages to improve
detection immediately after production
ƒƒ Removed ambiguity in “definition and understanding of defects”
amongst quality and production teams
ƒƒ Trained and improved skill of production operators in identifying
defects and rejecting than passing on to next stage
ƒƒ Introduction of handheld testing equipments to eliminate touch-
and feel based checks
The above measures had a significant impact and the effectiveness
of inspection process could be improved within a few weeks. The
early detection of defects not only prevented defects from moving to
customer but also saved costs of processing defective parts.
Benefits established
The quality improvement project provided immediate results to the
client. While the overall defect levels reduced to 2% from 6% earlier,
for some of the critical defects, even ‘zero defect’ condition was
achieved within 4-6 weeks.
G&D analysis of defects after improvement
Process defect Moulding Cutting Assembly Despatch
check
Customer
Defect.1 G/D D
Defect.2 G/D
Defect.3 G/D D D
Defect.4 G/D
Defect.5 G/D
Performance monitoring
Quality performance was being measured by different functions and
often, while individual measures showed improvement, there was
dissatisfaction at overall level.
Valcon implemented an aggregate Quality Indicator (QI) to provide an
aggregate view of supply chain quality performance. This incorporated
quality rejections a) from different stages of production, b) from
assembly shop, and c) from the customer.
The higher weightage allocated for rejections from downstream process
in QI calculation drove problem elimination & detection initiatives at the
point of generation itself. The QI started improving within a few weeks.
Figure 3: Quality index – spare wheel cover
Figure 4: Weld line defect trend in moulding
Figure 5: Warpage defect trend
0 Defect achieved
0
10
20
30
40
02.01.13
08.01.13
13.01.13
16.01.13
25.01.13
30.01.13
03.02.13
10.02.13
14.02.13
15.02.13
20.02.13
24.02.13
25.12.13
11
35
1
4 5
2
21
12
3
0 0 0 0
0 Defect achieved
0
10
20
30
40
13.01.13
28.01.13
17.02.13
03.03.13
Summary
The quality improvement project helped the client not only save costs
and improve processes but more importantly retain goodwill with
their customers and, possibly, business for future. The customers
commended the work done by the team.
Valcon has strong credentials in implementing operational
improvements across industries like automotive and ancillaries,
engineering, chemicals, consumer goods and services. Valcon’s
engagements have yielded quantum improvement in performance
parameters like throughput, quality, cost and delivery performance for
its clients.
Valcon uses robust frameworks and approach and these engagements
are executed by highly experienced consultants with deep
understanding of industry and manufacturing systems.
This ensures a quick realisation of benefits by client organisation as
also high returns on investment made for the engagement.
Quality index-spare wheel cover
40%
60%
80%
100%
04.12.12
14.12.12
24.12.12
03.01.13
13.01.13
CONNECT WITH US
Valcon Management Consultants Pvt. Ltd
F – 66, Green Park Main
New Delhi – 110016
www.valcon.in