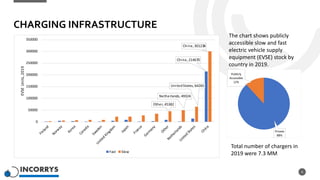
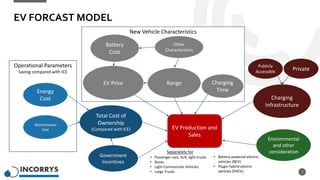
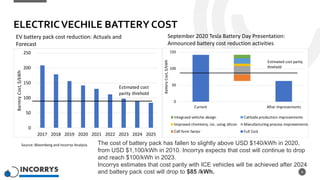
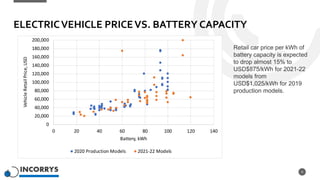
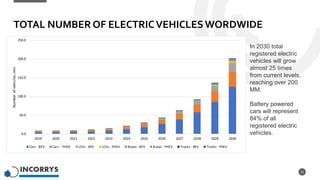
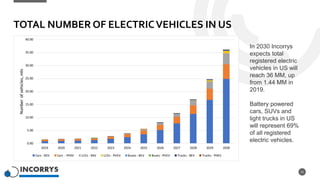
ELECTRIC
VEHICLES
INDUSTRY ANALYSIS AND FORECAST
FEBRUARY 2021
INTRODUCTION
Due to technology innovations battery cost is
expected gradually decline in next few years.
Incorrys expects that electric cars will reach cost
parity with gasoline cars in after 2024. It will lead
to significant growth in electric car production.
In 2030 global sales of electric vehicles will reach
38 million, 26% being sold in China.
In 2030 total registered electric vehicles are
expected to grow almost 25 times and reach
over 200 million.
2
ELECTRIC CAR STOCK PER COUNTRY
3
Norway, 223
US, 882
China, 2,581
China, 768
0
500
1000
1500
2000
2500
3000
Number
of
EV
per
Country,
Thousands
BEV PHEV
The chart shows number
of battery electric cars
(BEV)* and hybrid plug-
in electric cars* (PHEV)
in 2019.
China had 47% of all EV
in 2019 while US had
20%.
Total number of all EV
worldwide in 2019 was
7,170,000 up from
17,000 in 2010
Source: IEA Global EV Outlook 2020
* Includes SUVs and light trucks
ELECTRIC LIGHT COMMERCIALVEHICLES STOCK PER
COUNTRY
4
4 5 5 7 9 11
19 22
49
247
0
50
100
150
200
250
300
Sweden Netherlands US Norway Japan UK Others Germany France China
Number
of
ELCV
per
Country,
Thousands
The chart shows number
of battery and hybrid
plugin electric light
commercial vehicles in
2019.
China had 65% of all
electric light commercial
vehicles in 2019 while
US had 1%.
Total number of all EV
worldwide in 2019 was
378 thousands
Source: IEA Global EV Outlook 2020
MARKET SHARE OF NEW ELECTRICVEHICLES
5
Market share is defined as the share of new EV
registrations as a percentage of total new
vehicle registrations
Netherlands, 14%
Norway, 42%
Sweden, 7%
Norway, 14%
0%
5%
10%
15%
20%
25%
30%
35%
40%
45%
Market
Share,
%
BEV PHEV
In 2019, 9 countries had more
than 100 000 electric cars on
the road. At least 20 countries
had EV market shares above
1%
Incorrys estimates that in 2020
the total passenger car market
will contract by 12% over the
year relative to 2019.
However, EV and PHEV will
remain flat compared to 2019
levels.
CHARGING INFRASTRUCTURE
6
Other, 45382
Netherlands, 49324
UnitedStates, 64265
China, 301238
China, 214670
0
50000
100000
150000
200000
250000
300000
350000
EVSE
Units,
2019
Fast Slow
The chart shows publicly
accessible slow and fast
electric vehicle supply
equipment (EVSE) stock by
country in 2019.
Private
88%
Publicly
Accessible
12%
Total number of chargers in
2019 were 7.3 MM
EV FORCAST MODEL
7
EV Production and
Sales
New Vehicle Characteristics
EV Price Range Charging
Time
Operational Parameters
Saving compared with ICE
Energy
Cost
Maintenance
Cost
Total Cost of
Ownership
(Compared with ICE)
Government
Incentives
Charging
Infrastructure
Environmental
and other
consideration
Battery
Cost
Other
Characteristics
Publicly
Accessible
Private
Separately for
• Passenger cars, SUV, light trucks
• Buses
• Light Commercials Vehicles
• Large Trucks
• Battery-powered electric
vehicles (BEV)
• Plugin hybrid electric
vehicles (PHEV)
ELECTRICVECHILE BATTERY COST
8
Source: Bloomberg and Incorrys Analysis
September 2020 Tesla Battery Day Presentation:
Announced battery cost reduction activities
EV battery pack cost reduction: Actuals and
Forecast
The cost of battery pack has fallen to slightly above USD $140/kWh in 2020,
from USD $1,100/kWh in 2010. Incorrys expects that cost will continue to drop
and reach $100/kWh in 2023.
Incorrys estimates that cost parity with ICE vehicles will be achieved after 2024
and battery pack cost will drop to $85 /kWh.
0
50
100
150
200
250
2017 2018 2019 2020 2021 2022 2023 2024 2025
Barrery
Cost,
$/kWh
Estimated cost
parity threhold
0
50
100
150
Current After Improvements
Battery
Cost,
$/kWh
Integraed vehiche design Cathode production improvements
Improved chemistry, inc. using silicon Manufacturing process improvements
Cell form factor Full Cost
Estimated cost parity
threhold
ELECTRICVEHICLE PRICEVS. BATTERY CAPACITY
9
0
20,000
40,000
60,000
80,000
100,000
120,000
140,000
160,000
180,000
200,000
0 20 40 60 80 100 120 140
Vehicle
Retail
Price,
USD
Battery, kWh
2020 Production Models 2021-22 Models
Retail car price per kWh of
battery capacity is expected
to drop almost 15% to
USD$875/kWh for 2021-22
models from
USD$1,025/kWh for 2019
production models.
ELECTRICVEHICLE PRICEVS. RANGE
10
0
20,000
40,000
60,000
80,000
100,000
120,000
140,000
160,000
180,000
200,000
0 100 200 300 400 500 600
Retail
Vehicle
Price,
USD
Range on one charge, km
2020 Production Models 2021-22 Models
Average retail price of
electric vehicle per km of
range is expected to fall
16% from USD$177/km
in 2020 to USD$211/km
in 2021-22,
Average range of 2021-
2022 vehicles will
increase to almost 400
km up from 310 km in
2020.
CHANGINGTIME FOR ELECTRICVEHICLES
11
Charger Type Electric Car Range added
AC Level 1
240V 2-3kW
Up to 15km/hour
AC Level 2 “Wall Charger”
240V 7KW
Up to 40km/hour
AC Level 2 “Destination Charger”
415V 11-22kW
60-120km/hour
DC Fast Charger
50kW DC Fast Charger
Around 40km/10 min
DC Rapid Charger
175kW DC Fast Charger
Around 200km/ 15 min
Source: thedriven.io
Changing time for electric vehicles
is measured by range added by
hour of charging.
0
100
200
300
400
500
600
2020 Models 2021-22 Models
Average
Charging
Time,
h/km
30% increase
Charging time is determined by charger type as well as electric vehicle
hardware.
ELECTRICVEHICLE EFFICIENCY
12
0
20,000
40,000
60,000
80,000
100,000
120,000
140,000
160,000
180,000
200,000
100 150 200 250 300
Vehicle
Retail
Price,
USD
Efficiency, Wh/km
2020 Production Models 2021-22 Models
Electric vehicle average
efficiency is expected to
stay flat for 2021-22
model compared to 2020
models at around 192
Wh/km.
As average range of new
vehicles increases,
average retail price of
electric vehicle per unit
of efficiency is expected
to increase to USD$366
per Wh/km in 2021-22
from USD$336 per
Wh/km in 2020.
TOTAL NUMBER OF ELECTRICVEHICLESWORDWIDE
13
0.0
50.0
100.0
150.0
200.0
250.0
2019 2020 2021 2022 2023 2024 2025 2026 2027 2028 2029 2030
Number
of
vehicles,
mln
Cars - BEV Cars - PHEV LCVs - BEV LCVs - PHEV Buses - BEV Buses - PHEV Trucks - BEV Trucks - PHEV
In 2030 total
registered electric
vehicles will grow
almost 25 times
from current levels,
reaching over 200
MM.
Battery powered
cars will represent
84% of all
registered electric
vehicles.
ANNUAL EV SALES
14
0
2
4
6
8
10
12
14
China Europe US India Japan Others
Production
of
new
vehicles
in
2030,
mln
In 2030, global sales of electric vehicles will
reach 38 MM with China accounting for the
largest share at 30% of sales.
China
30%
Europe
18%
US
12%
India
9%
Japan
5%
Others
26%
China Europe US India Japan Others
TOTAL NUMBER OF ELECTRICVEHICLES IN US
15
In 2030 Incorrys
expects total
registered electric
vehicles in US will
reach 36 MM, up
from 1.44 MM in
2019.
Battery powered
cars, SUVs and
light trucks in US
will represent 69%
of all registered
electric vehicles.
0.00
5.00
10.00
15.00
20.00
25.00
30.00
35.00
40.00
2019 2020 2021 2022 2023 2024 2025 2026 2027 2028 2029 2030
Number
of
vehicles,
mln
Cars - BEV Cars - PHEV LCVs - BEV LCVs - PHEV Buses - BEV Buses - PHEV Trucks - BEV Trucks - PHEV
THANKYOU !
SALES@INCORRYS.COM
HTTP://WWW.INCORRYS.COM/

Electric Vehicles: Industry Analysis and Forecast

  • 1.
  • 2.
    INTRODUCTION Due to technologyinnovations battery cost is expected gradually decline in next few years. Incorrys expects that electric cars will reach cost parity with gasoline cars in after 2024. It will lead to significant growth in electric car production. In 2030 global sales of electric vehicles will reach 38 million, 26% being sold in China. In 2030 total registered electric vehicles are expected to grow almost 25 times and reach over 200 million. 2
  • 3.
    ELECTRIC CAR STOCKPER COUNTRY 3 Norway, 223 US, 882 China, 2,581 China, 768 0 500 1000 1500 2000 2500 3000 Number of EV per Country, Thousands BEV PHEV The chart shows number of battery electric cars (BEV)* and hybrid plug- in electric cars* (PHEV) in 2019. China had 47% of all EV in 2019 while US had 20%. Total number of all EV worldwide in 2019 was 7,170,000 up from 17,000 in 2010 Source: IEA Global EV Outlook 2020 * Includes SUVs and light trucks
  • 4.
    ELECTRIC LIGHT COMMERCIALVEHICLESSTOCK PER COUNTRY 4 4 5 5 7 9 11 19 22 49 247 0 50 100 150 200 250 300 Sweden Netherlands US Norway Japan UK Others Germany France China Number of ELCV per Country, Thousands The chart shows number of battery and hybrid plugin electric light commercial vehicles in 2019. China had 65% of all electric light commercial vehicles in 2019 while US had 1%. Total number of all EV worldwide in 2019 was 378 thousands Source: IEA Global EV Outlook 2020
  • 5.
    MARKET SHARE OFNEW ELECTRICVEHICLES 5 Market share is defined as the share of new EV registrations as a percentage of total new vehicle registrations Netherlands, 14% Norway, 42% Sweden, 7% Norway, 14% 0% 5% 10% 15% 20% 25% 30% 35% 40% 45% Market Share, % BEV PHEV In 2019, 9 countries had more than 100 000 electric cars on the road. At least 20 countries had EV market shares above 1% Incorrys estimates that in 2020 the total passenger car market will contract by 12% over the year relative to 2019. However, EV and PHEV will remain flat compared to 2019 levels.
  • 6.
    CHARGING INFRASTRUCTURE 6 Other, 45382 Netherlands,49324 UnitedStates, 64265 China, 301238 China, 214670 0 50000 100000 150000 200000 250000 300000 350000 EVSE Units, 2019 Fast Slow The chart shows publicly accessible slow and fast electric vehicle supply equipment (EVSE) stock by country in 2019. Private 88% Publicly Accessible 12% Total number of chargers in 2019 were 7.3 MM
  • 7.
    EV FORCAST MODEL 7 EVProduction and Sales New Vehicle Characteristics EV Price Range Charging Time Operational Parameters Saving compared with ICE Energy Cost Maintenance Cost Total Cost of Ownership (Compared with ICE) Government Incentives Charging Infrastructure Environmental and other consideration Battery Cost Other Characteristics Publicly Accessible Private Separately for • Passenger cars, SUV, light trucks • Buses • Light Commercials Vehicles • Large Trucks • Battery-powered electric vehicles (BEV) • Plugin hybrid electric vehicles (PHEV)
  • 8.
    ELECTRICVECHILE BATTERY COST 8 Source:Bloomberg and Incorrys Analysis September 2020 Tesla Battery Day Presentation: Announced battery cost reduction activities EV battery pack cost reduction: Actuals and Forecast The cost of battery pack has fallen to slightly above USD $140/kWh in 2020, from USD $1,100/kWh in 2010. Incorrys expects that cost will continue to drop and reach $100/kWh in 2023. Incorrys estimates that cost parity with ICE vehicles will be achieved after 2024 and battery pack cost will drop to $85 /kWh. 0 50 100 150 200 250 2017 2018 2019 2020 2021 2022 2023 2024 2025 Barrery Cost, $/kWh Estimated cost parity threhold 0 50 100 150 Current After Improvements Battery Cost, $/kWh Integraed vehiche design Cathode production improvements Improved chemistry, inc. using silicon Manufacturing process improvements Cell form factor Full Cost Estimated cost parity threhold
  • 9.
    ELECTRICVEHICLE PRICEVS. BATTERYCAPACITY 9 0 20,000 40,000 60,000 80,000 100,000 120,000 140,000 160,000 180,000 200,000 0 20 40 60 80 100 120 140 Vehicle Retail Price, USD Battery, kWh 2020 Production Models 2021-22 Models Retail car price per kWh of battery capacity is expected to drop almost 15% to USD$875/kWh for 2021-22 models from USD$1,025/kWh for 2019 production models.
  • 10.
    ELECTRICVEHICLE PRICEVS. RANGE 10 0 20,000 40,000 60,000 80,000 100,000 120,000 140,000 160,000 180,000 200,000 0100 200 300 400 500 600 Retail Vehicle Price, USD Range on one charge, km 2020 Production Models 2021-22 Models Average retail price of electric vehicle per km of range is expected to fall 16% from USD$177/km in 2020 to USD$211/km in 2021-22, Average range of 2021- 2022 vehicles will increase to almost 400 km up from 310 km in 2020.
  • 11.
    CHANGINGTIME FOR ELECTRICVEHICLES 11 ChargerType Electric Car Range added AC Level 1 240V 2-3kW Up to 15km/hour AC Level 2 “Wall Charger” 240V 7KW Up to 40km/hour AC Level 2 “Destination Charger” 415V 11-22kW 60-120km/hour DC Fast Charger 50kW DC Fast Charger Around 40km/10 min DC Rapid Charger 175kW DC Fast Charger Around 200km/ 15 min Source: thedriven.io Changing time for electric vehicles is measured by range added by hour of charging. 0 100 200 300 400 500 600 2020 Models 2021-22 Models Average Charging Time, h/km 30% increase Charging time is determined by charger type as well as electric vehicle hardware.
  • 12.
    ELECTRICVEHICLE EFFICIENCY 12 0 20,000 40,000 60,000 80,000 100,000 120,000 140,000 160,000 180,000 200,000 100 150200 250 300 Vehicle Retail Price, USD Efficiency, Wh/km 2020 Production Models 2021-22 Models Electric vehicle average efficiency is expected to stay flat for 2021-22 model compared to 2020 models at around 192 Wh/km. As average range of new vehicles increases, average retail price of electric vehicle per unit of efficiency is expected to increase to USD$366 per Wh/km in 2021-22 from USD$336 per Wh/km in 2020.
  • 13.
    TOTAL NUMBER OFELECTRICVEHICLESWORDWIDE 13 0.0 50.0 100.0 150.0 200.0 250.0 2019 2020 2021 2022 2023 2024 2025 2026 2027 2028 2029 2030 Number of vehicles, mln Cars - BEV Cars - PHEV LCVs - BEV LCVs - PHEV Buses - BEV Buses - PHEV Trucks - BEV Trucks - PHEV In 2030 total registered electric vehicles will grow almost 25 times from current levels, reaching over 200 MM. Battery powered cars will represent 84% of all registered electric vehicles.
  • 14.
    ANNUAL EV SALES 14 0 2 4 6 8 10 12 14 ChinaEurope US India Japan Others Production of new vehicles in 2030, mln In 2030, global sales of electric vehicles will reach 38 MM with China accounting for the largest share at 30% of sales. China 30% Europe 18% US 12% India 9% Japan 5% Others 26% China Europe US India Japan Others
  • 15.
    TOTAL NUMBER OFELECTRICVEHICLES IN US 15 In 2030 Incorrys expects total registered electric vehicles in US will reach 36 MM, up from 1.44 MM in 2019. Battery powered cars, SUVs and light trucks in US will represent 69% of all registered electric vehicles. 0.00 5.00 10.00 15.00 20.00 25.00 30.00 35.00 40.00 2019 2020 2021 2022 2023 2024 2025 2026 2027 2028 2029 2030 Number of vehicles, mln Cars - BEV Cars - PHEV LCVs - BEV LCVs - PHEV Buses - BEV Buses - PHEV Trucks - BEV Trucks - PHEV
  • 16.