Download as PPSX, PPTX

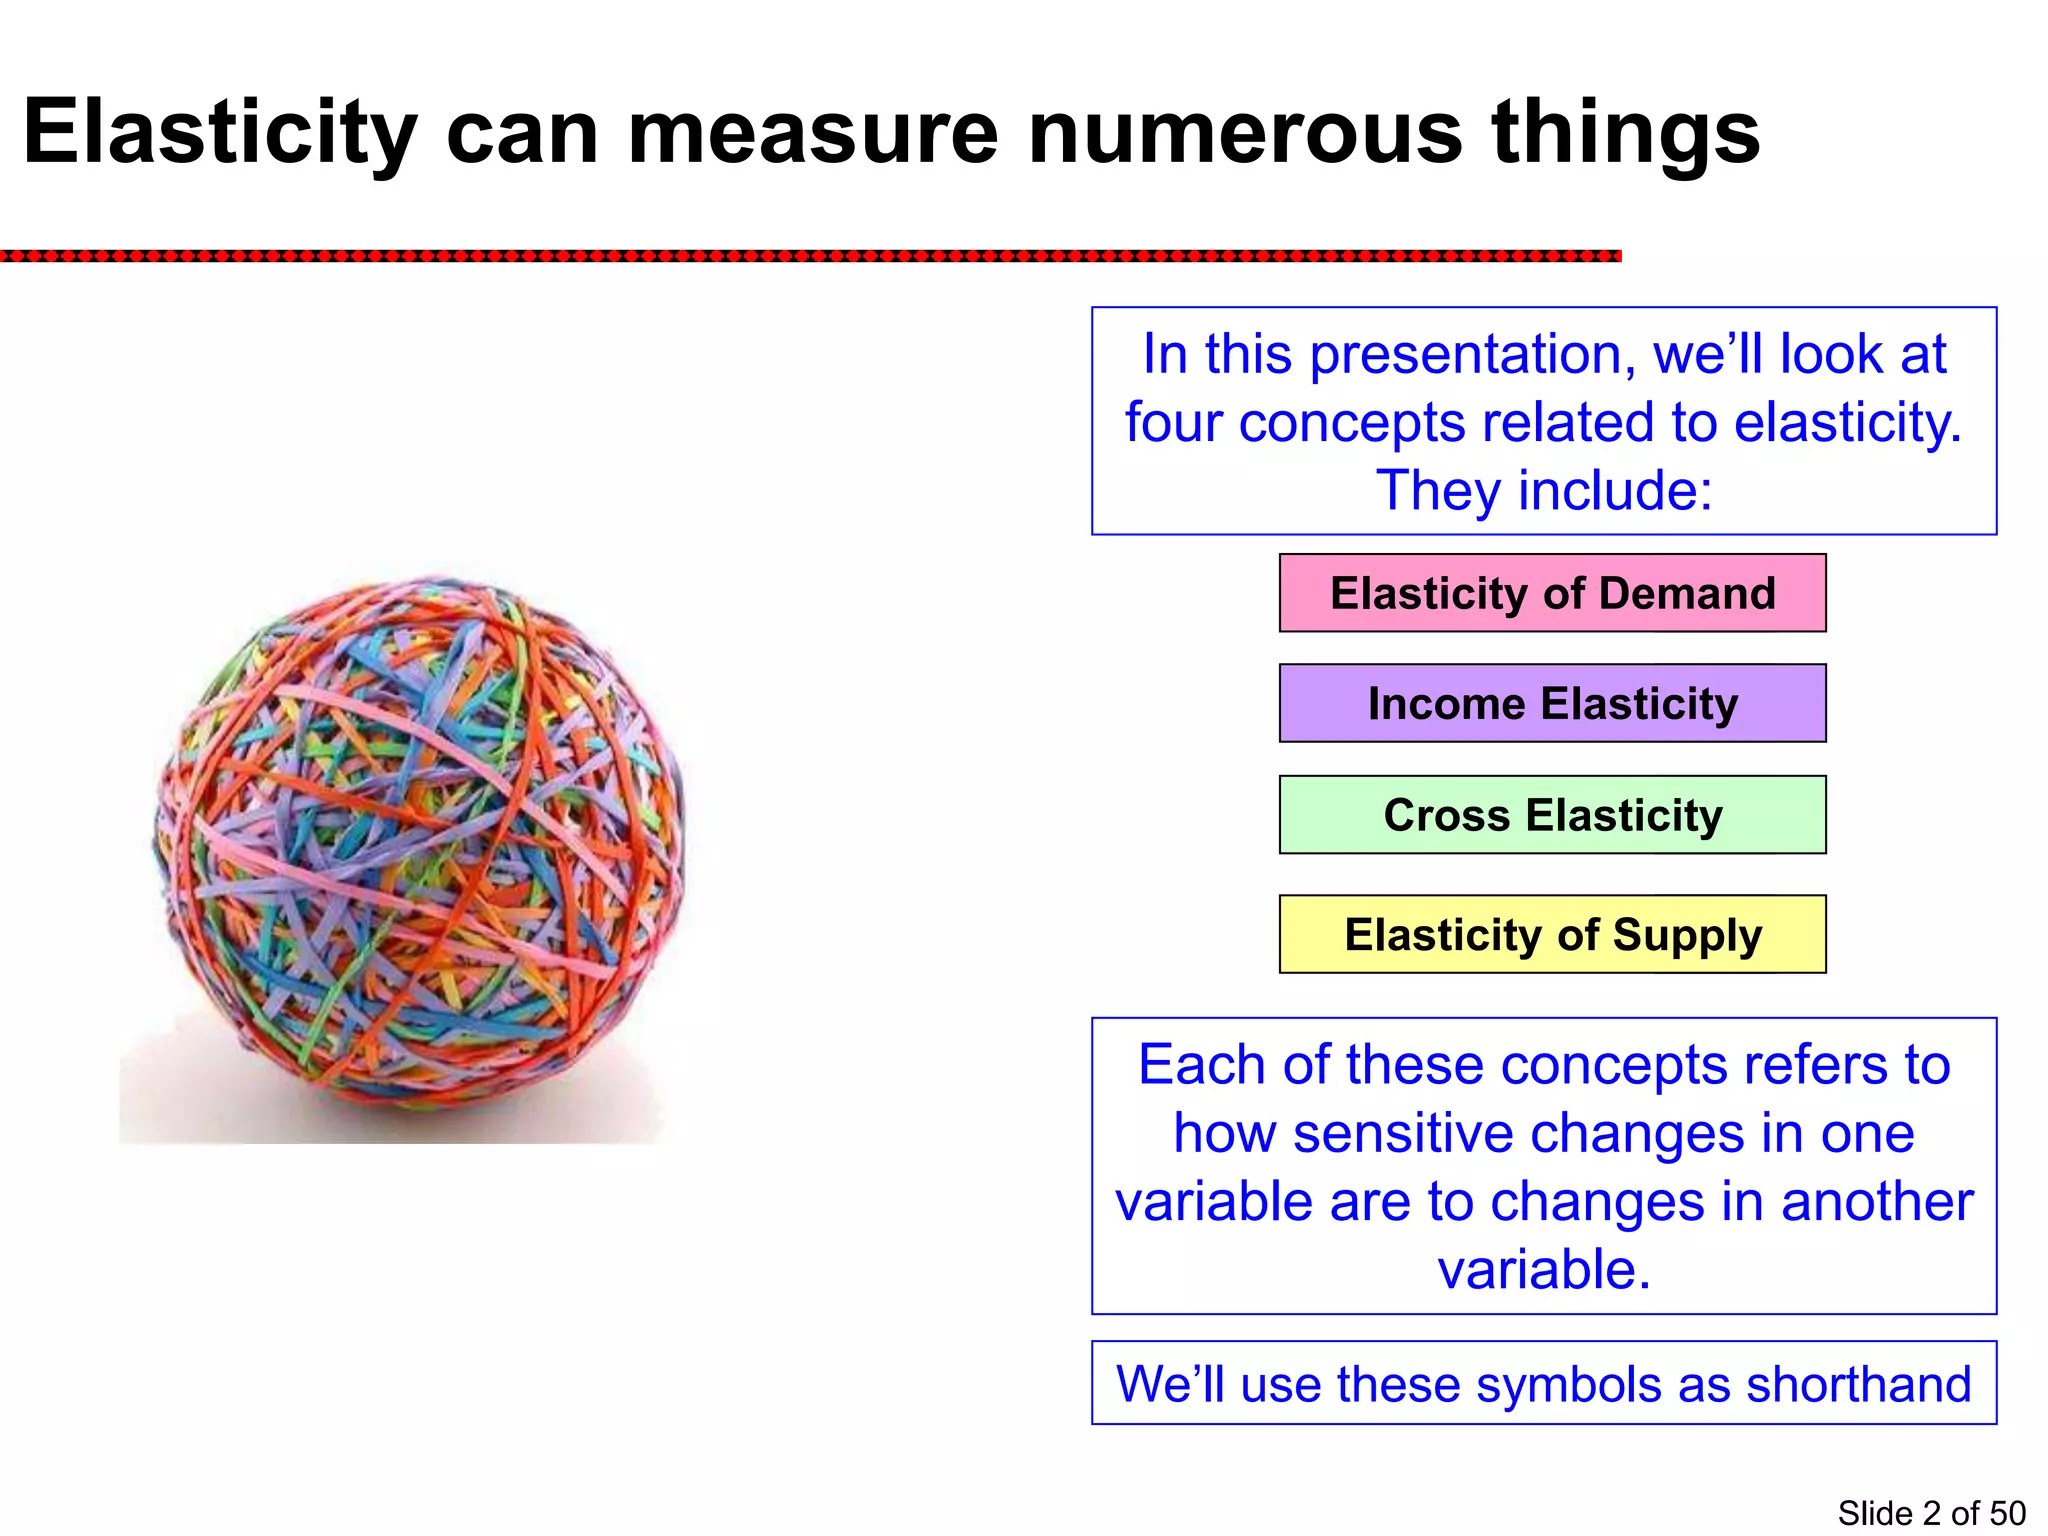
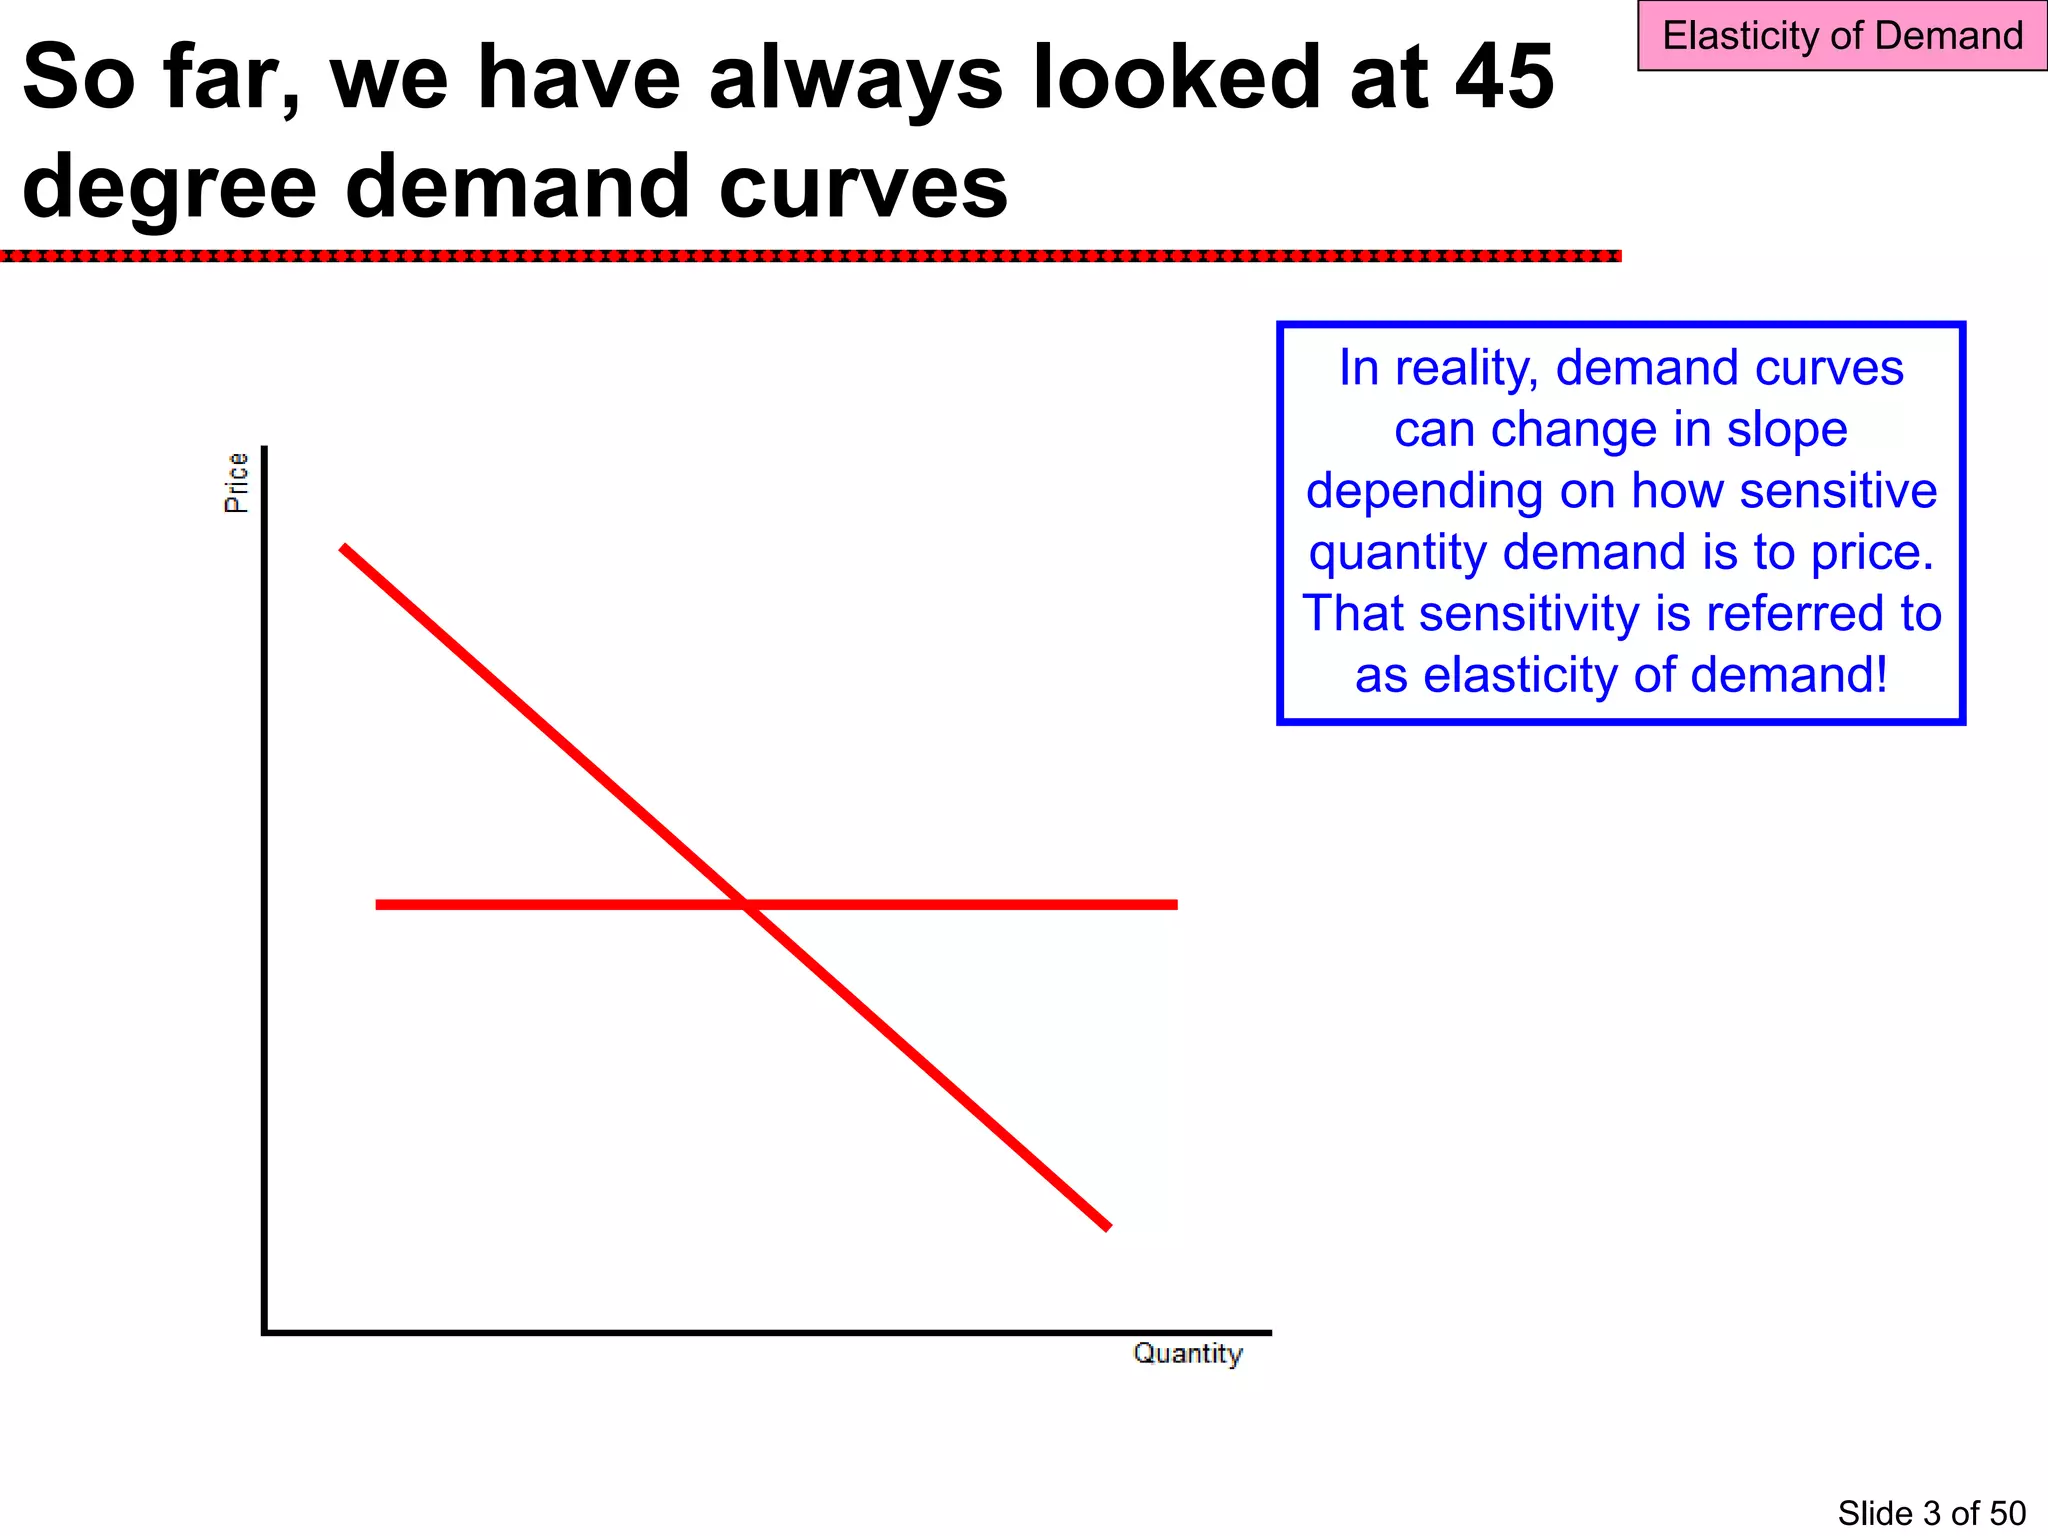
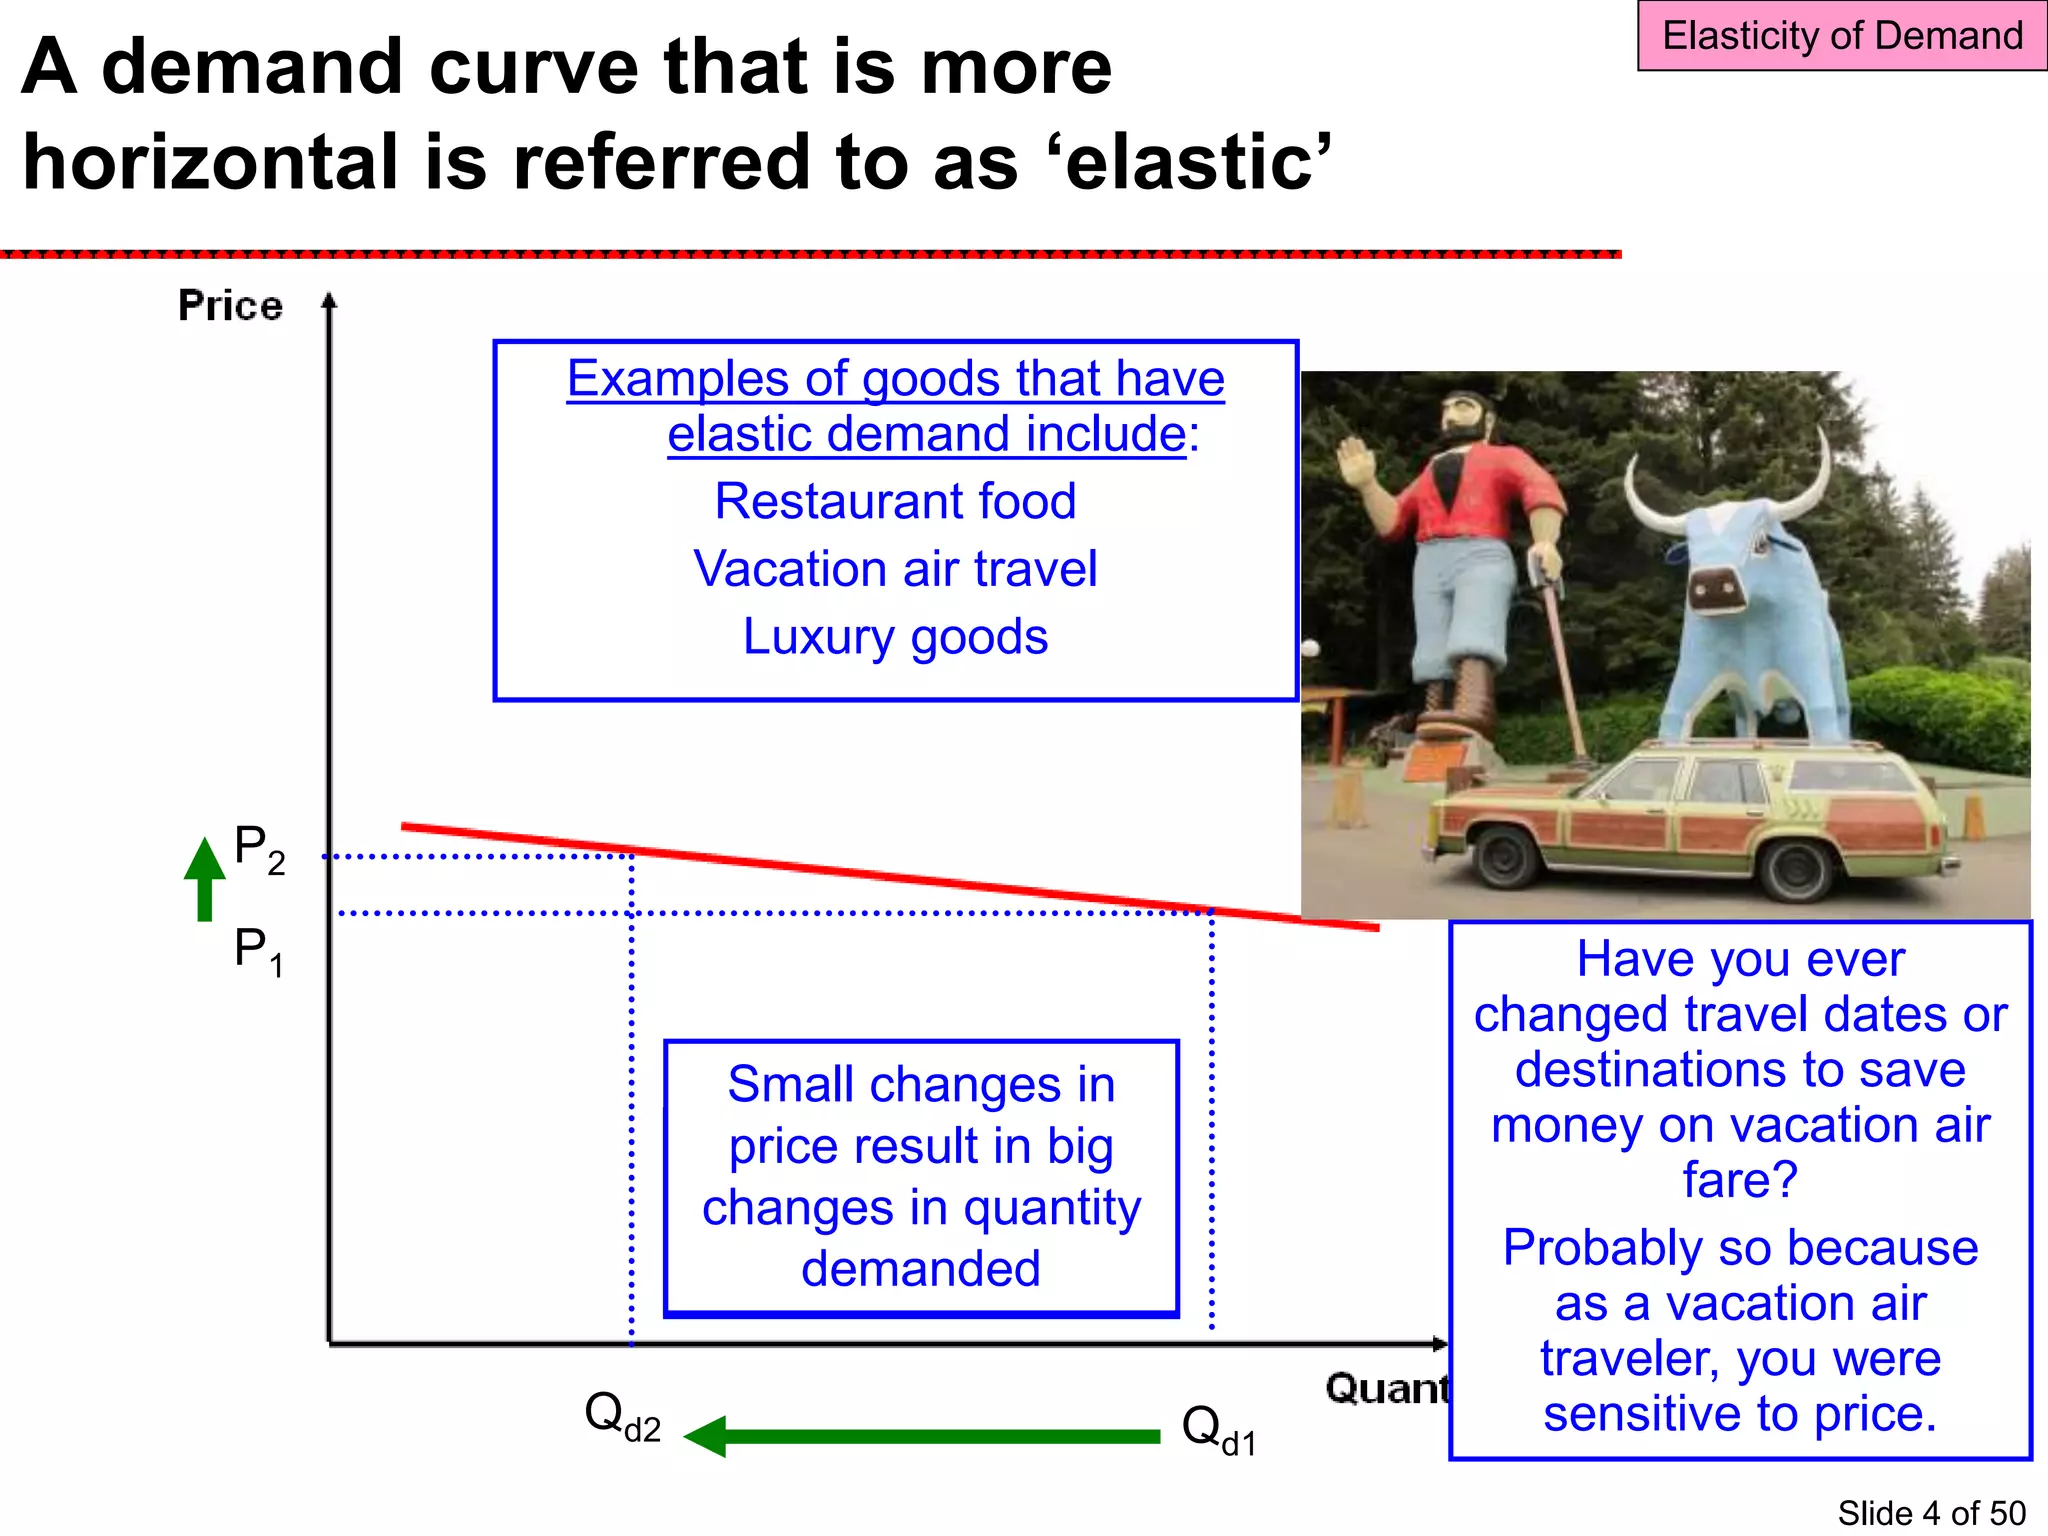
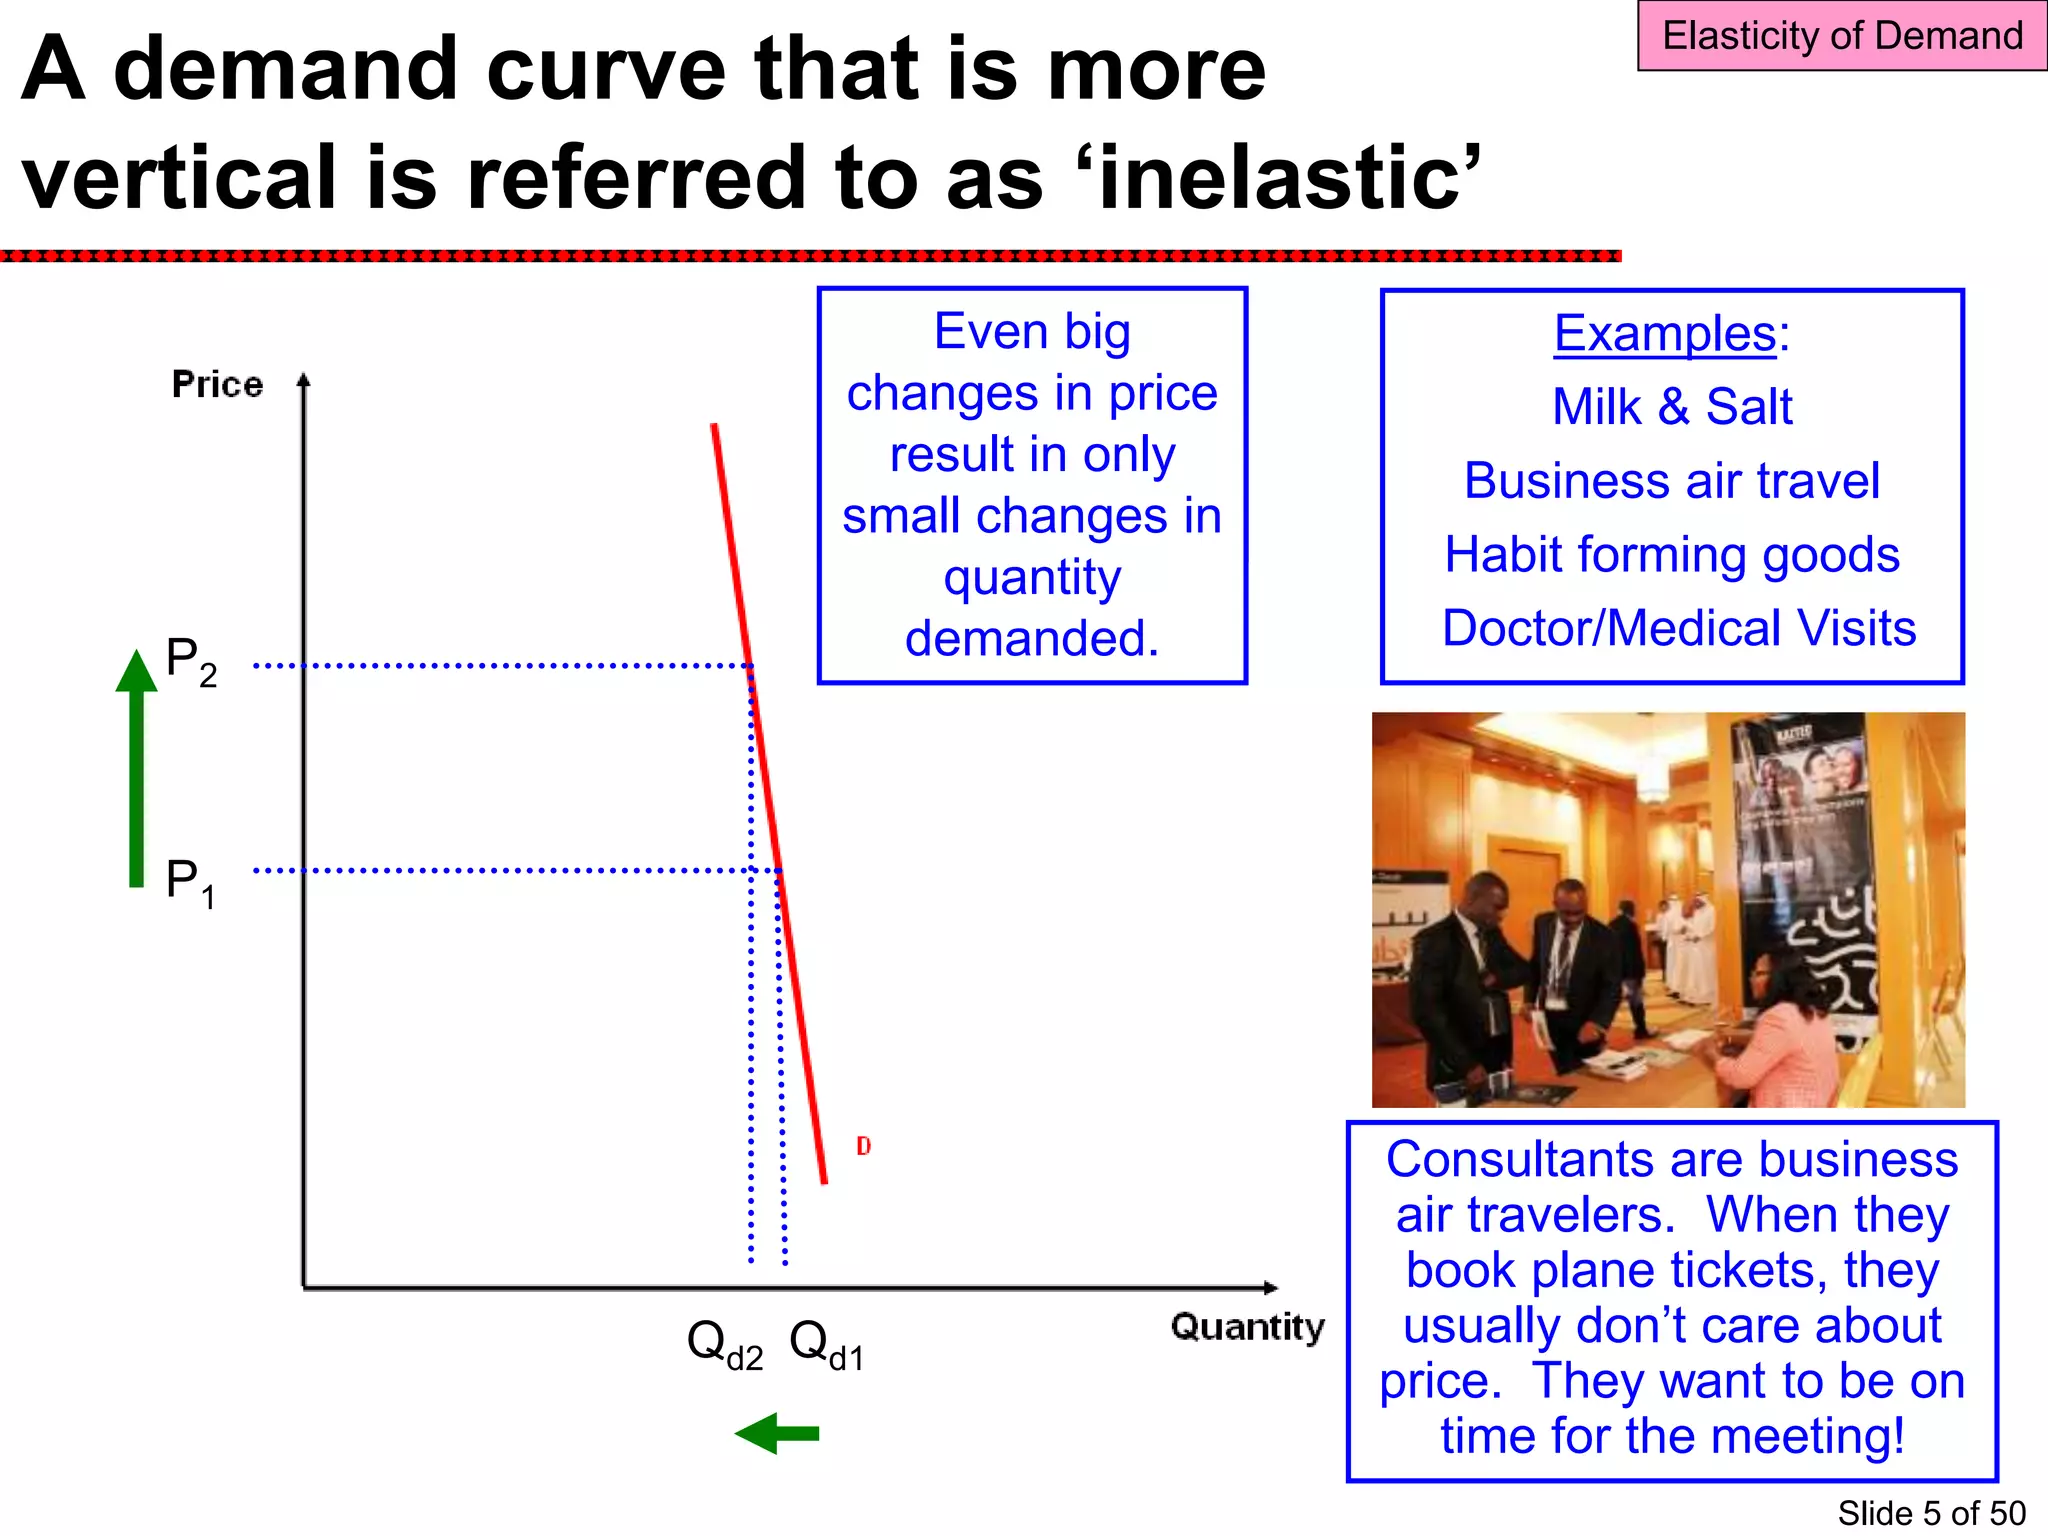
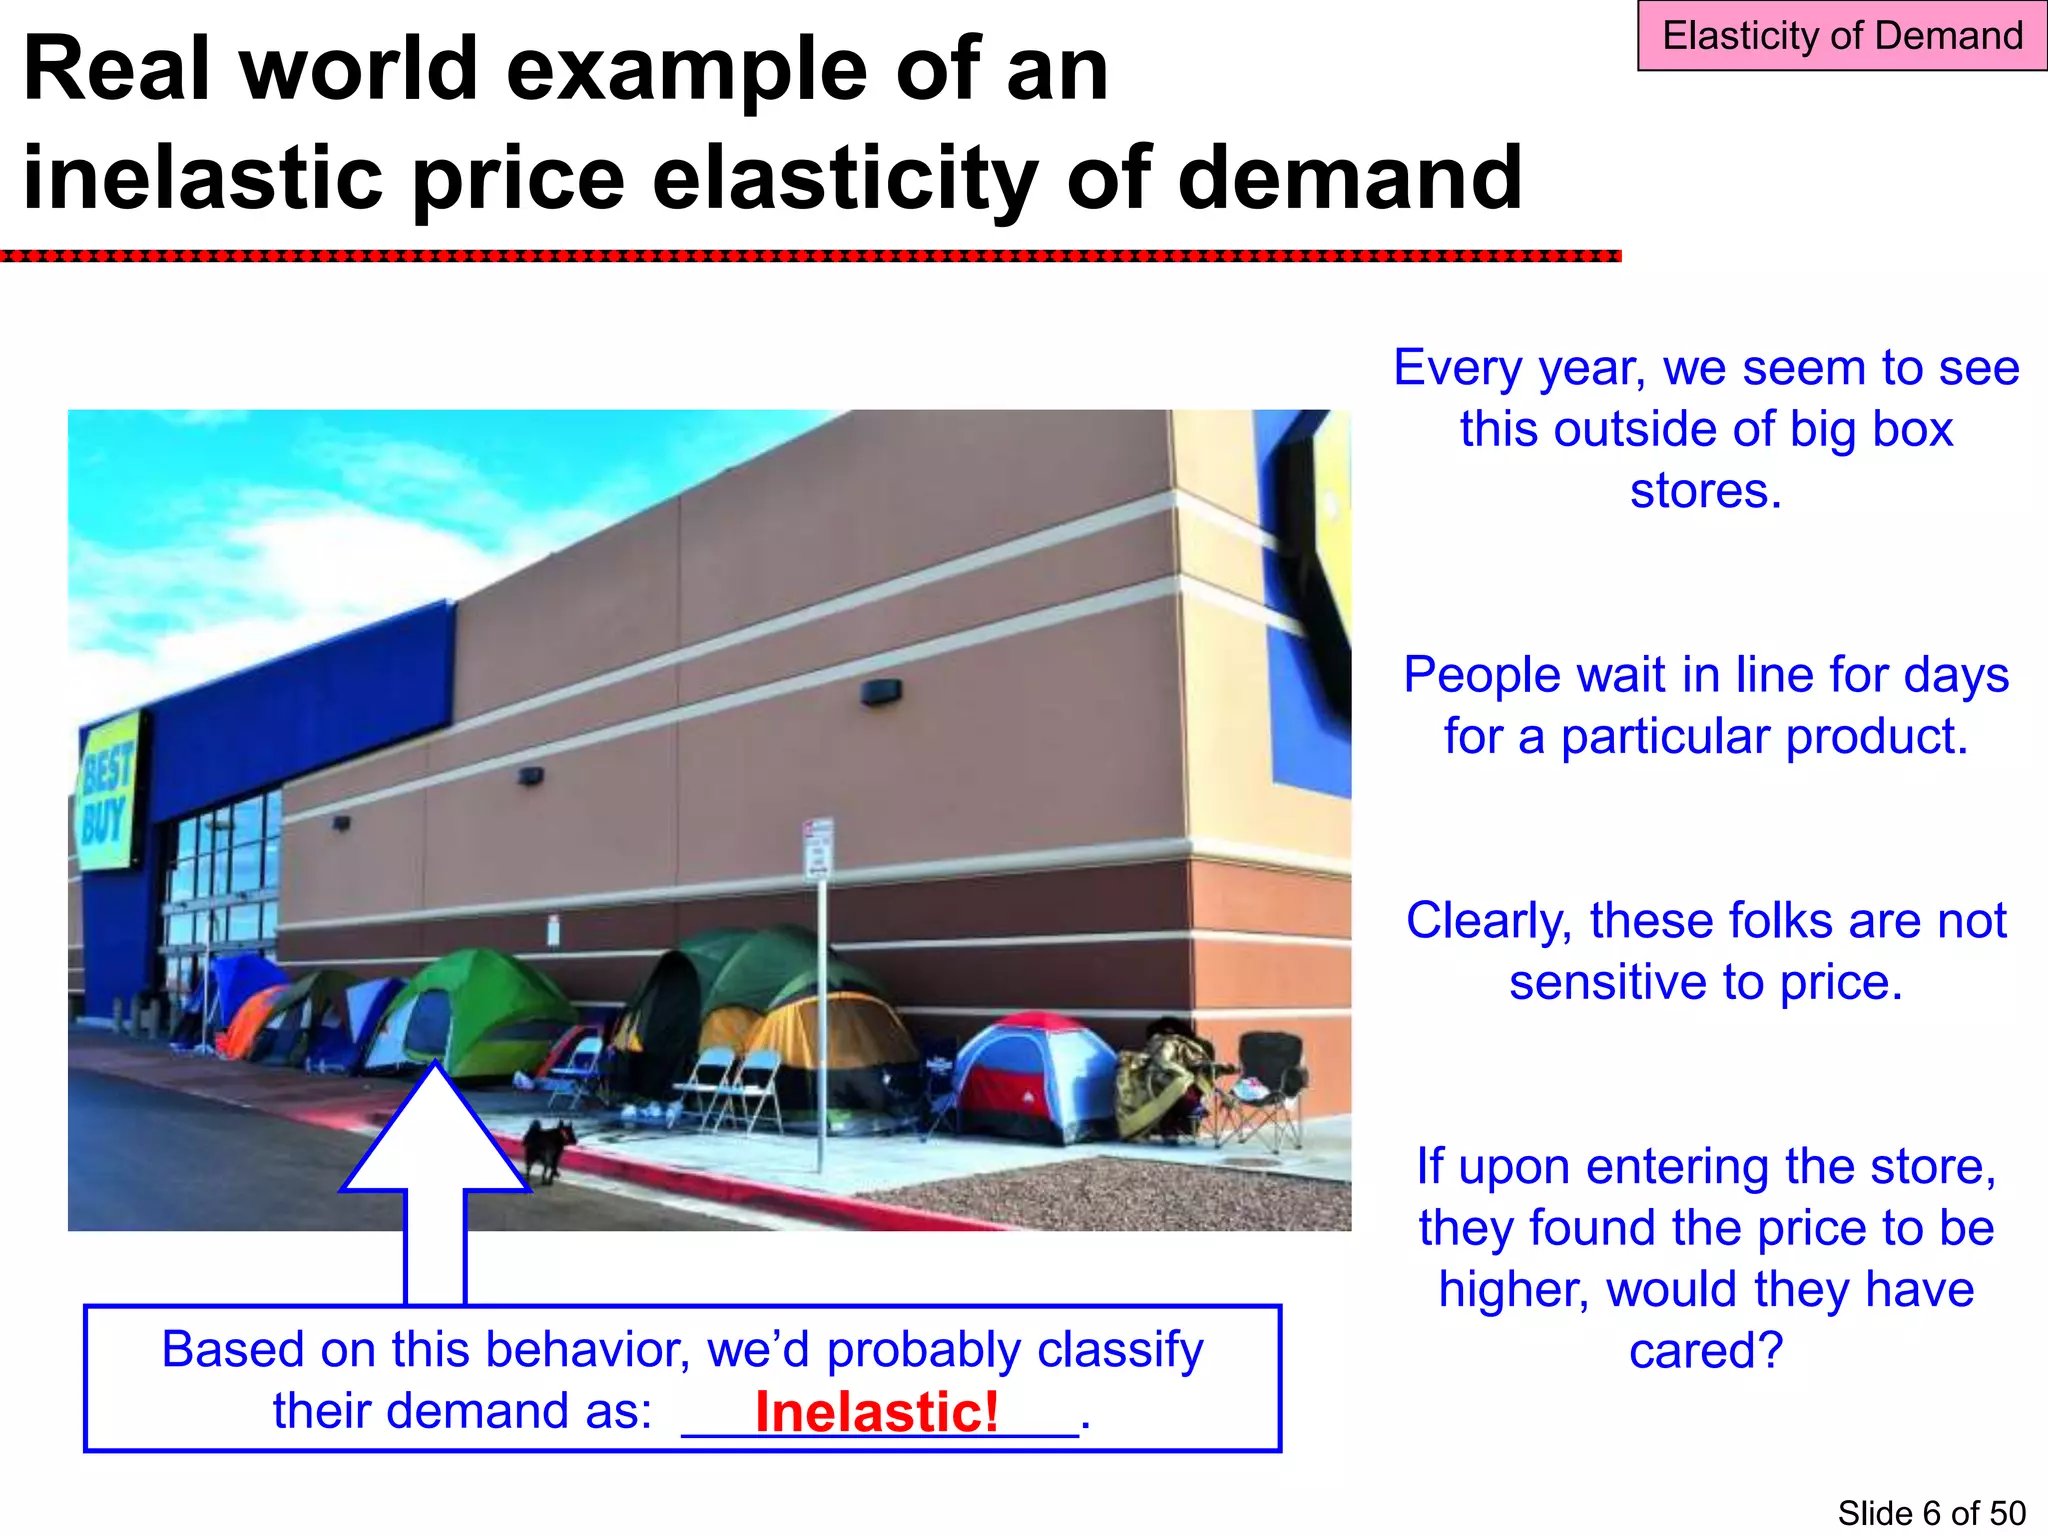
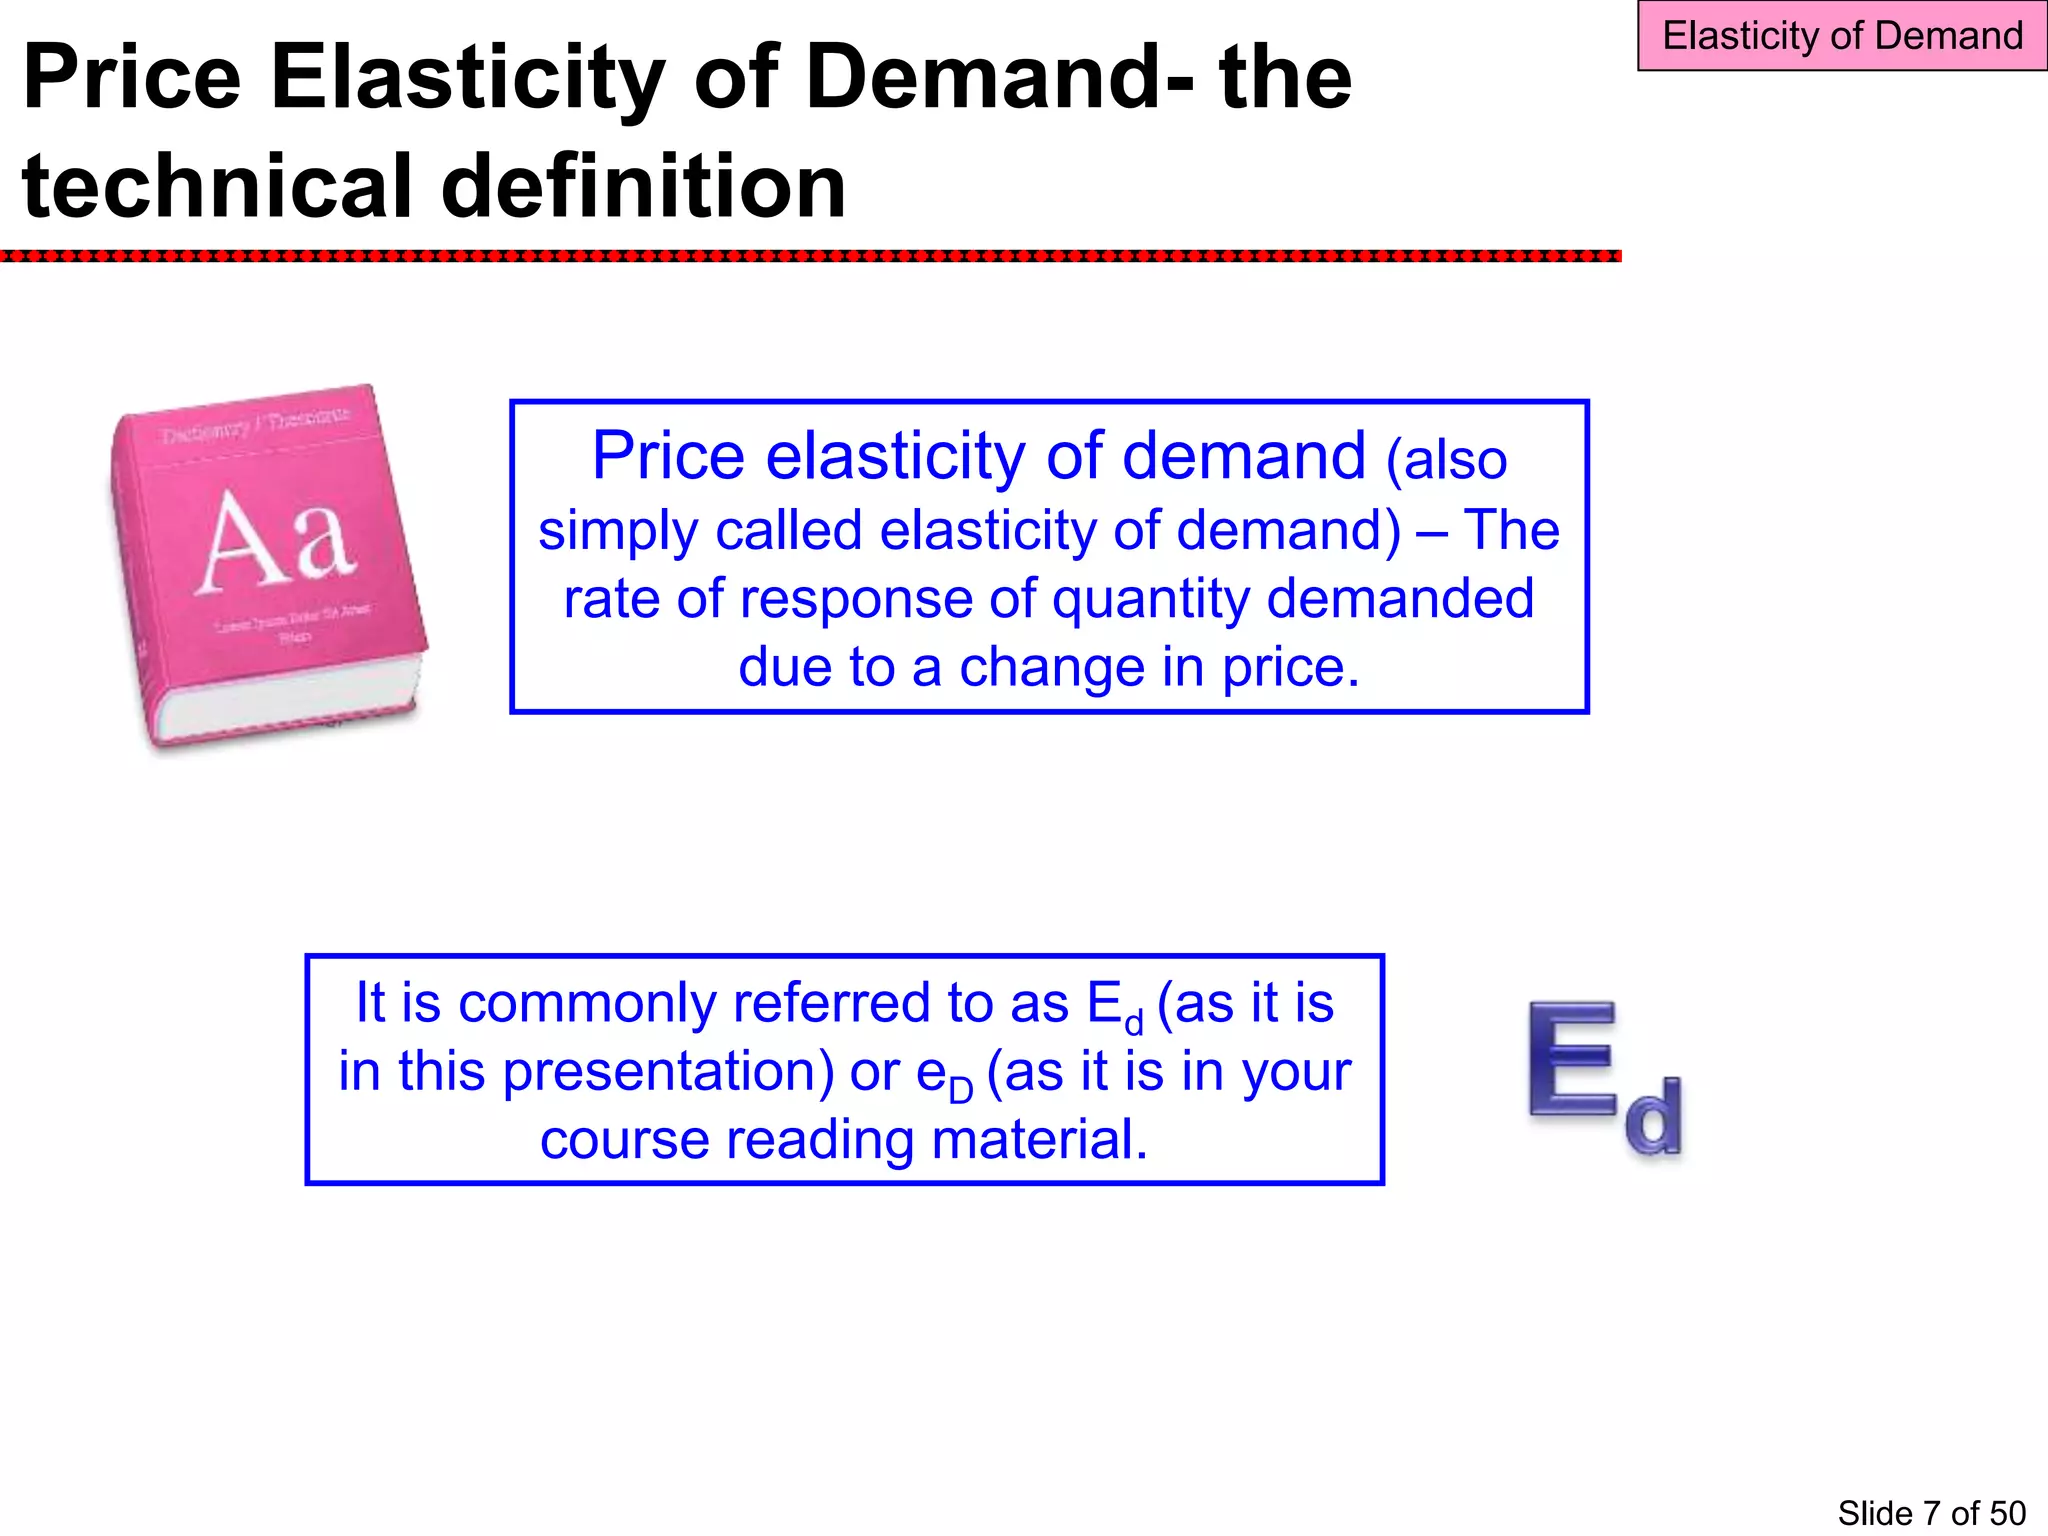

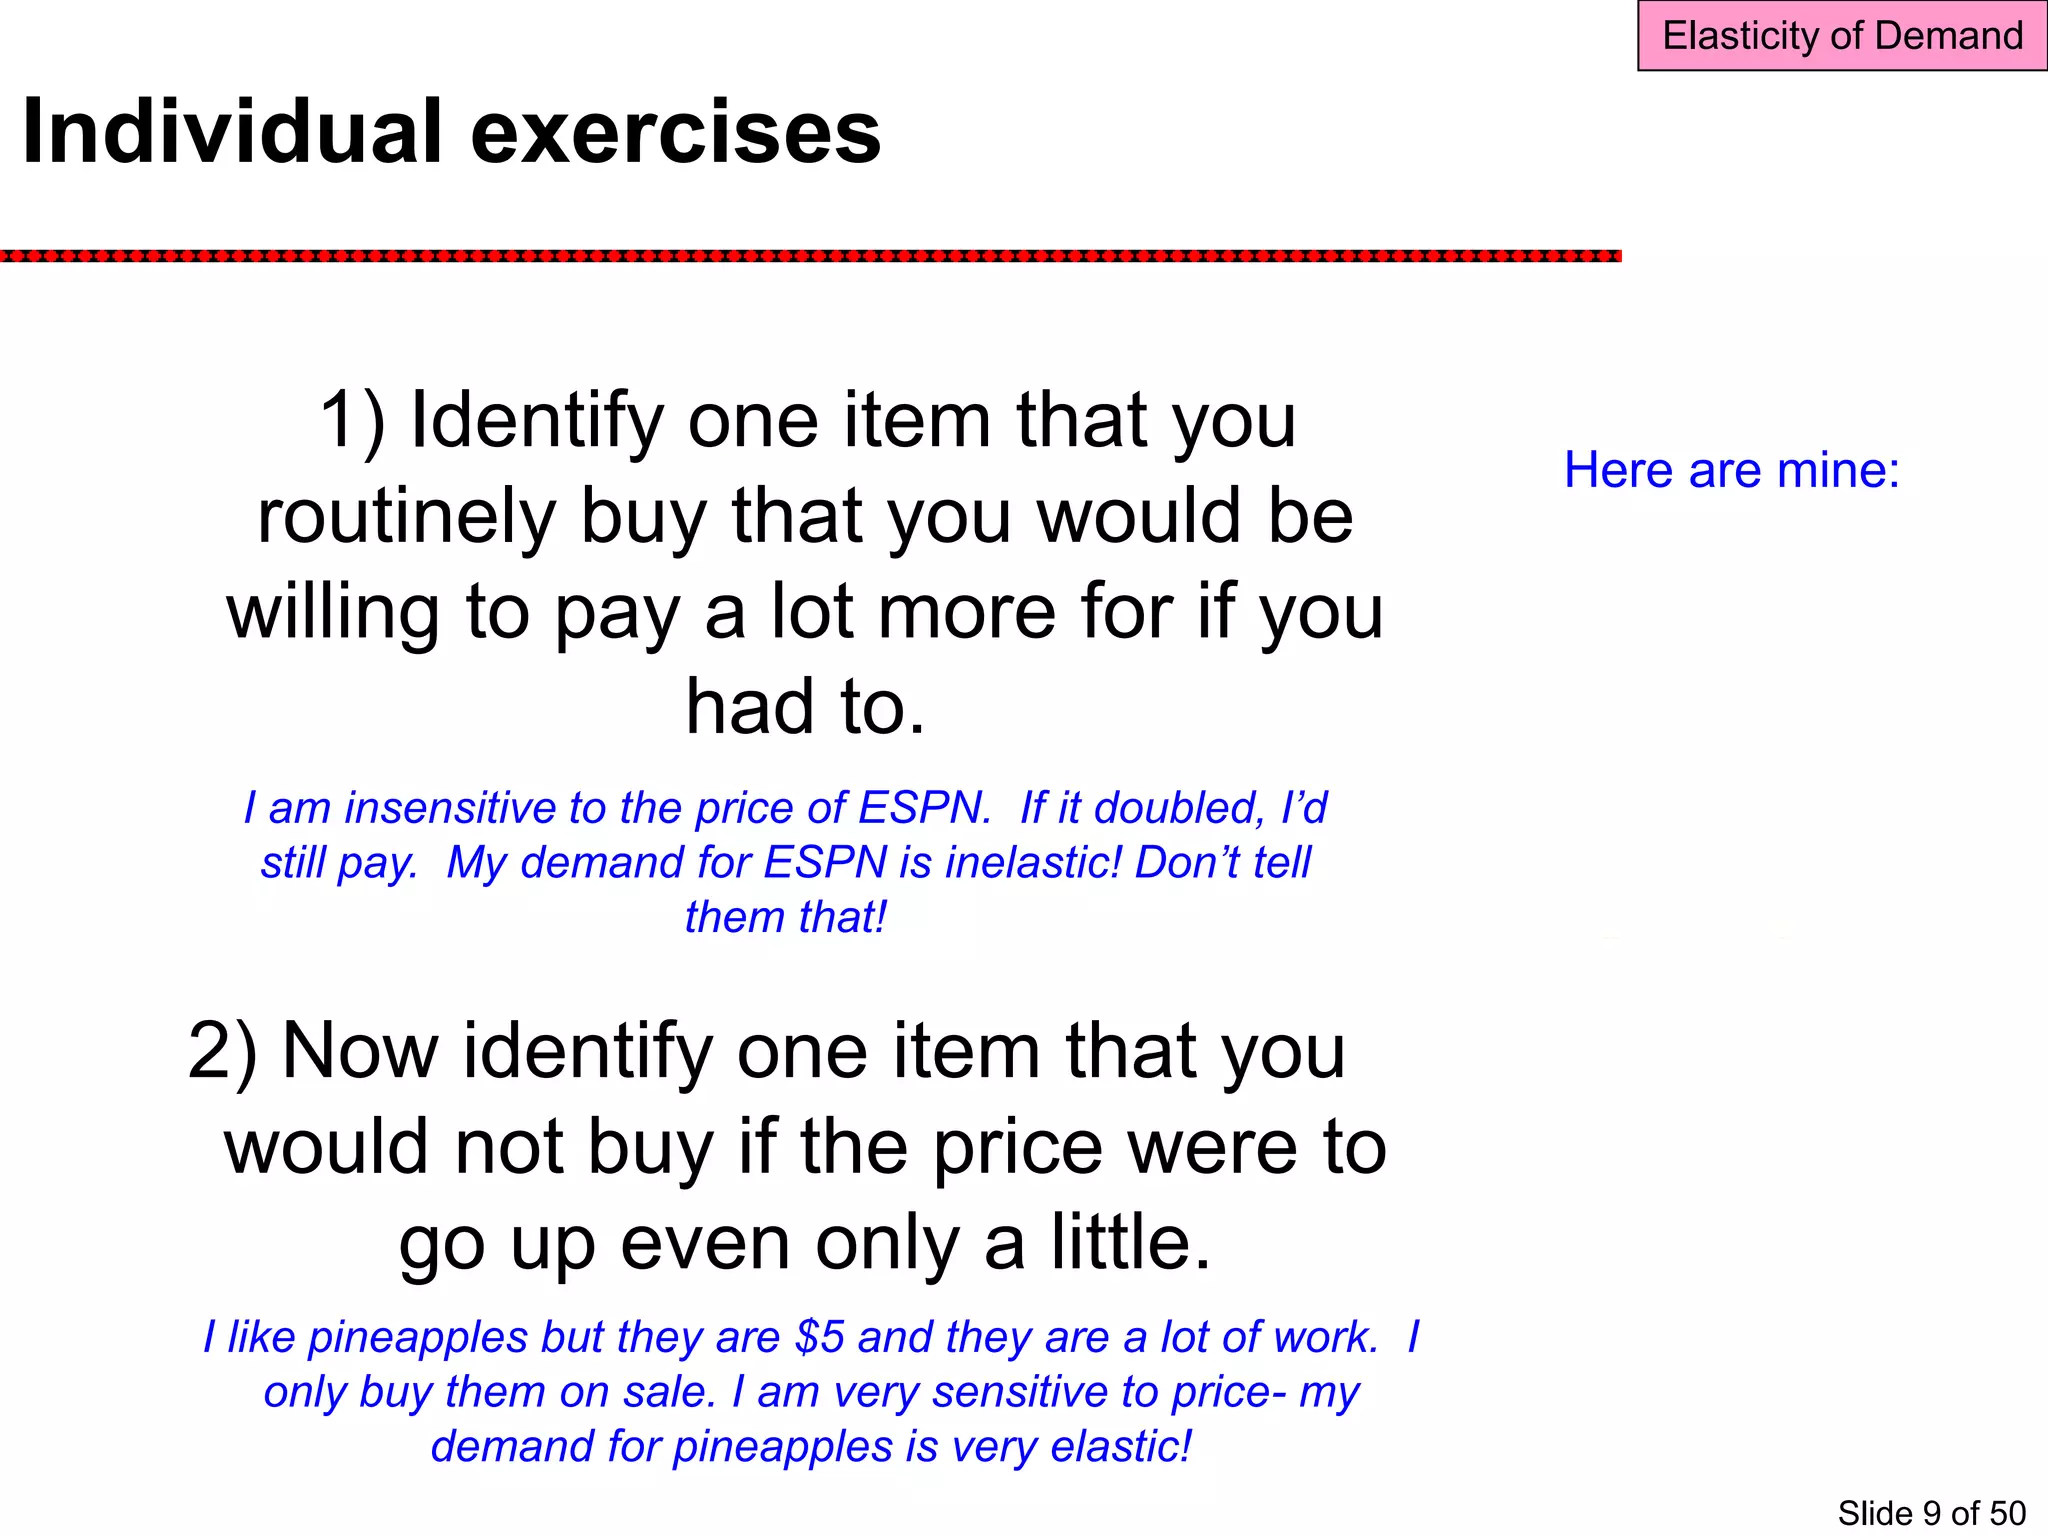
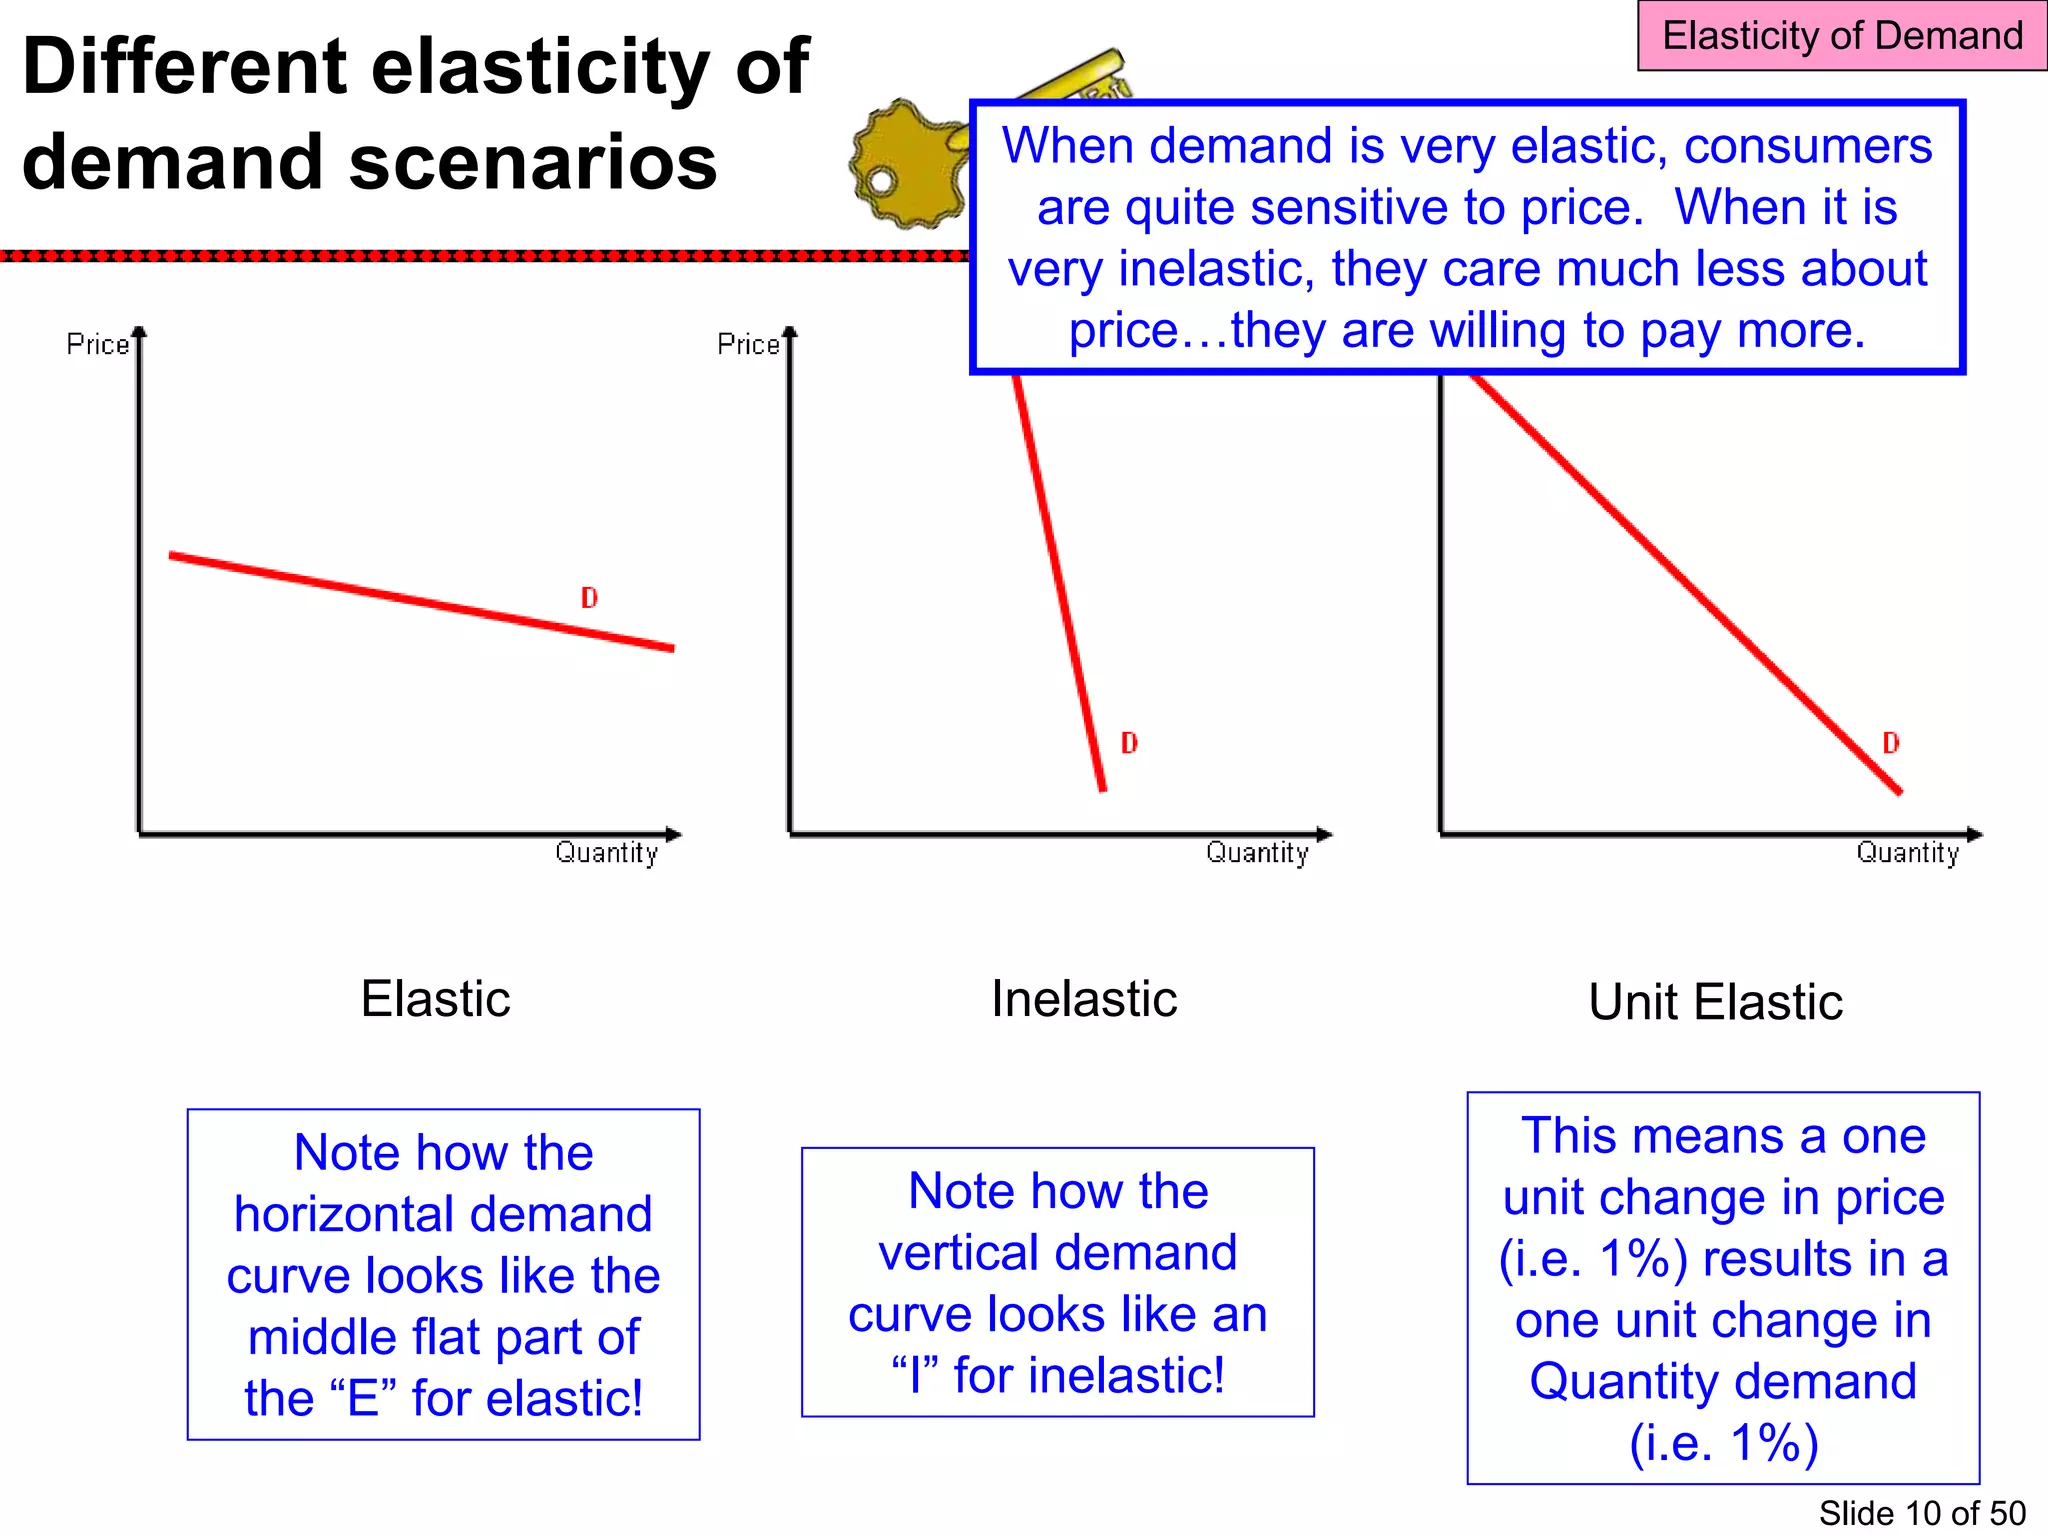

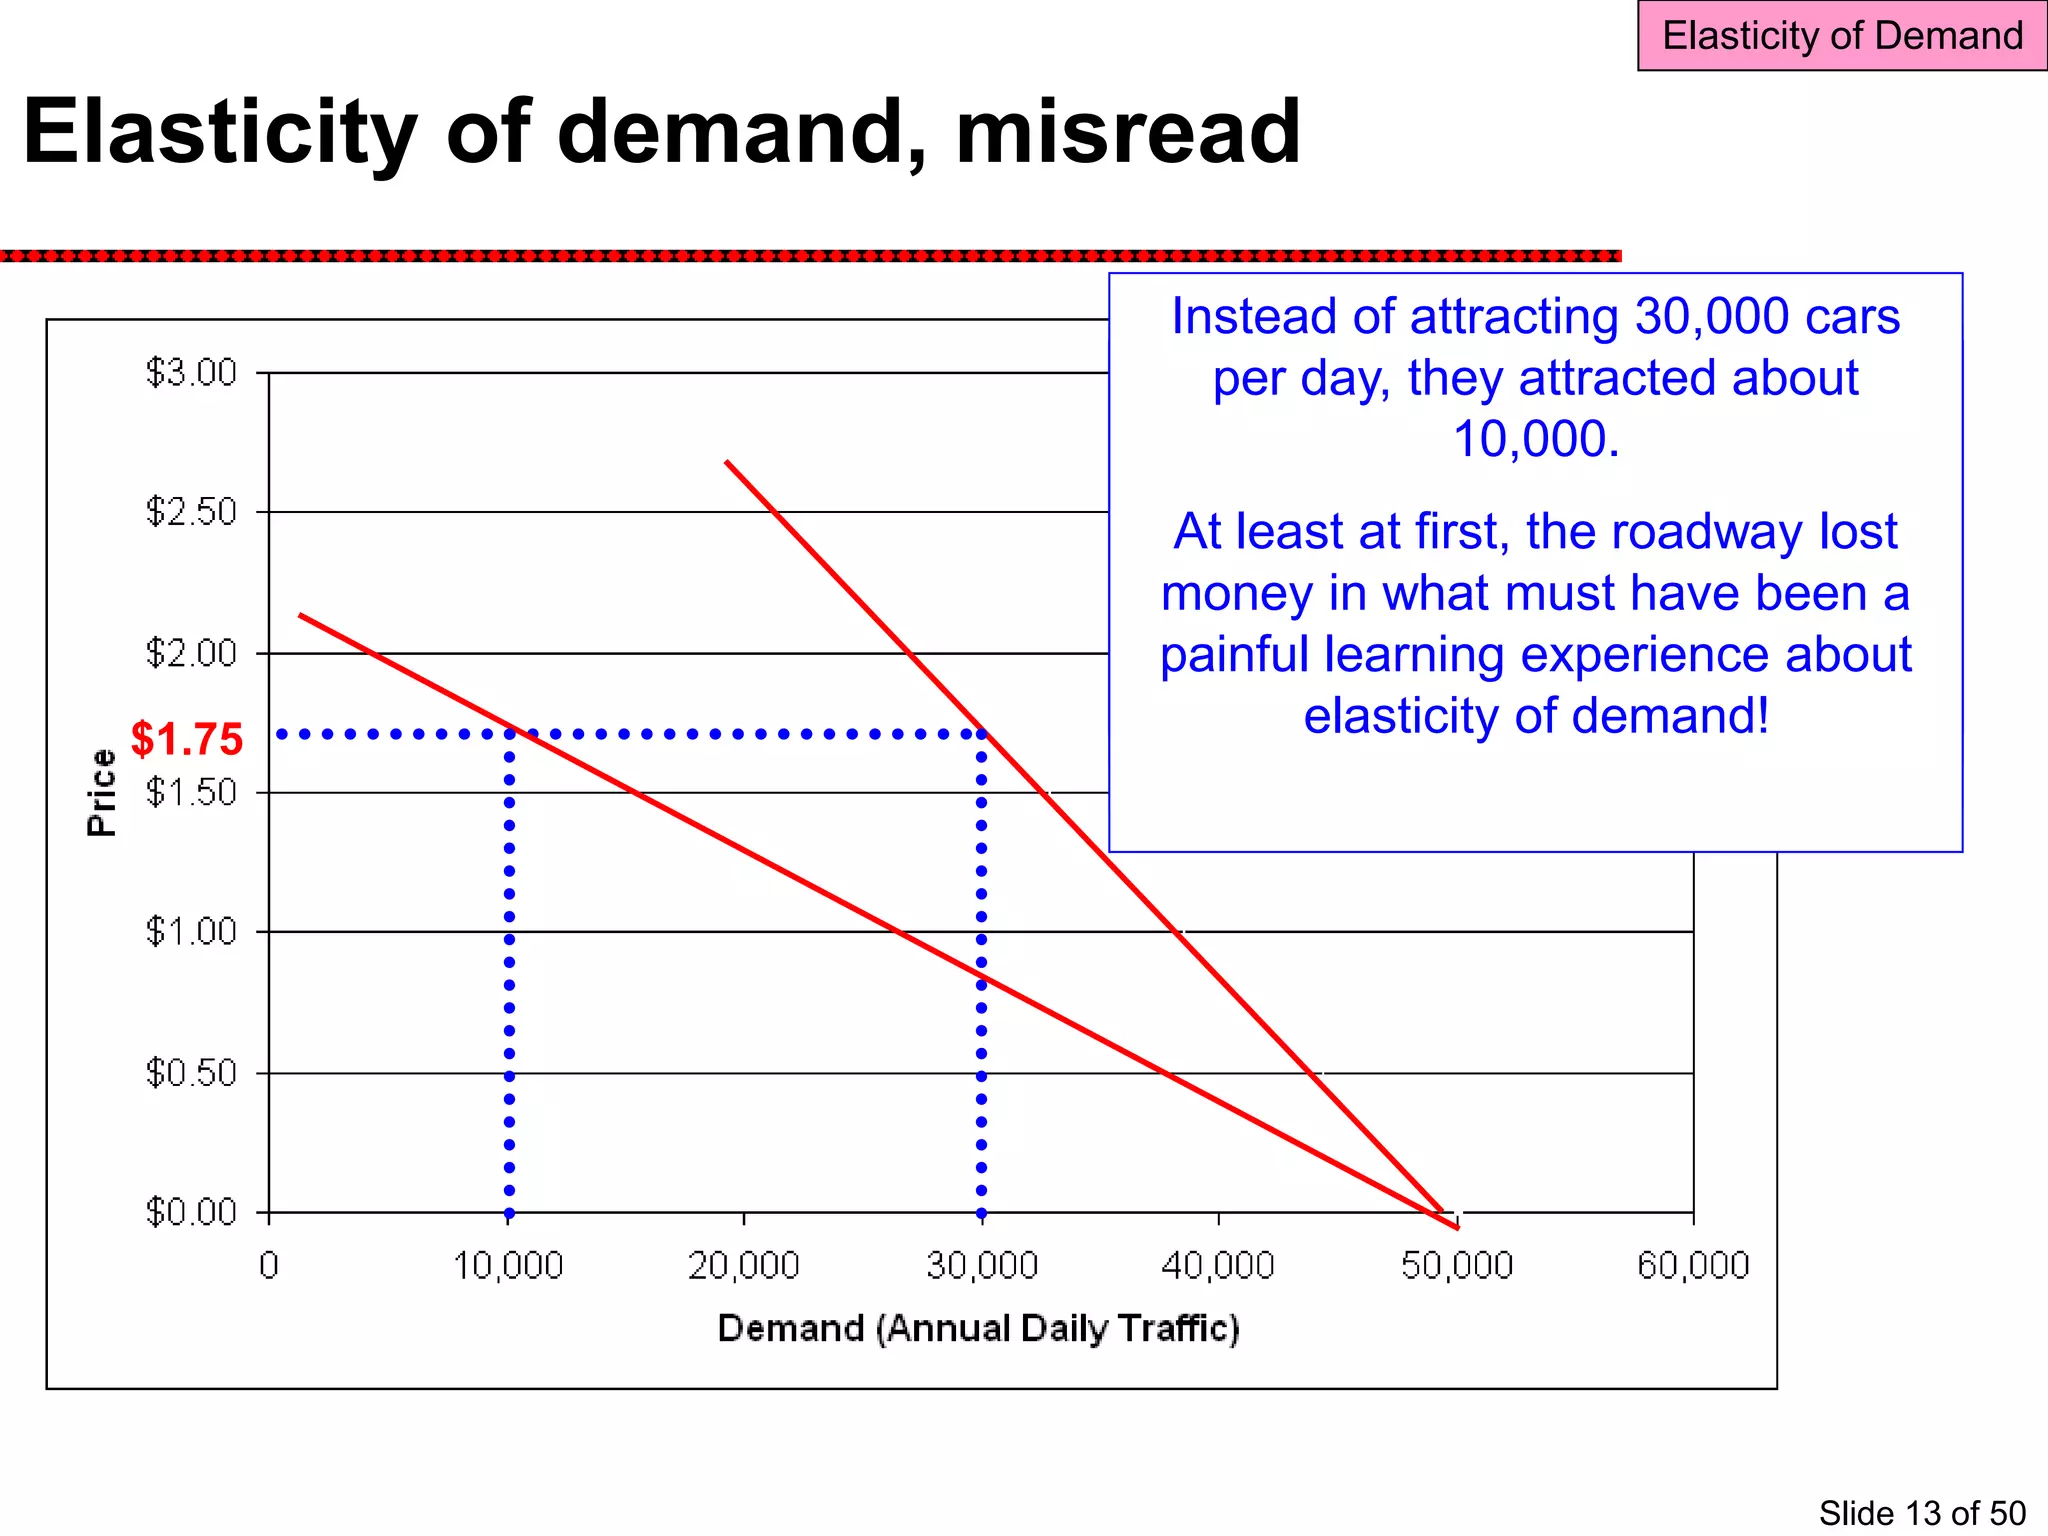


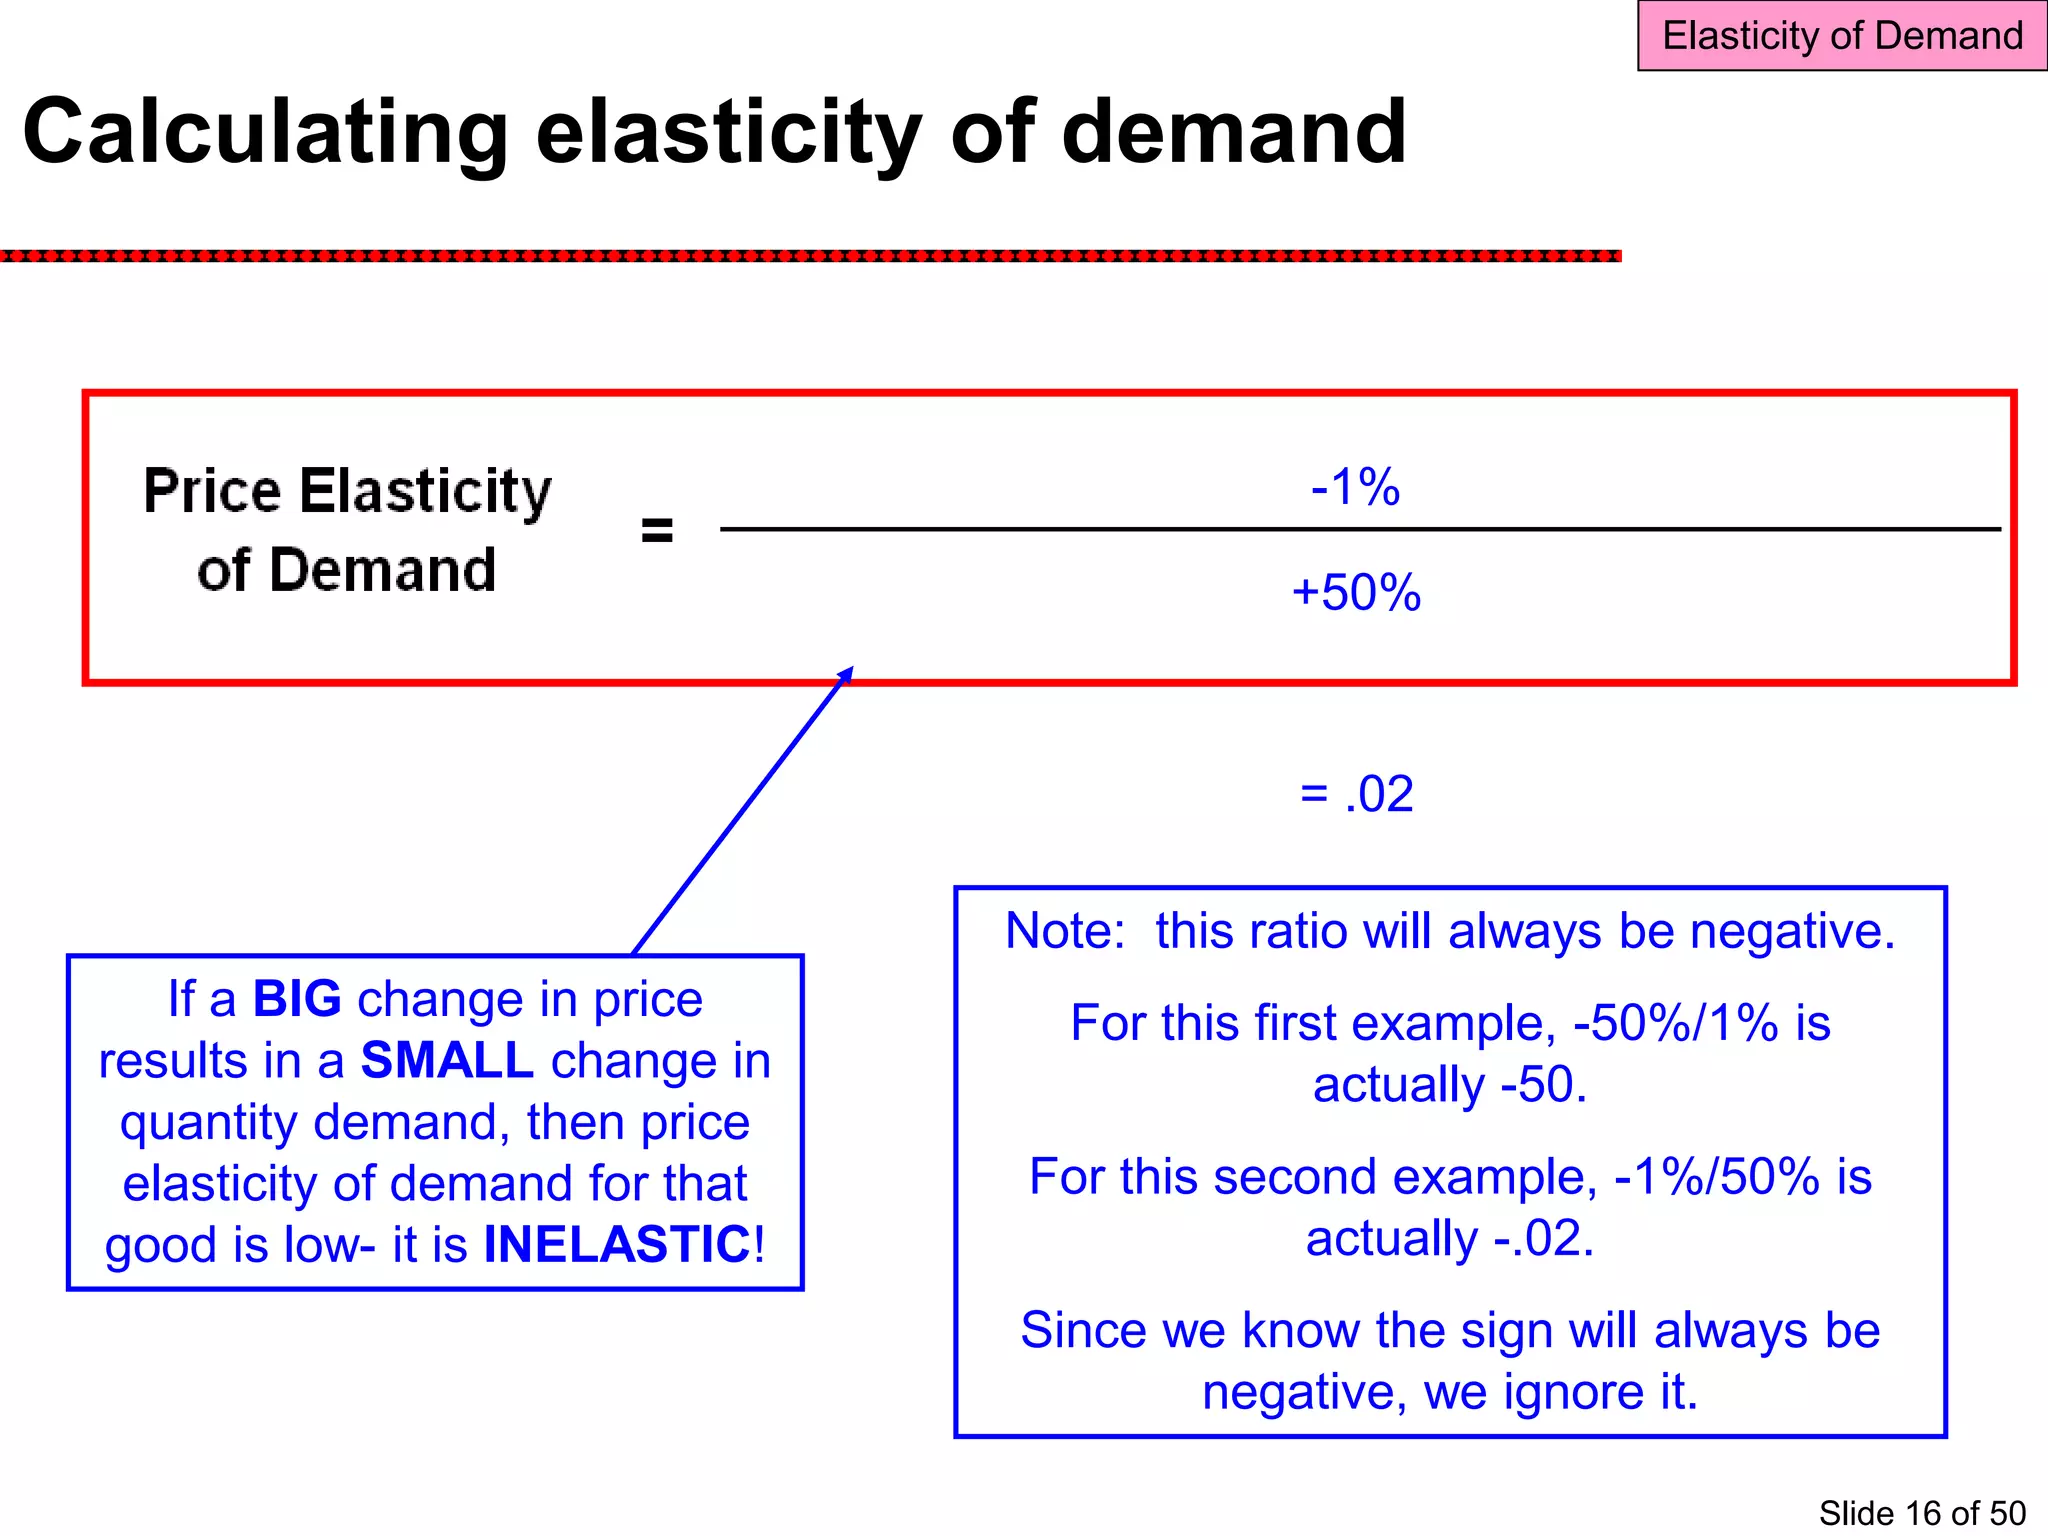
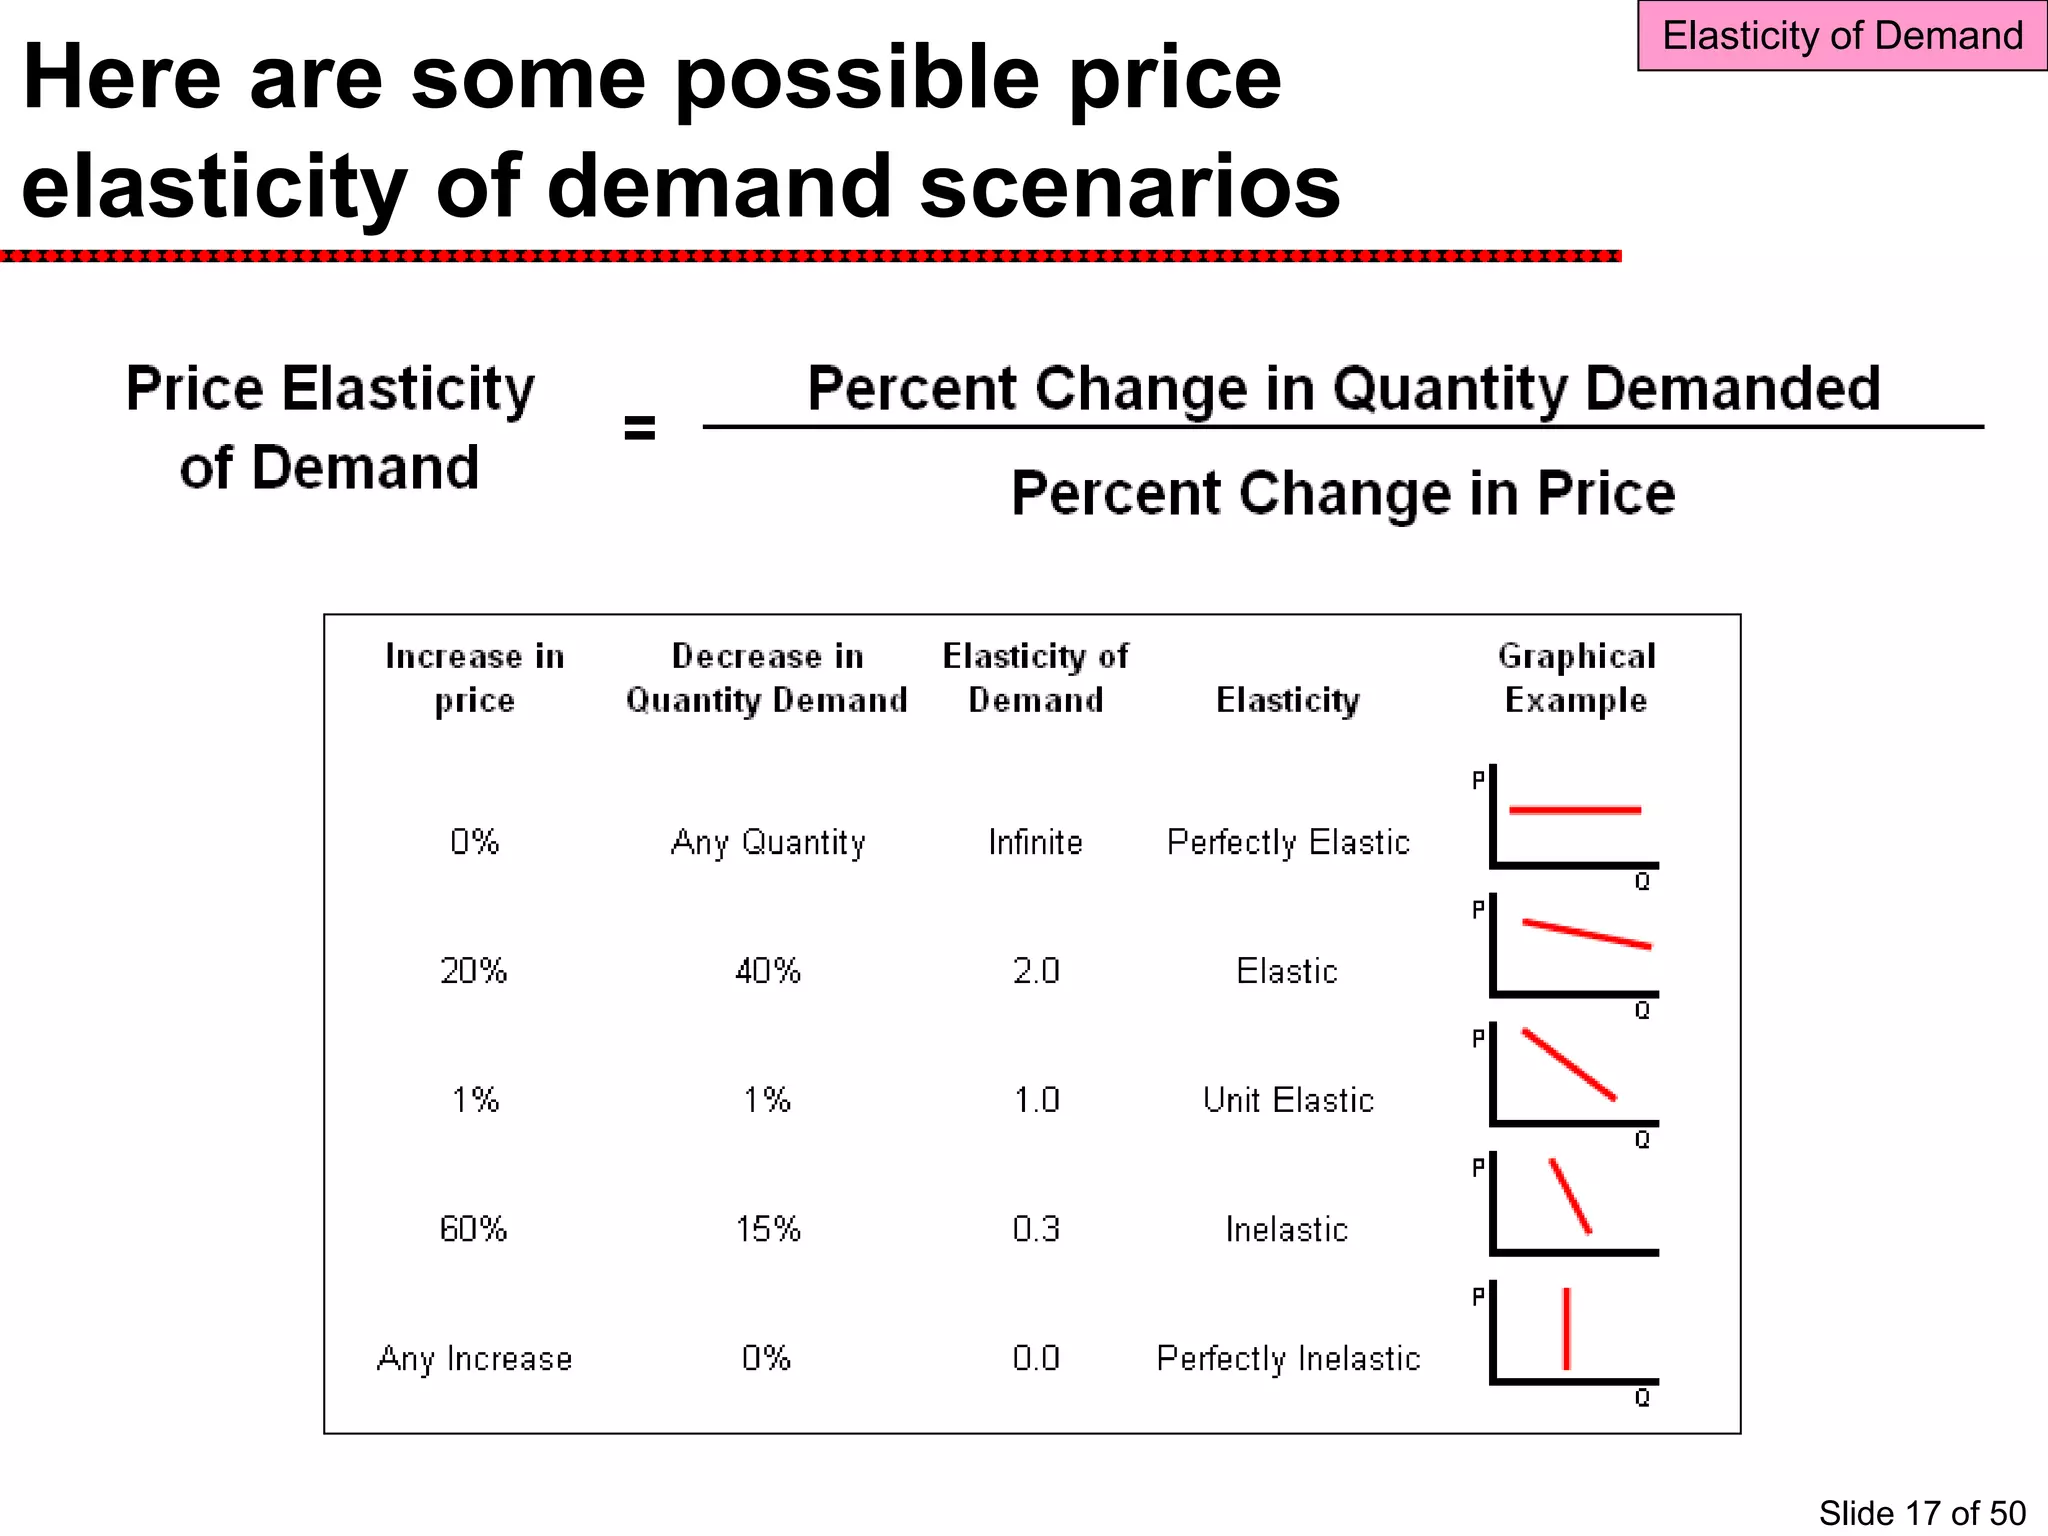
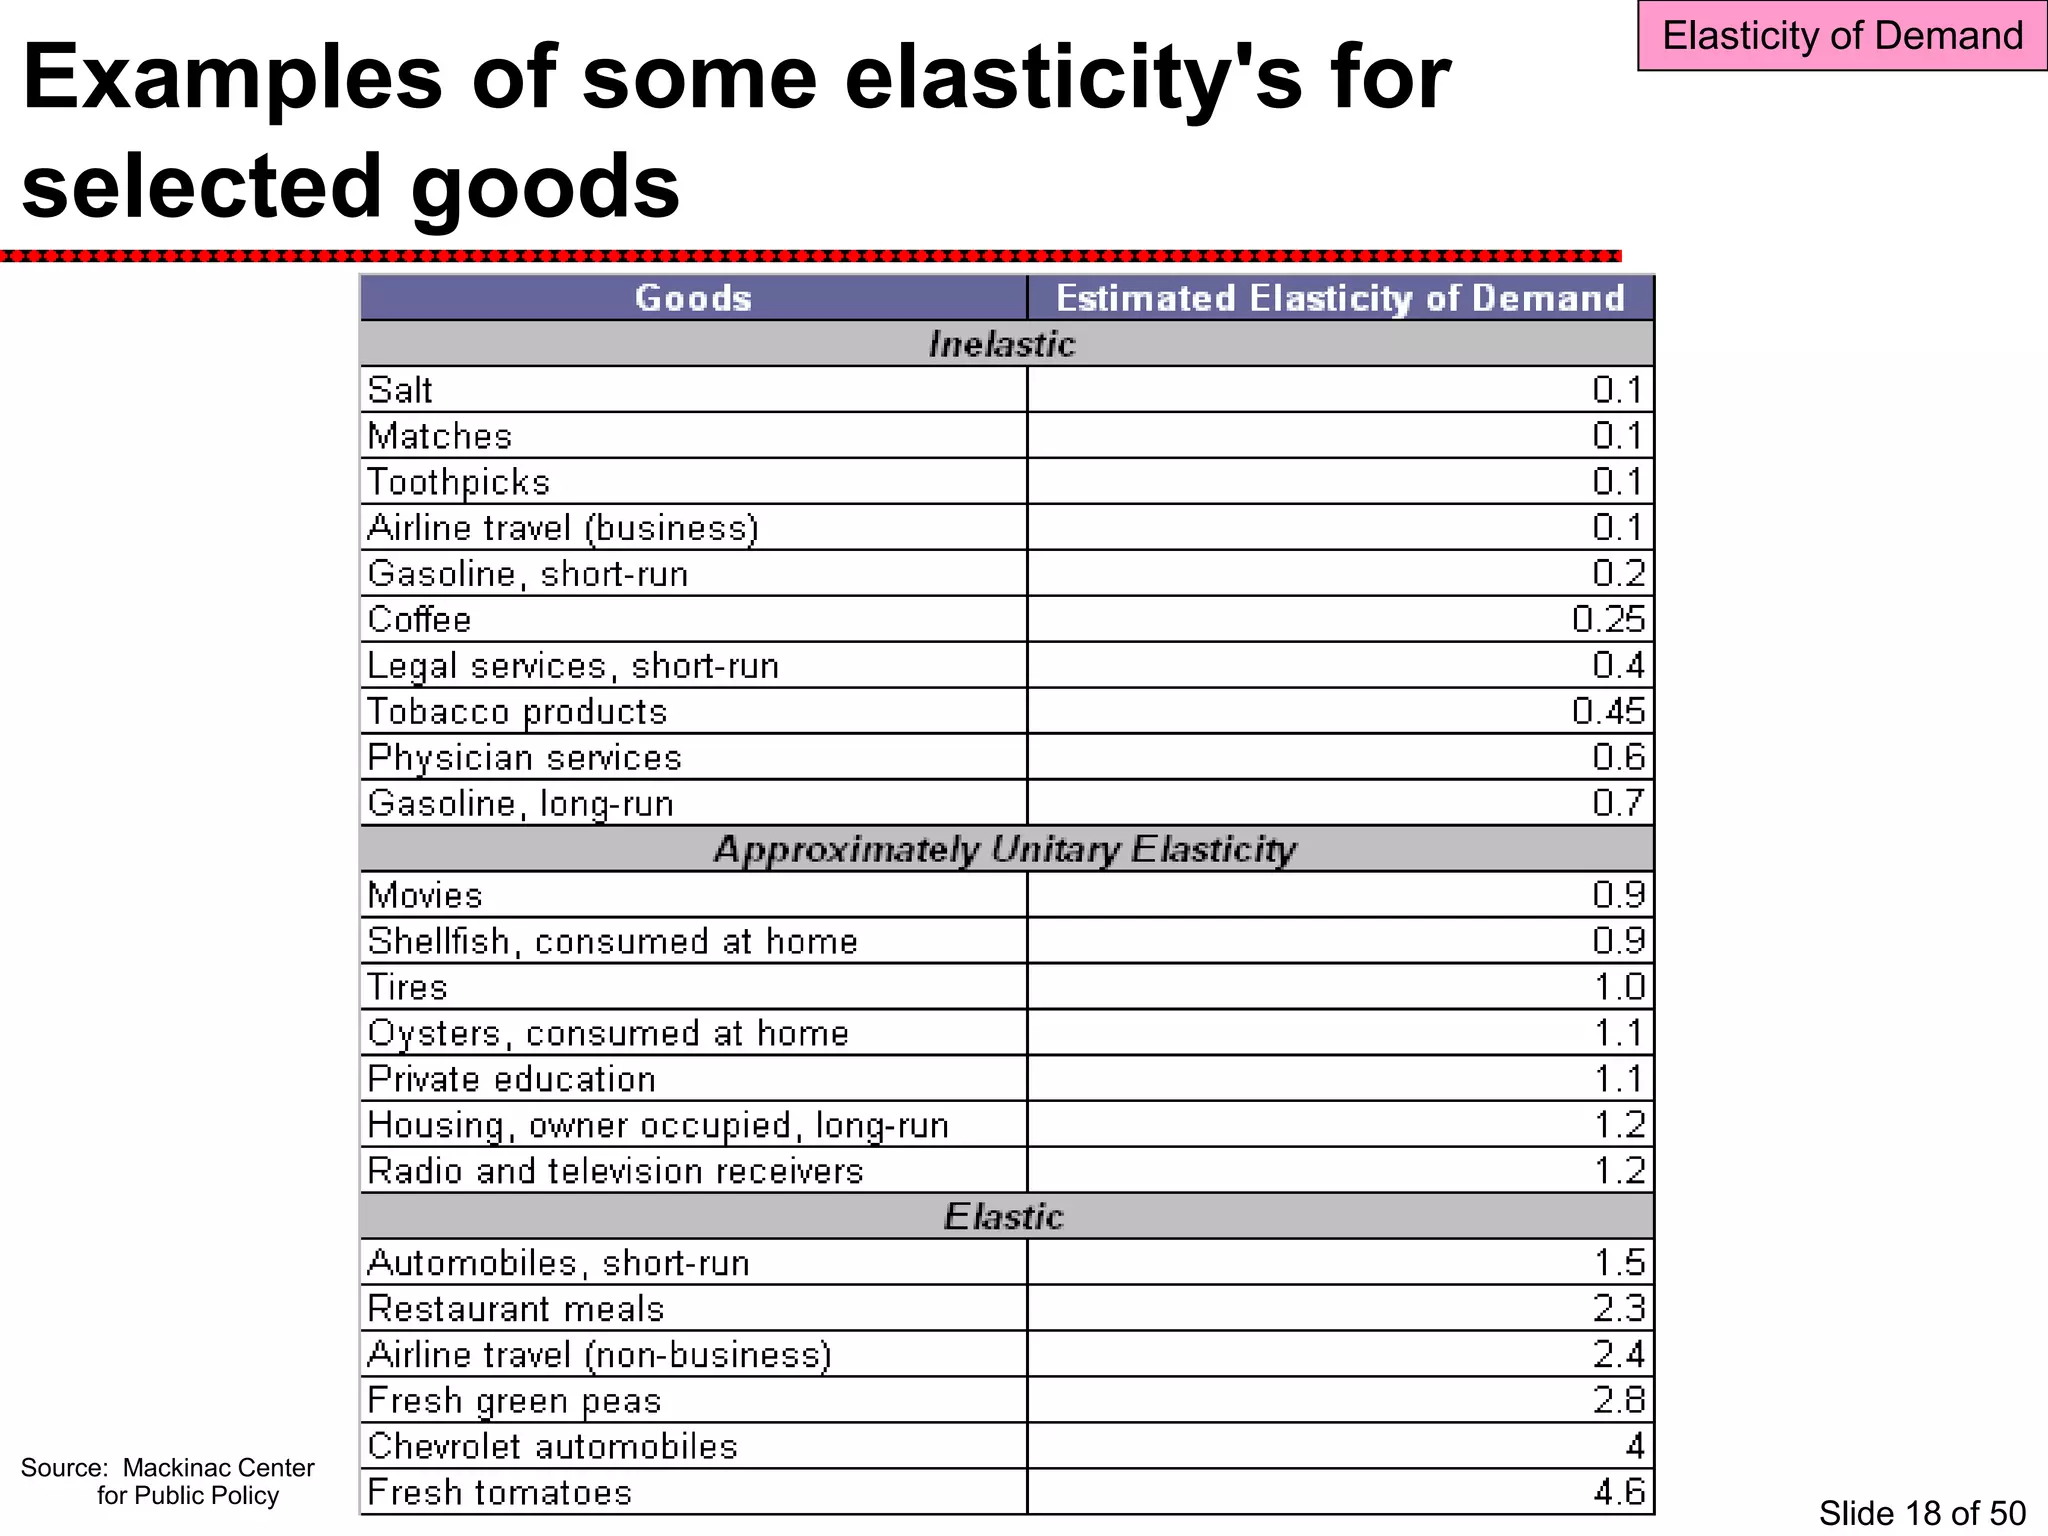
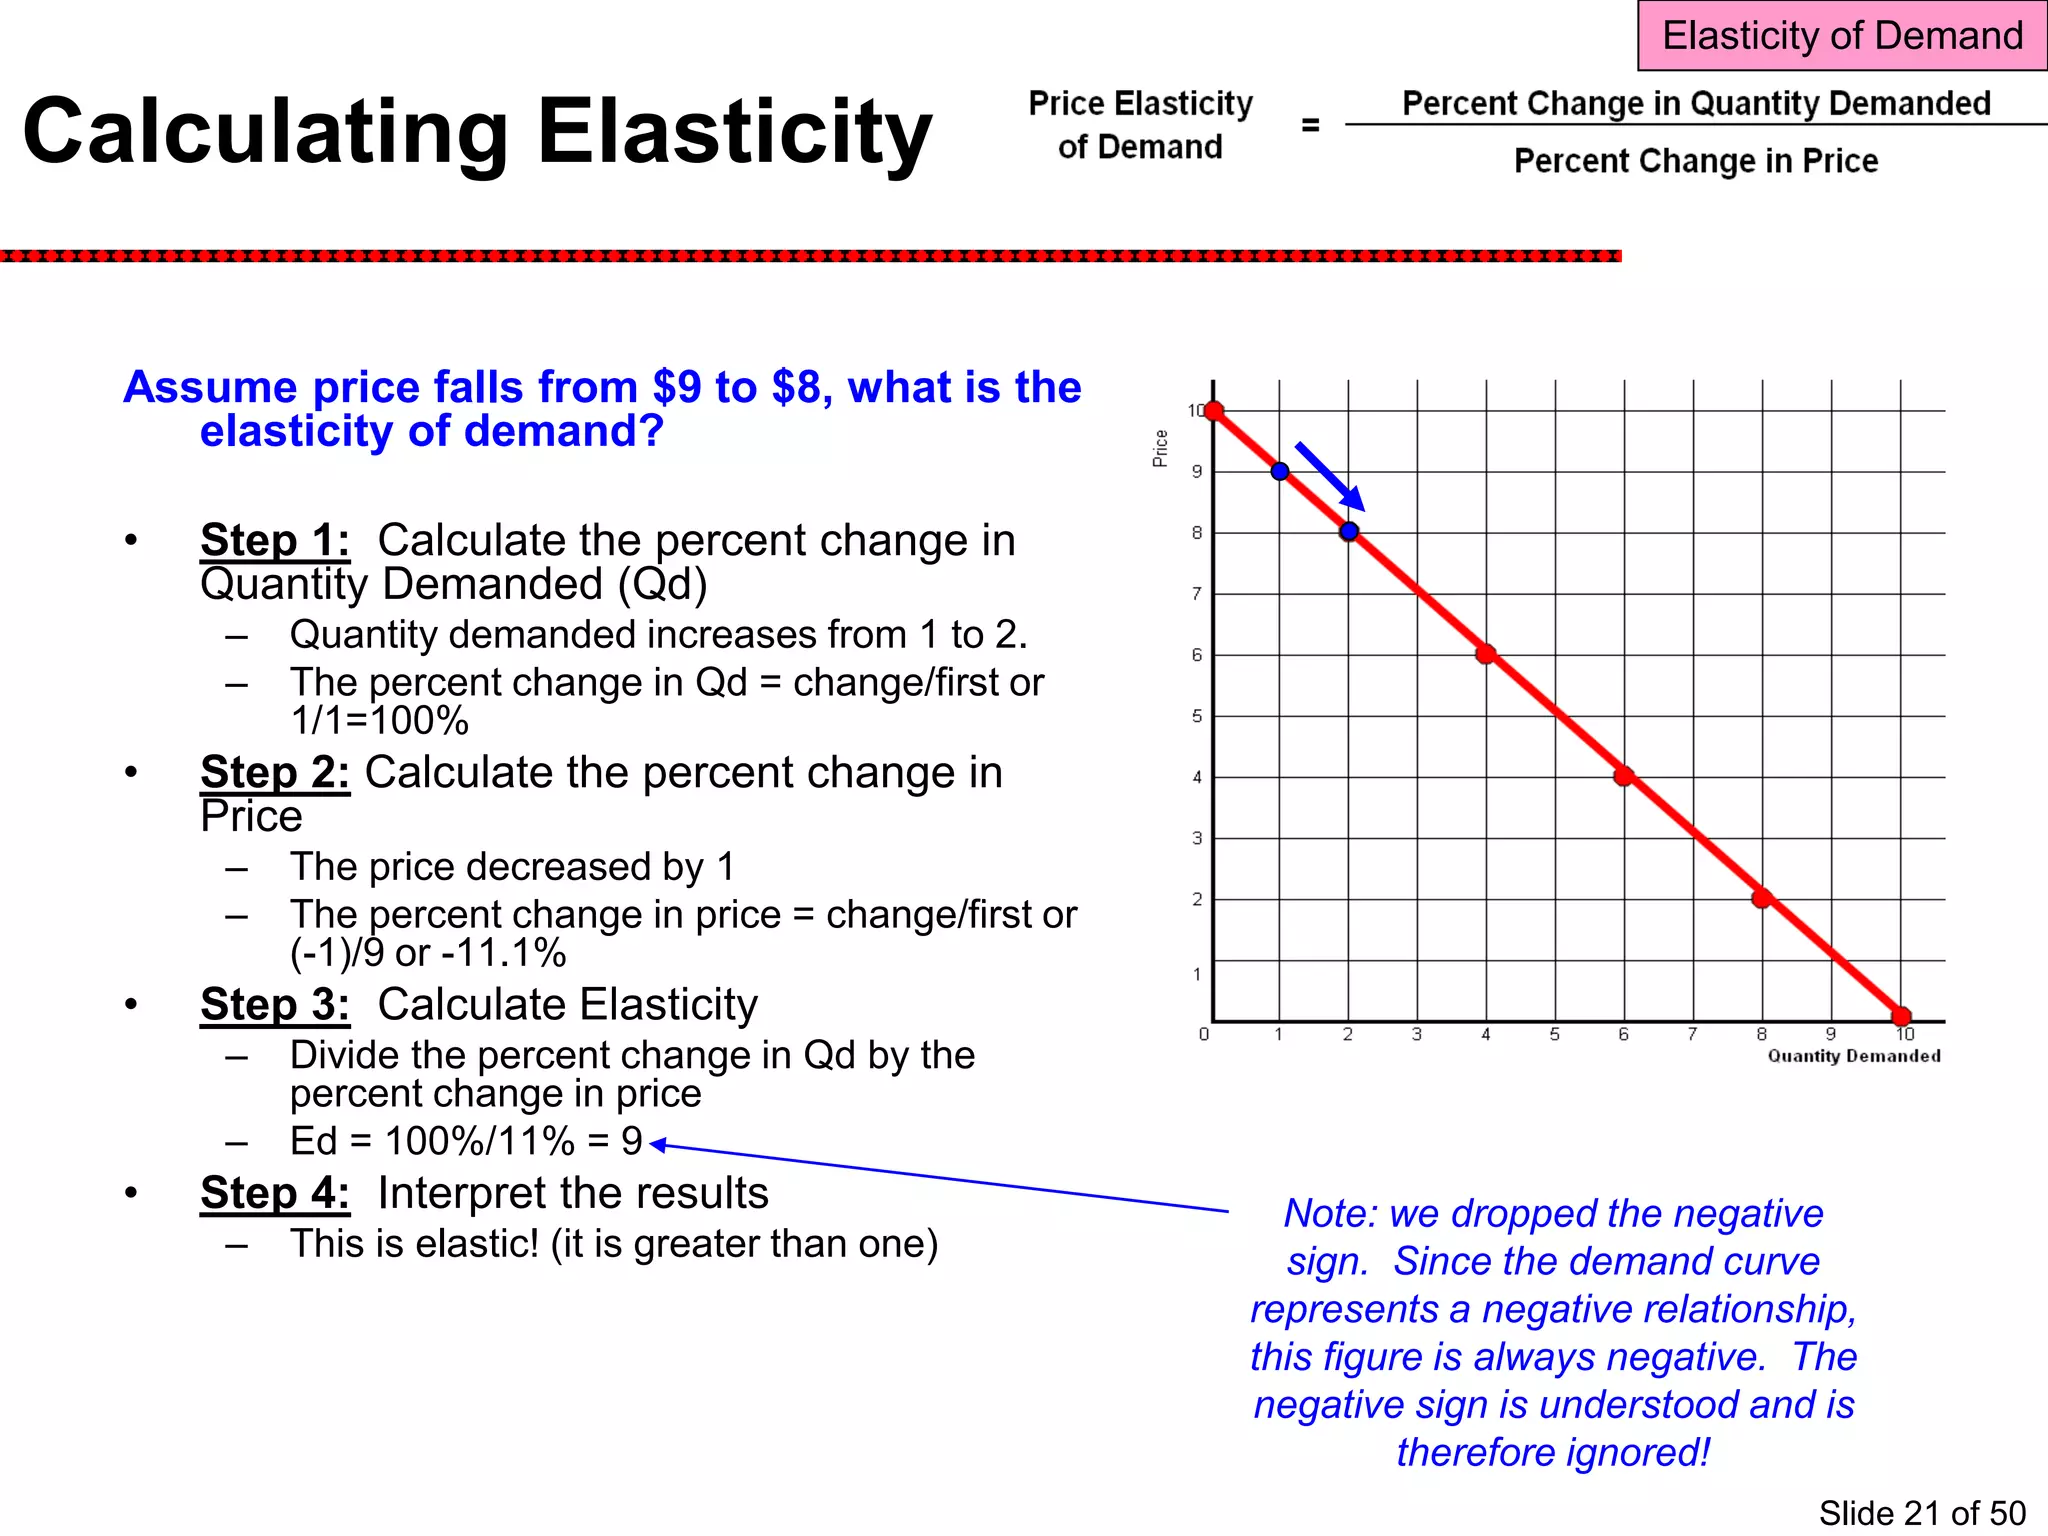
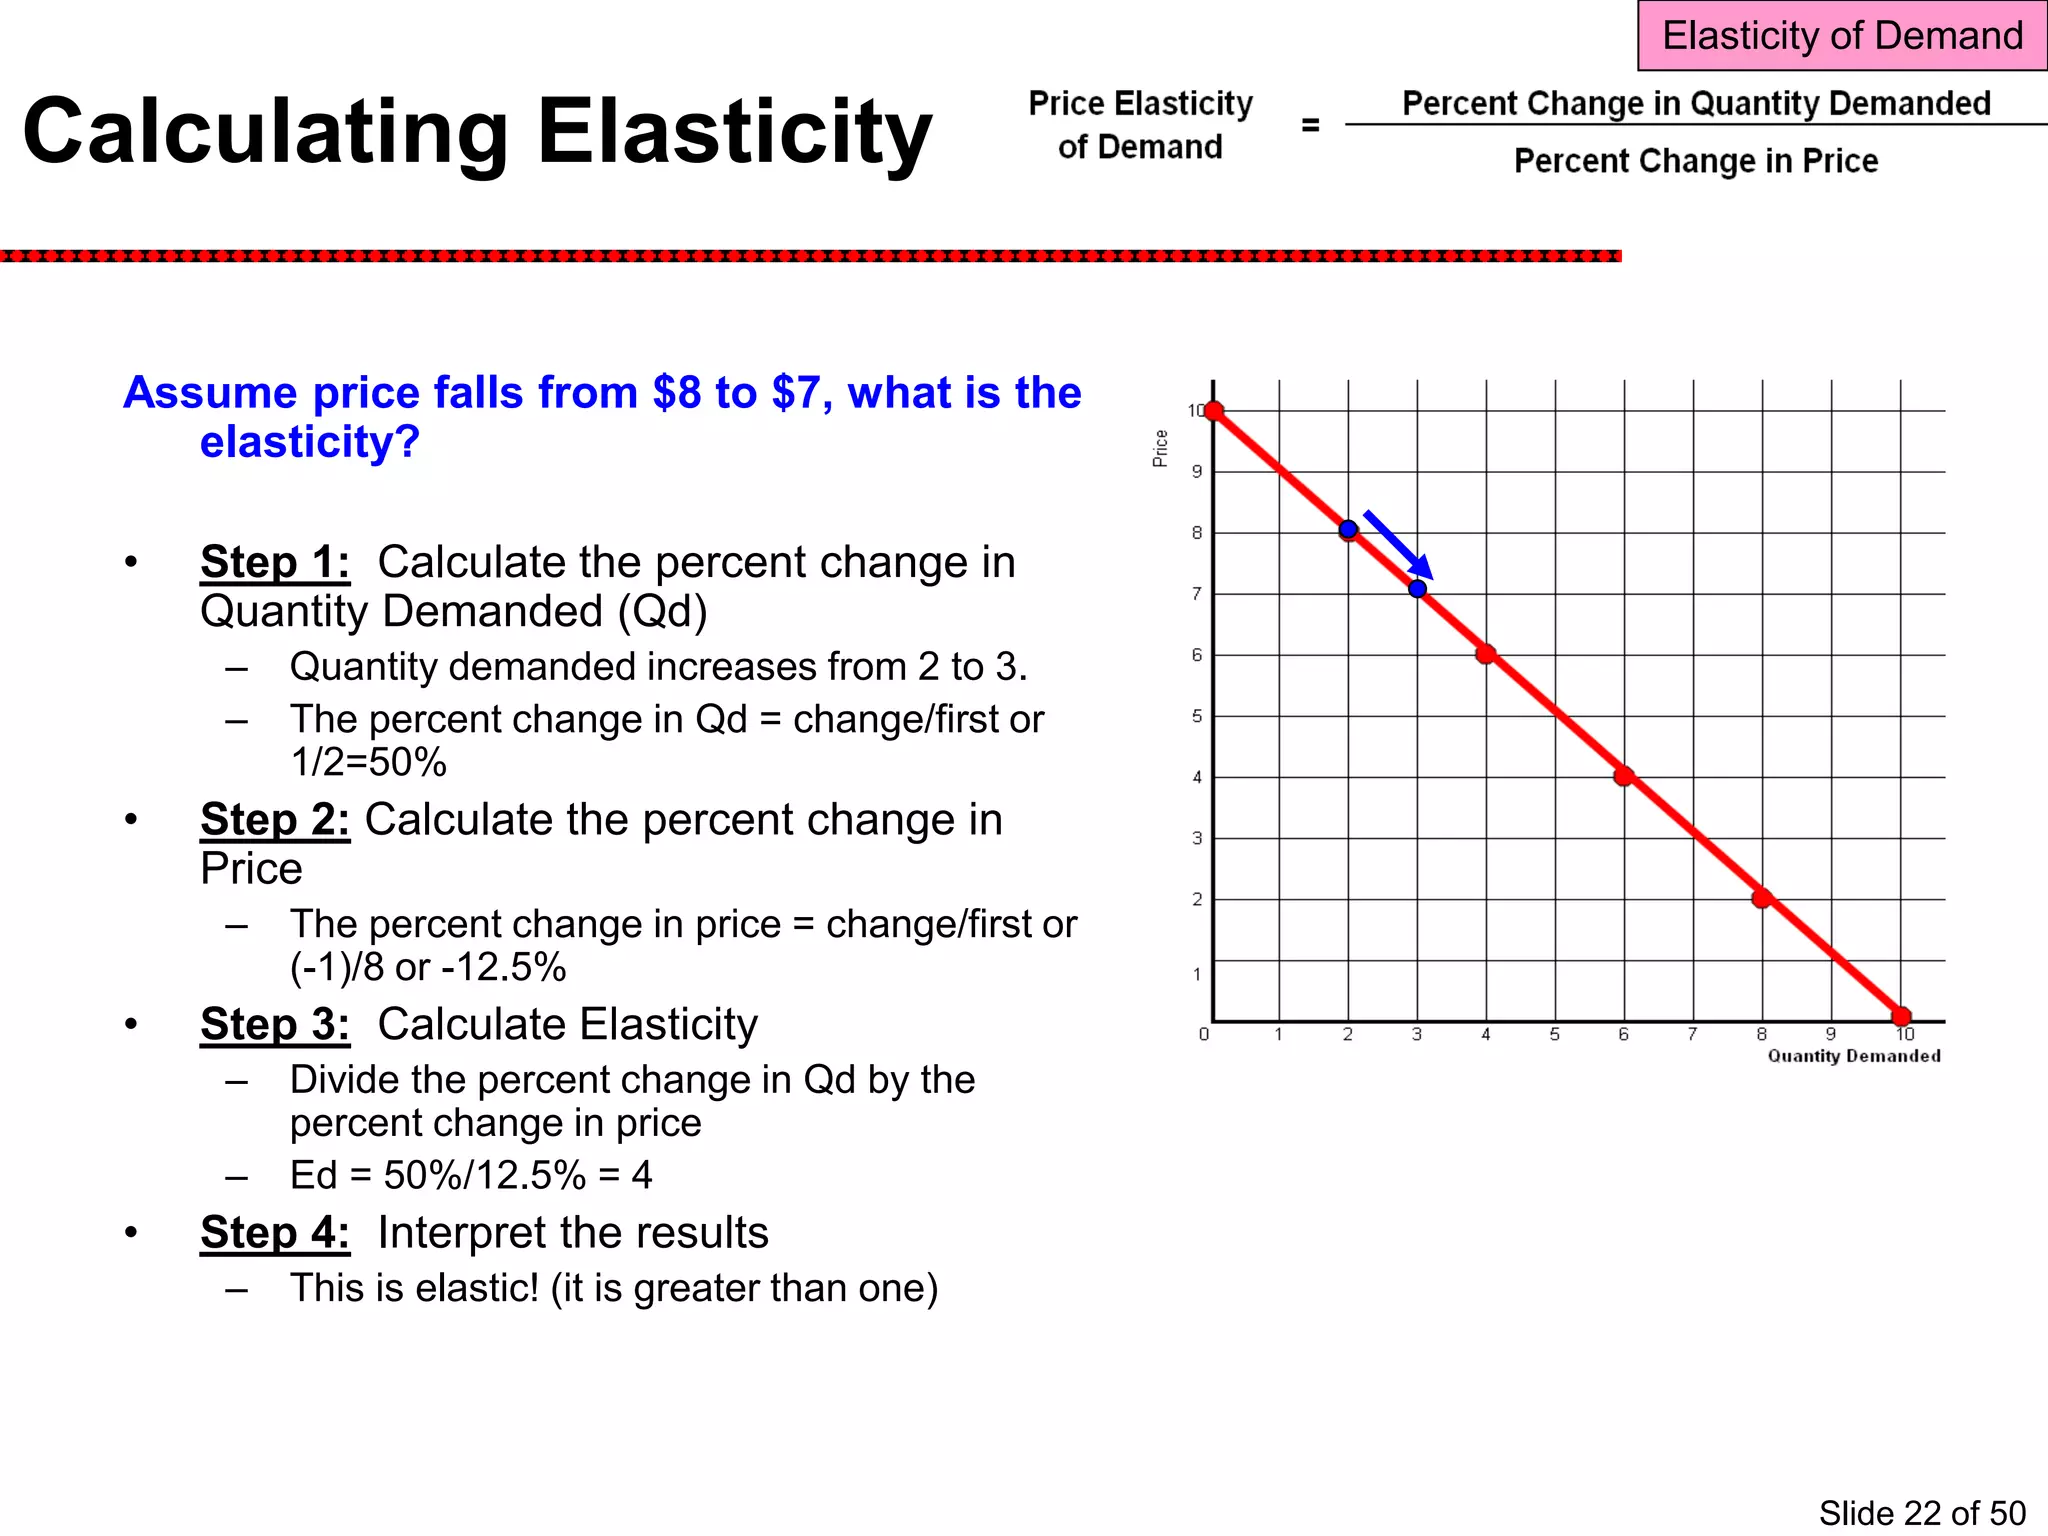
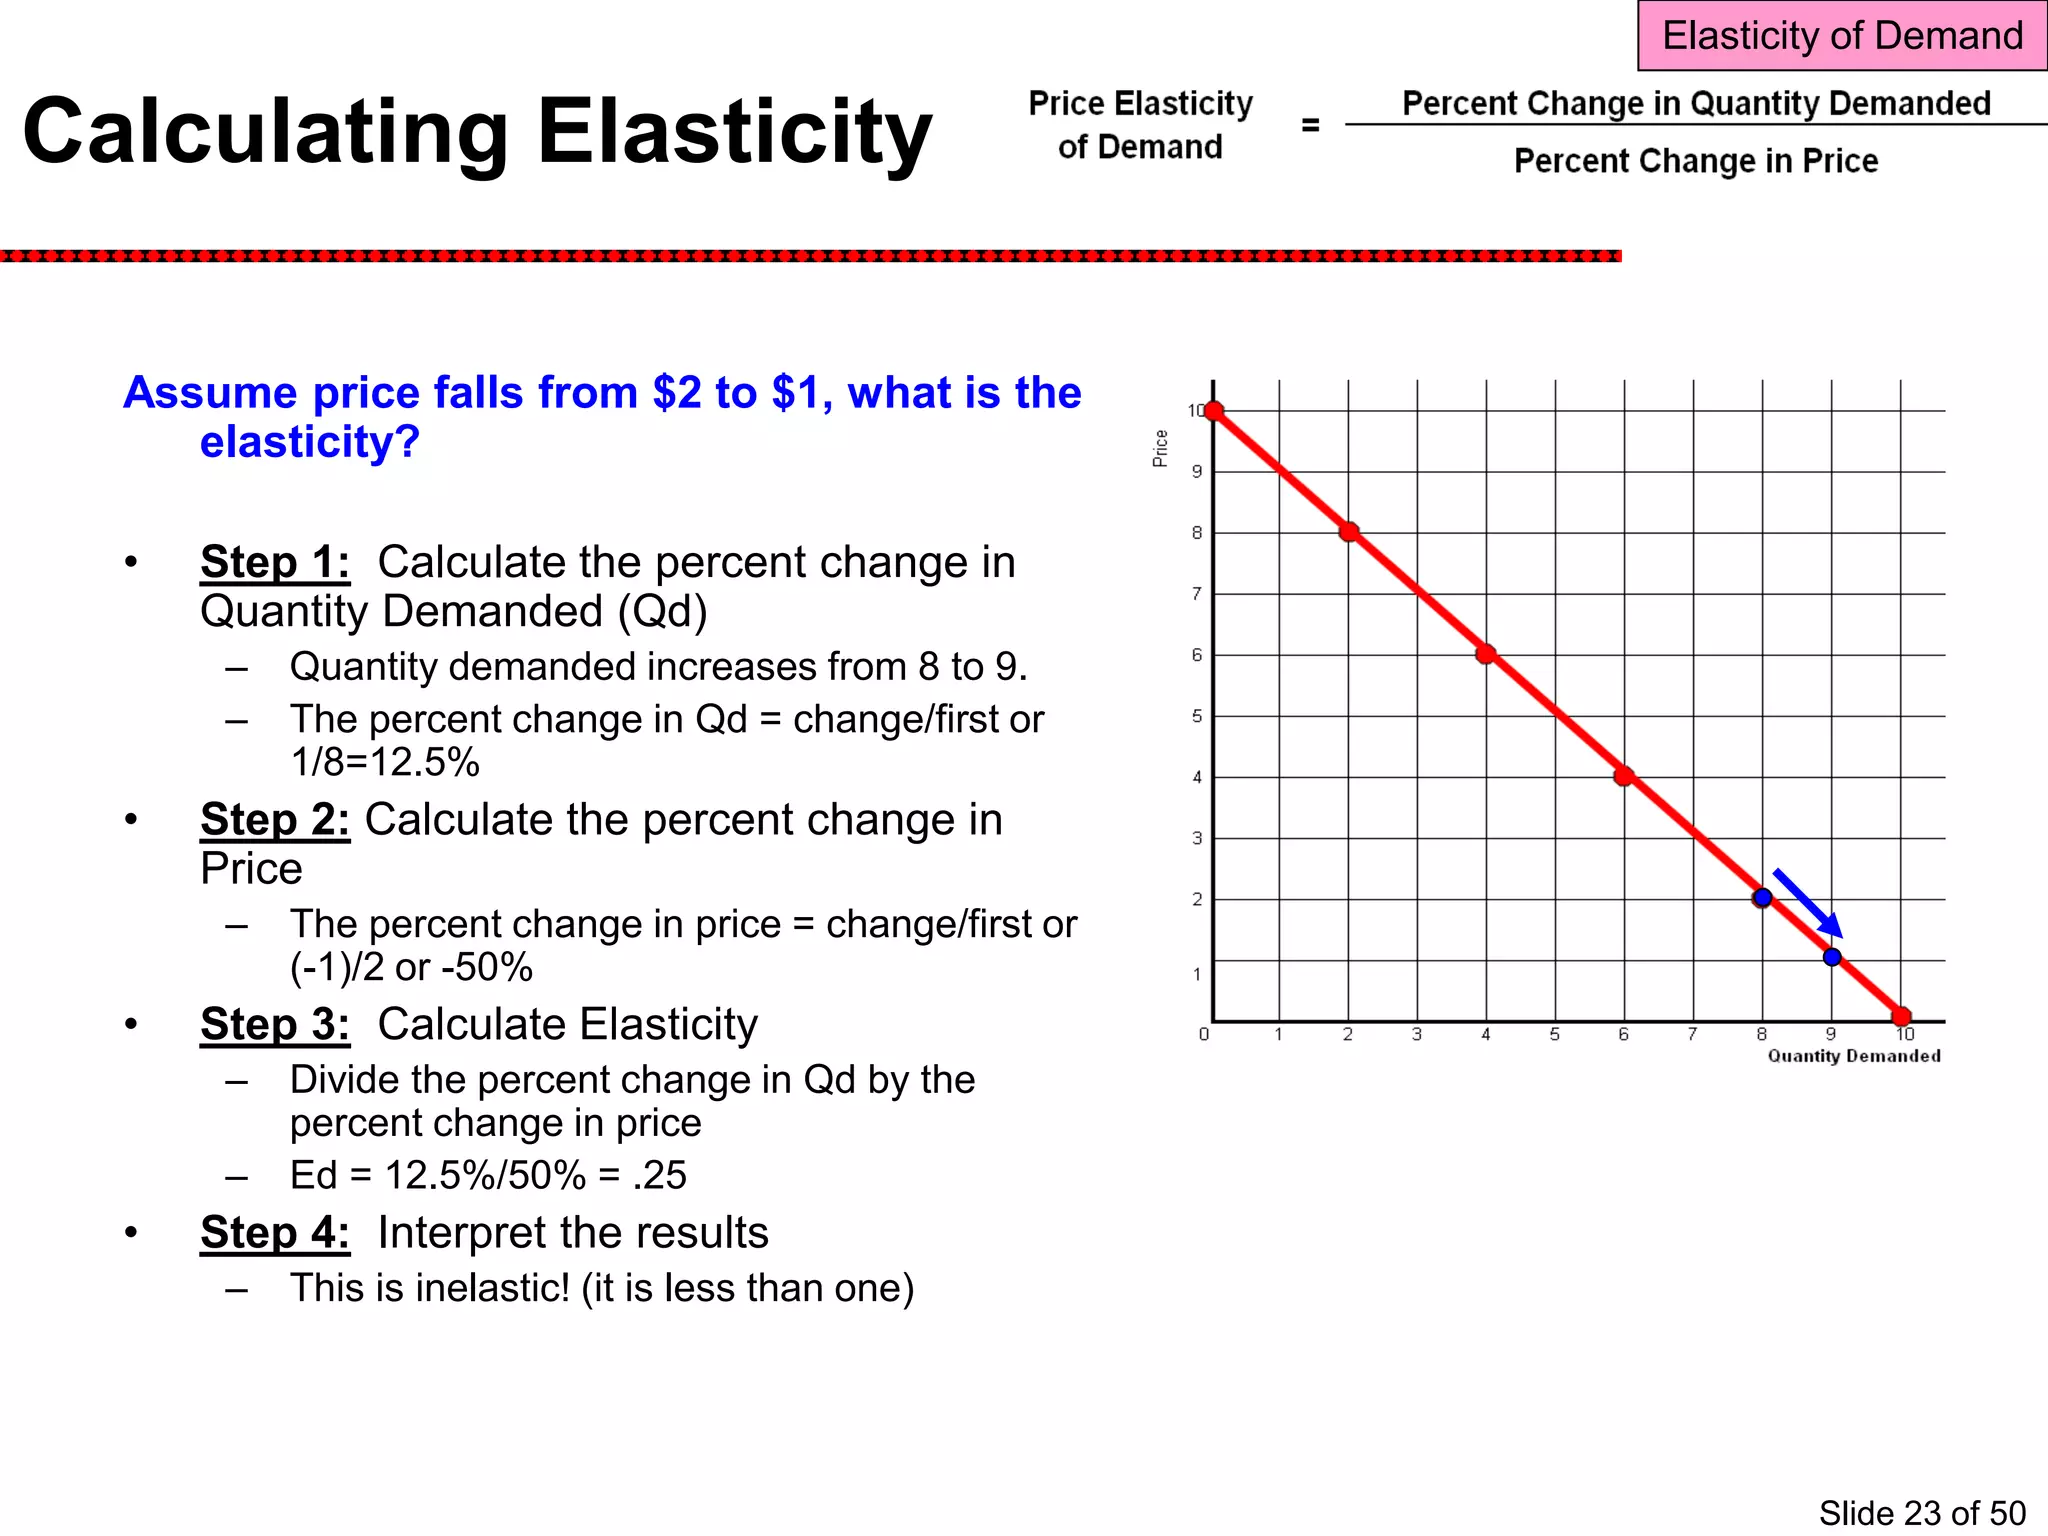
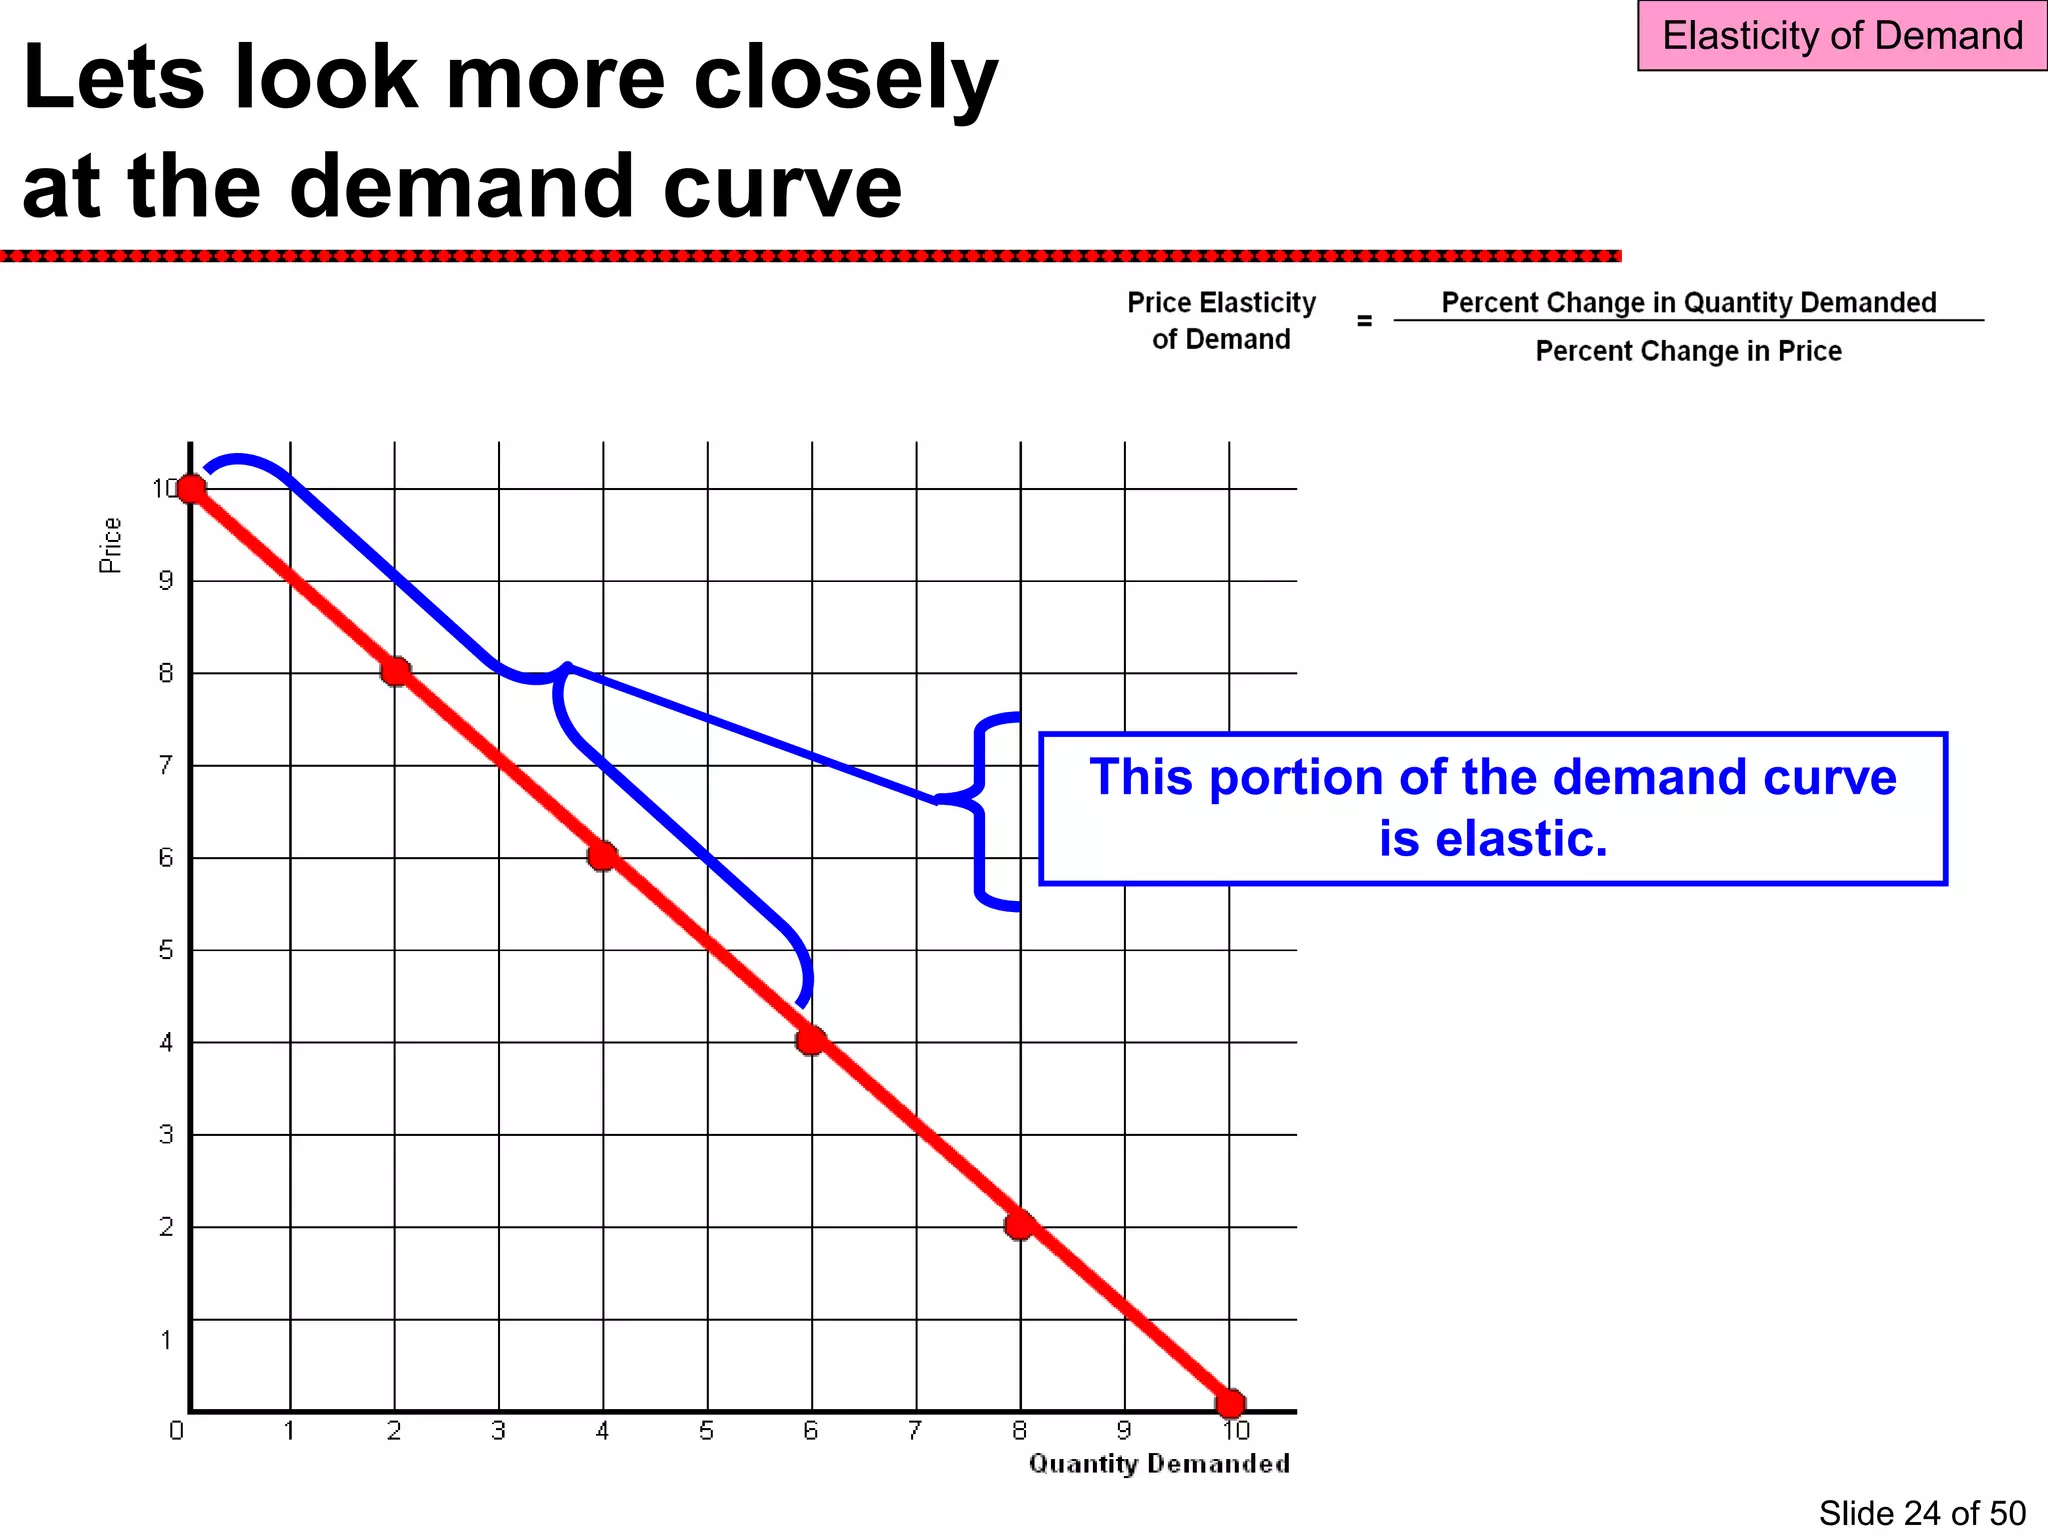
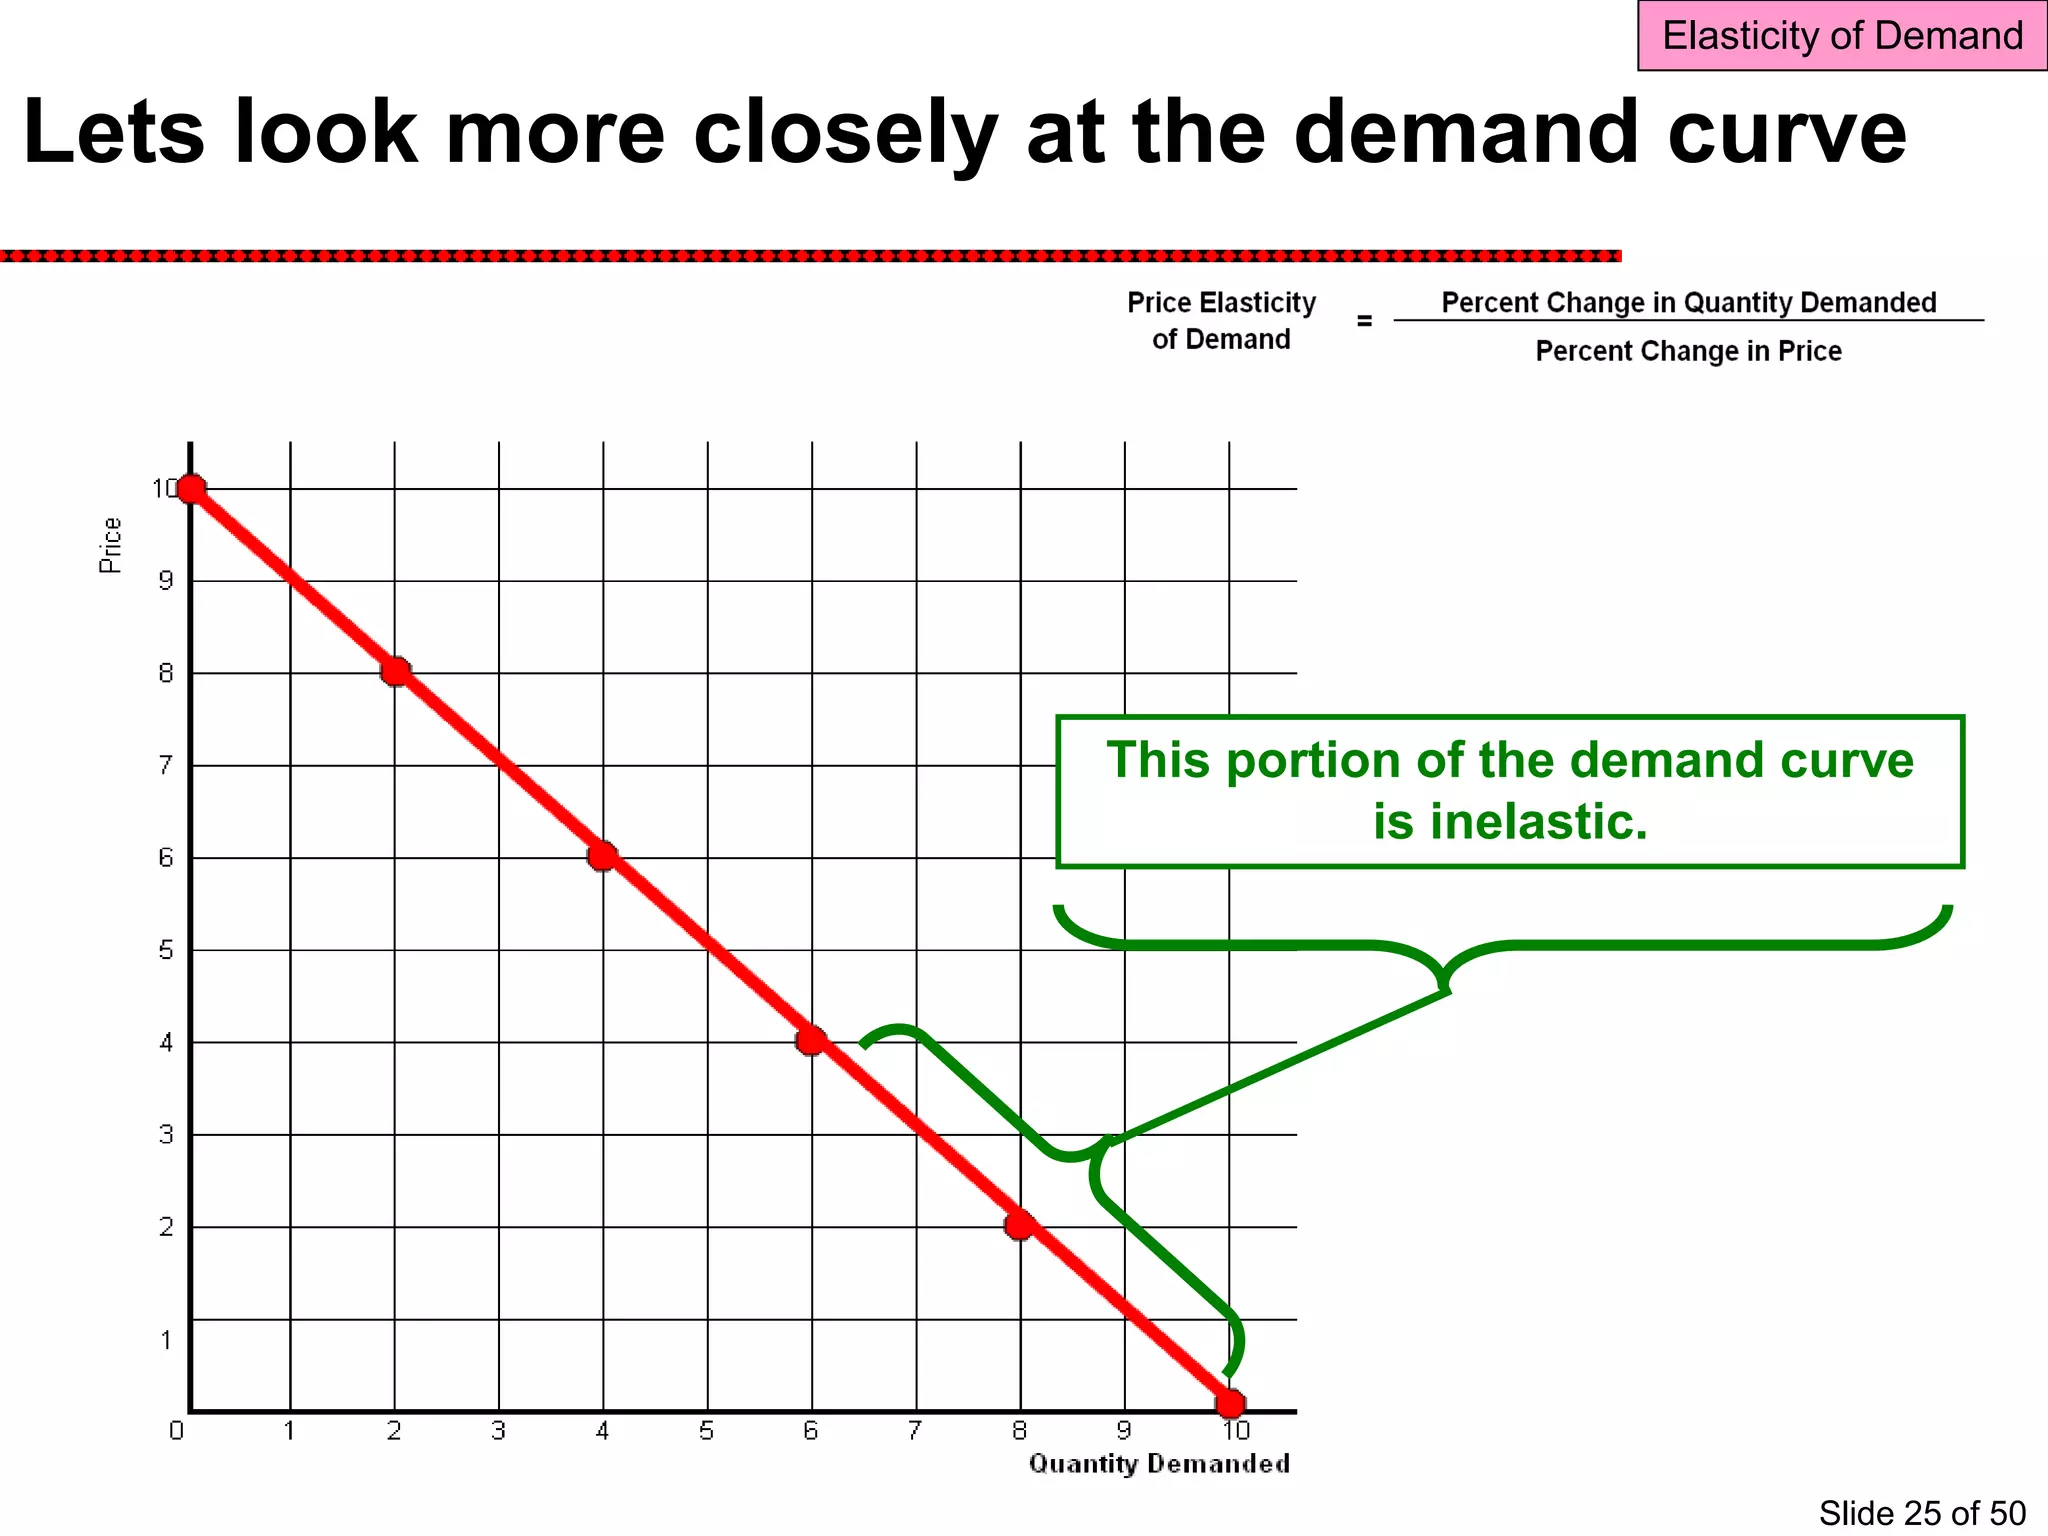
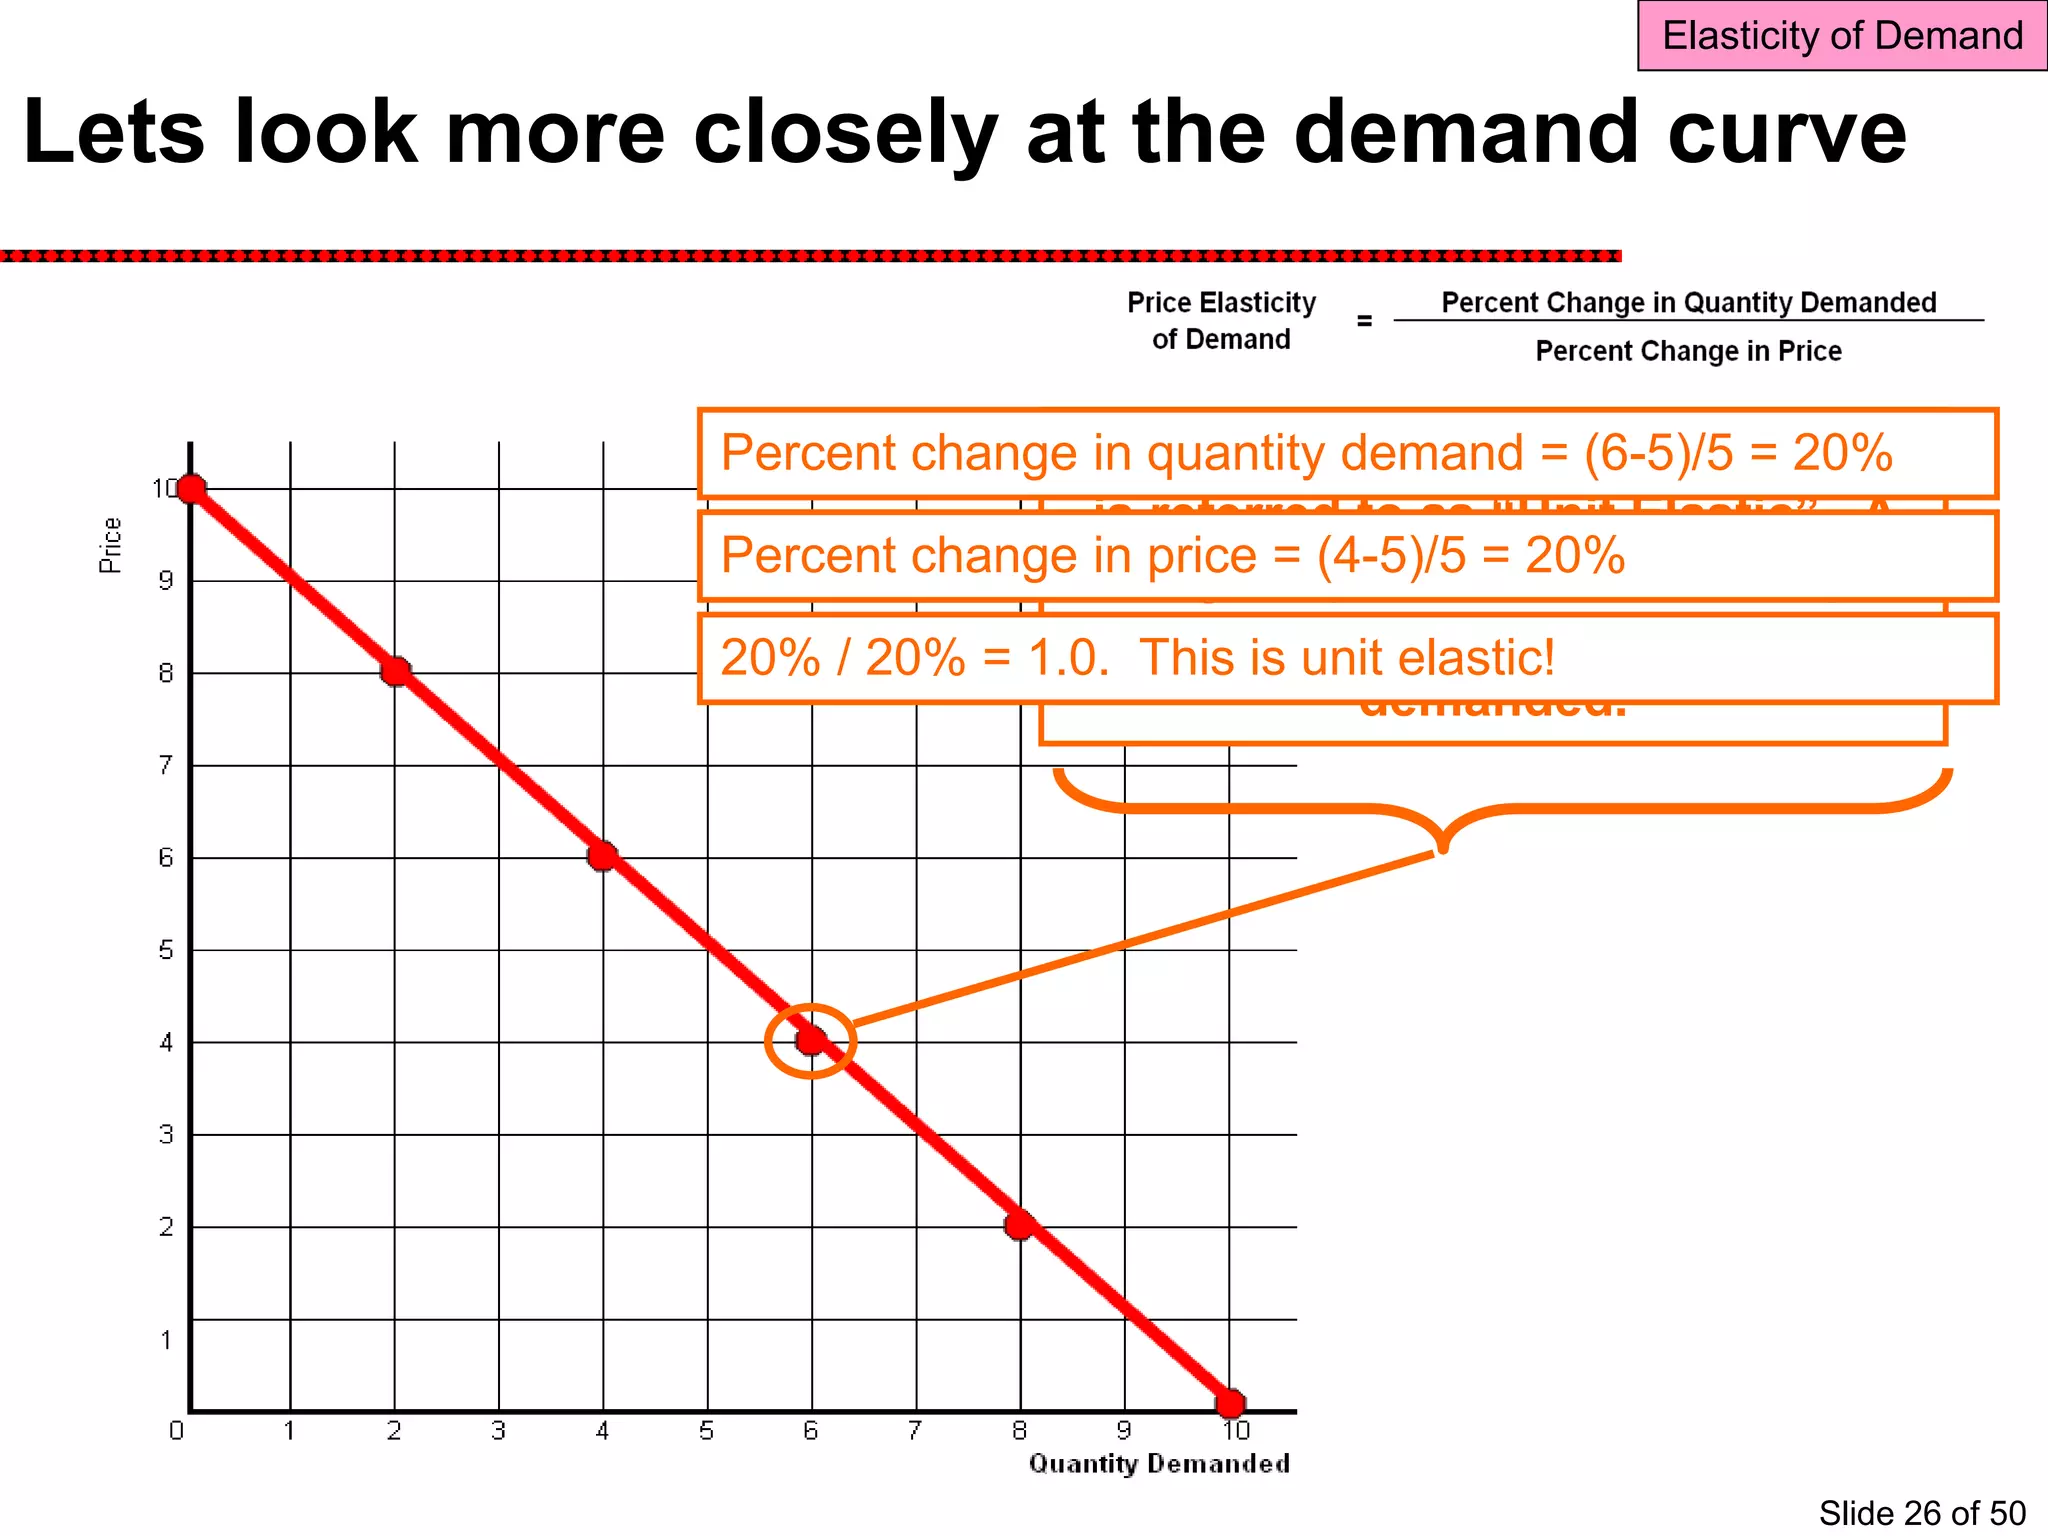
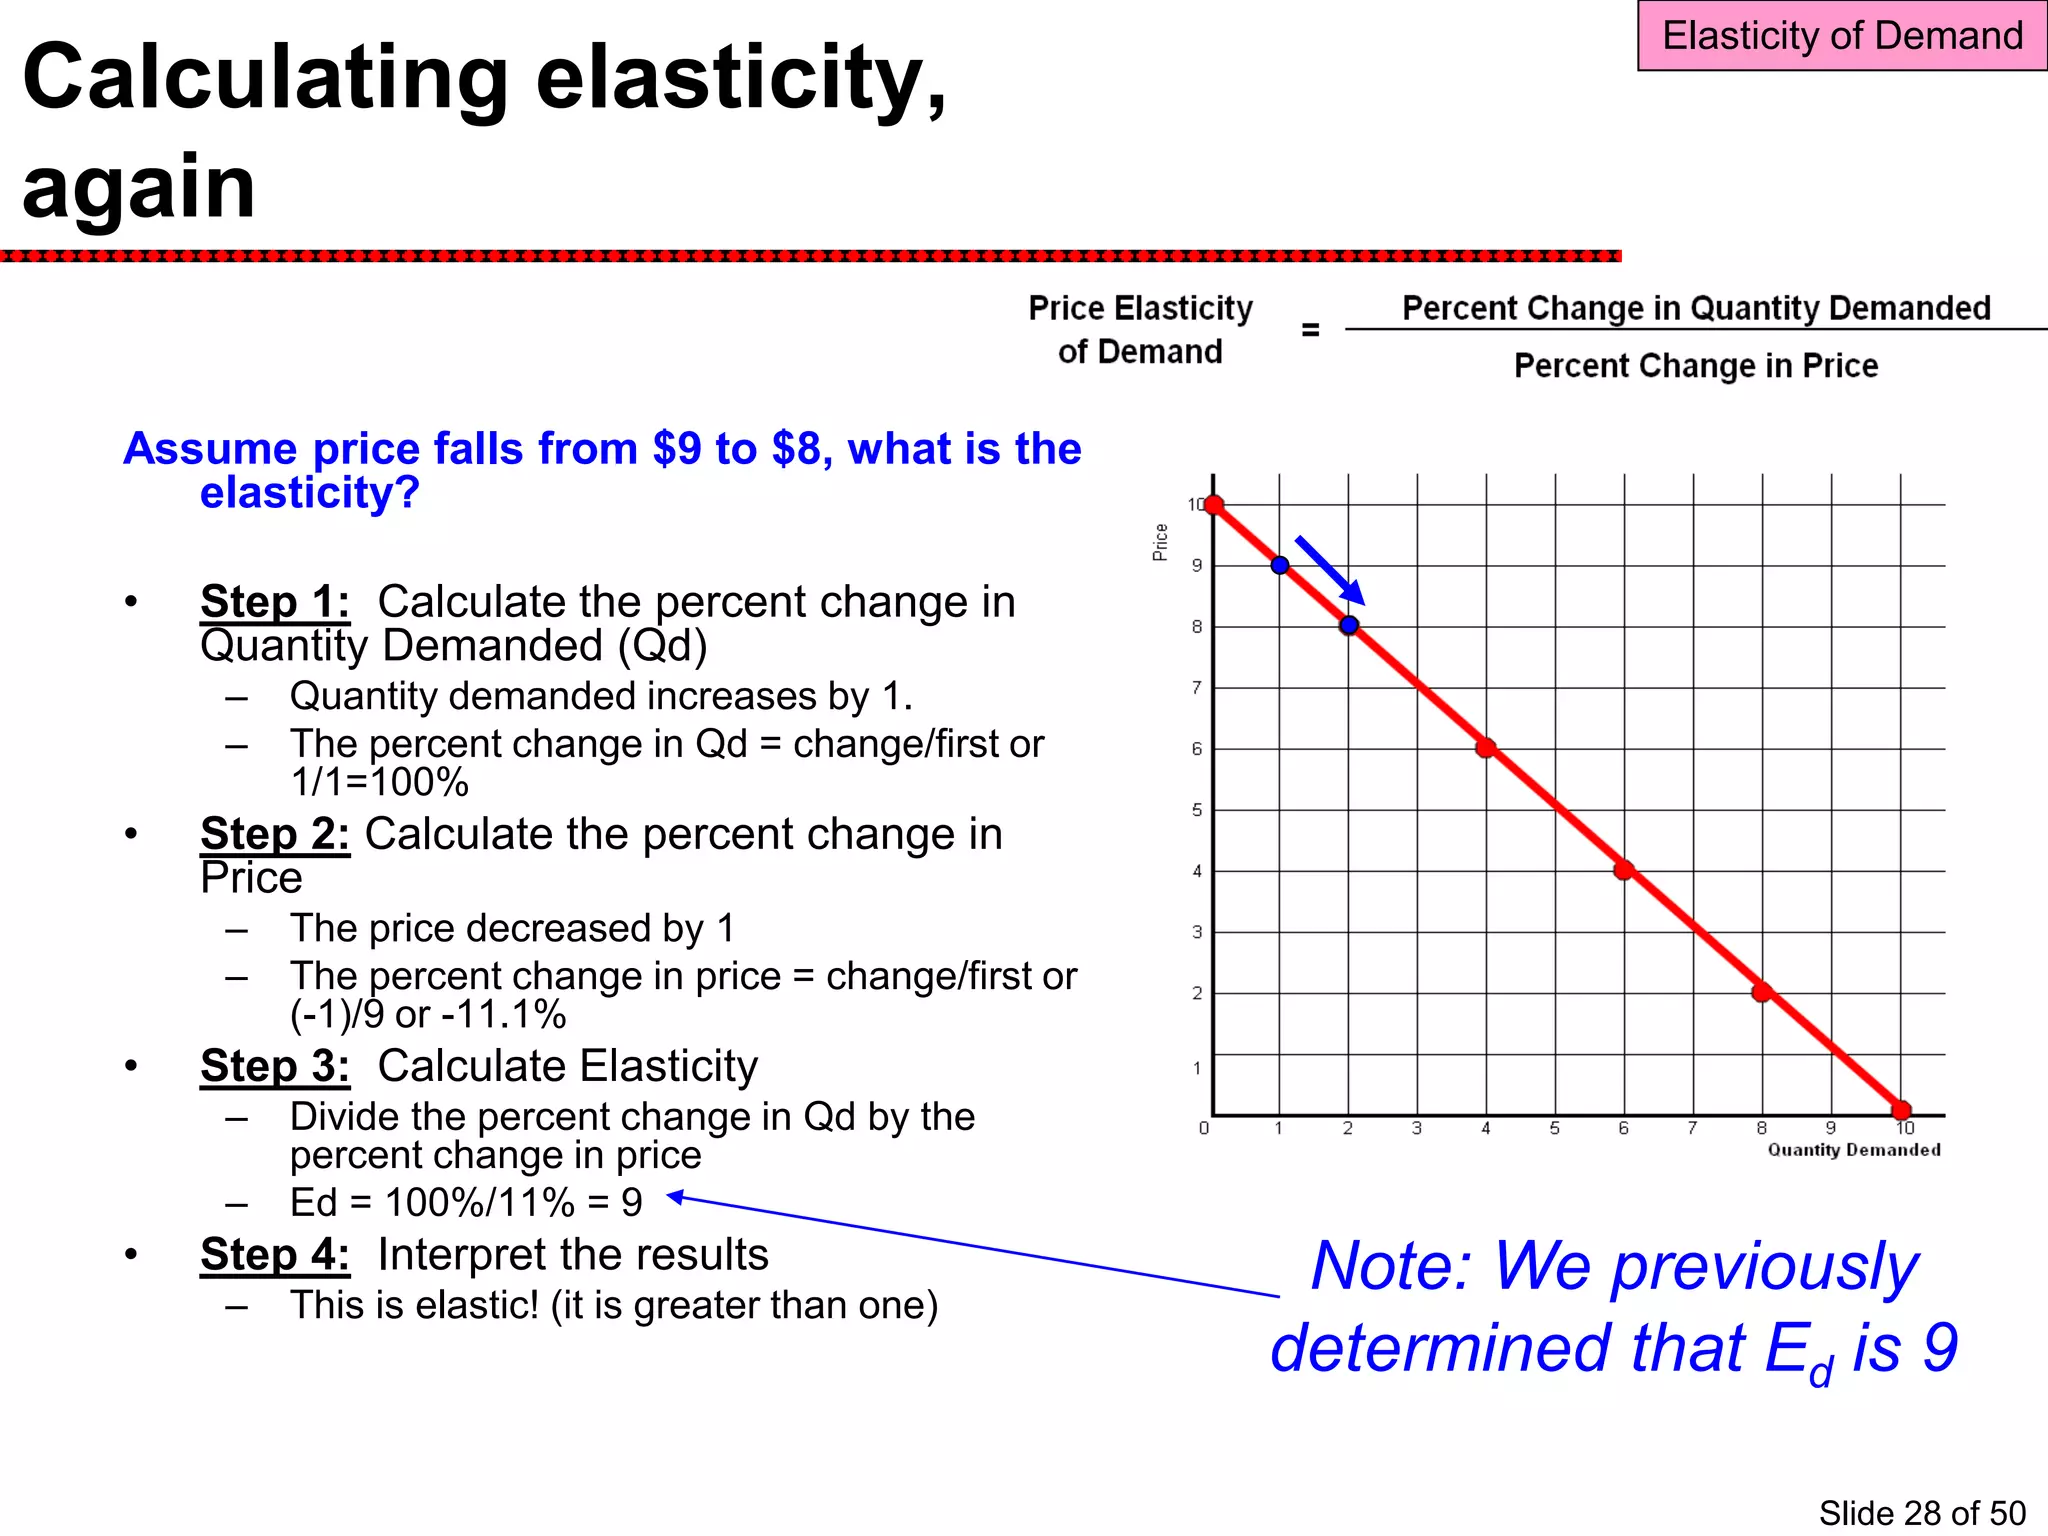
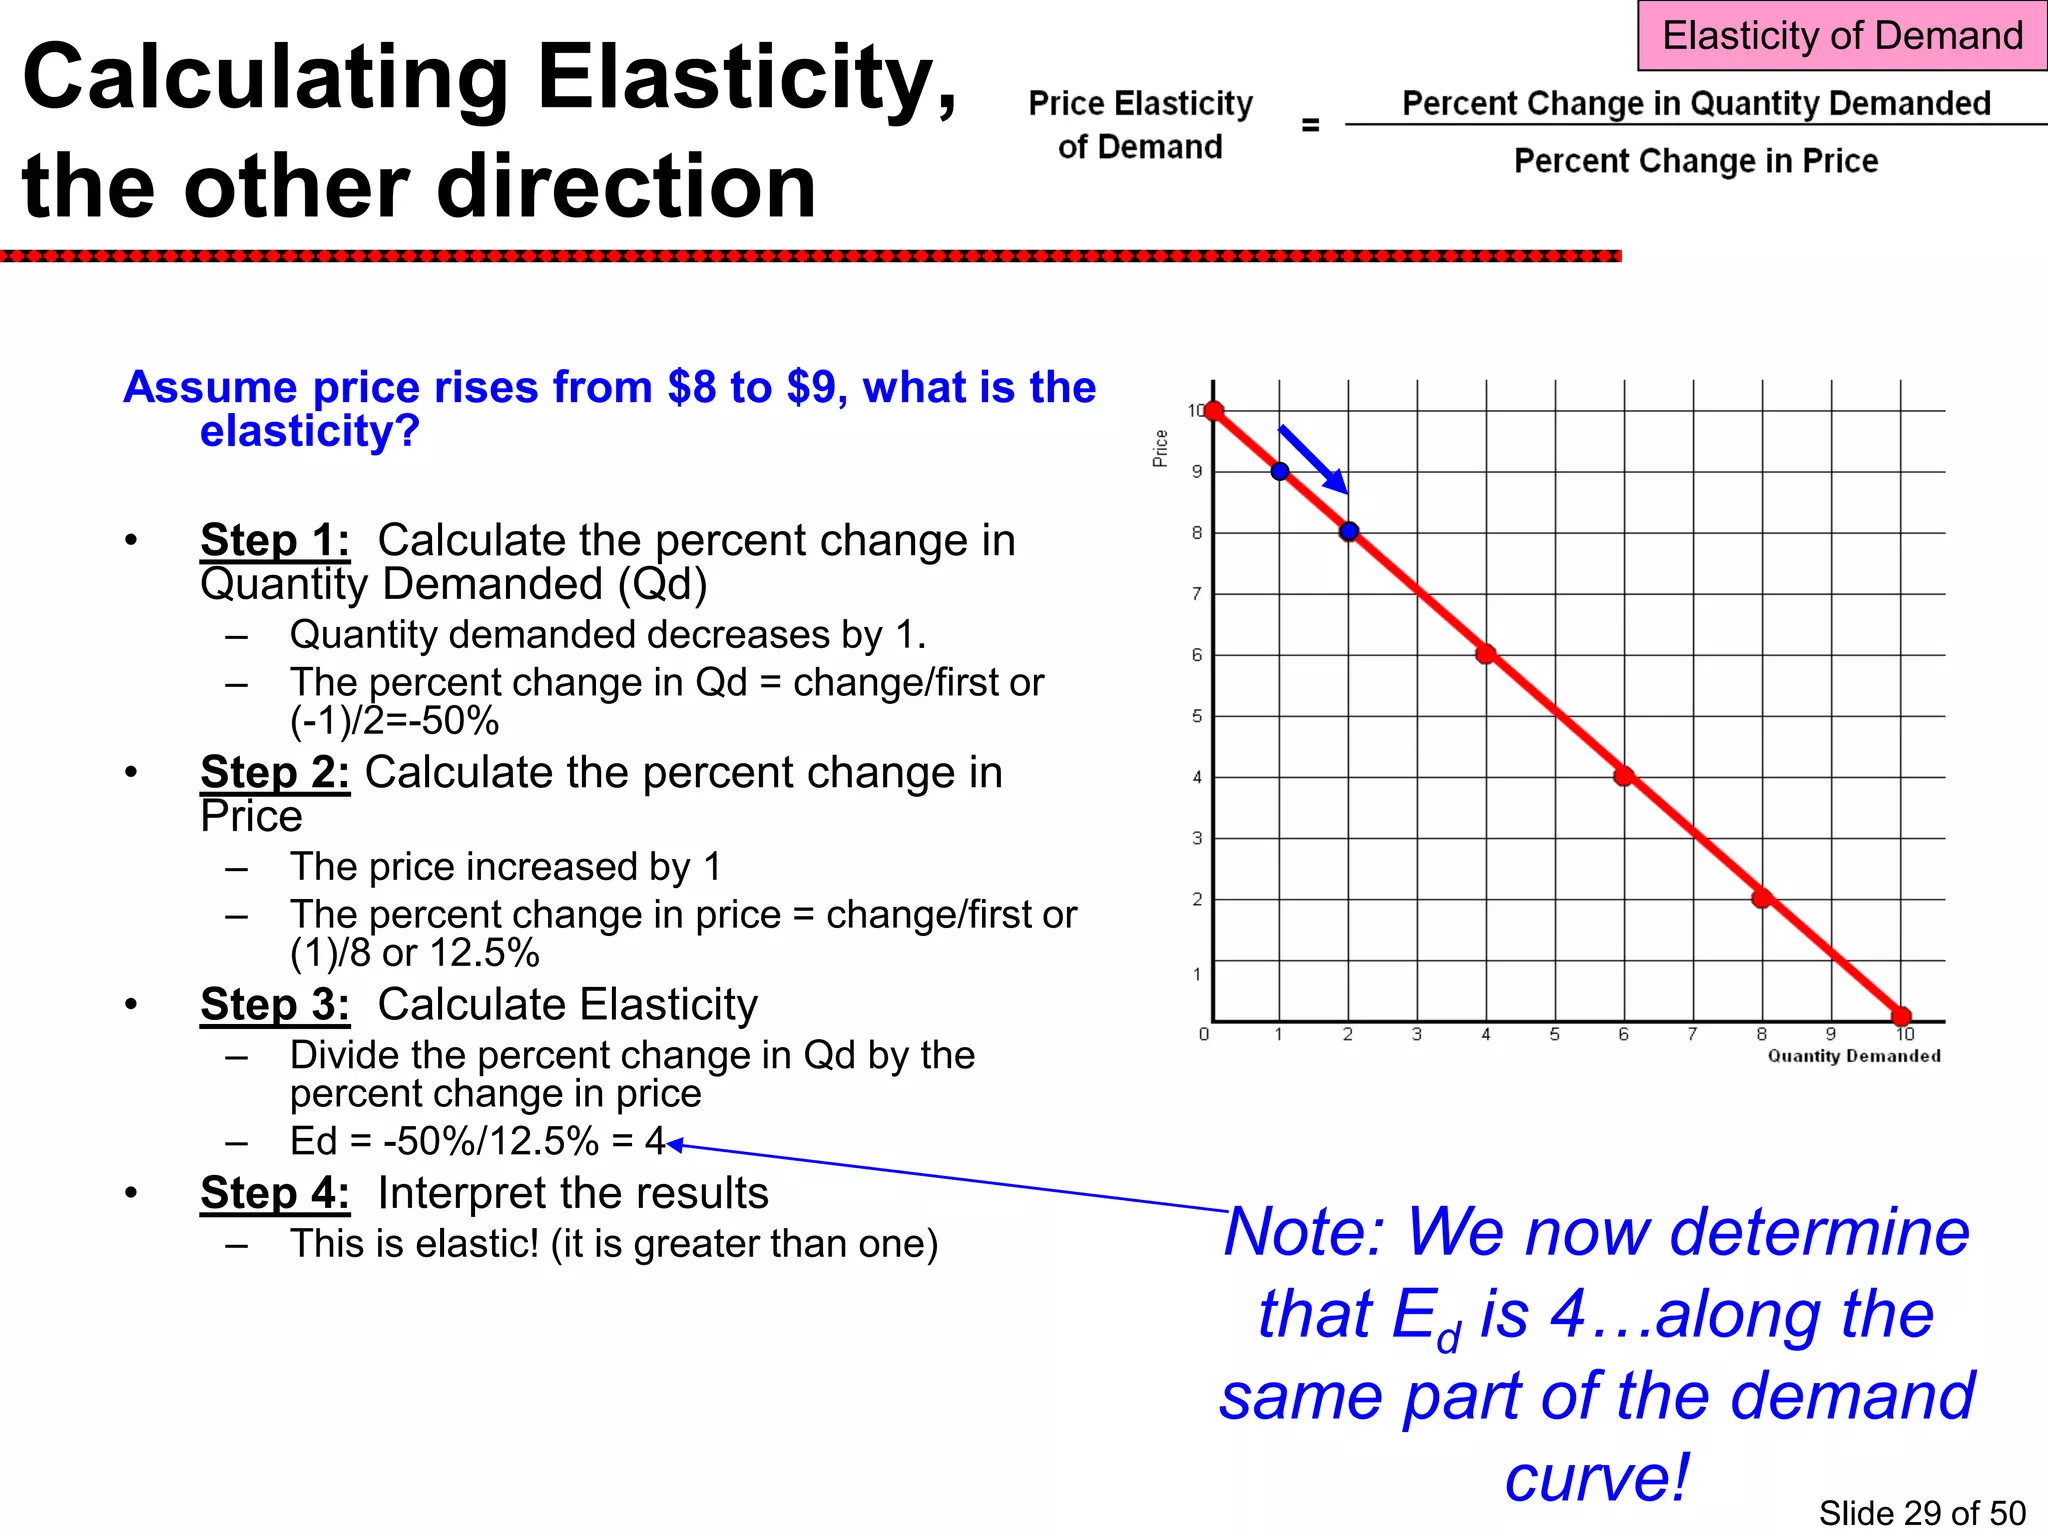
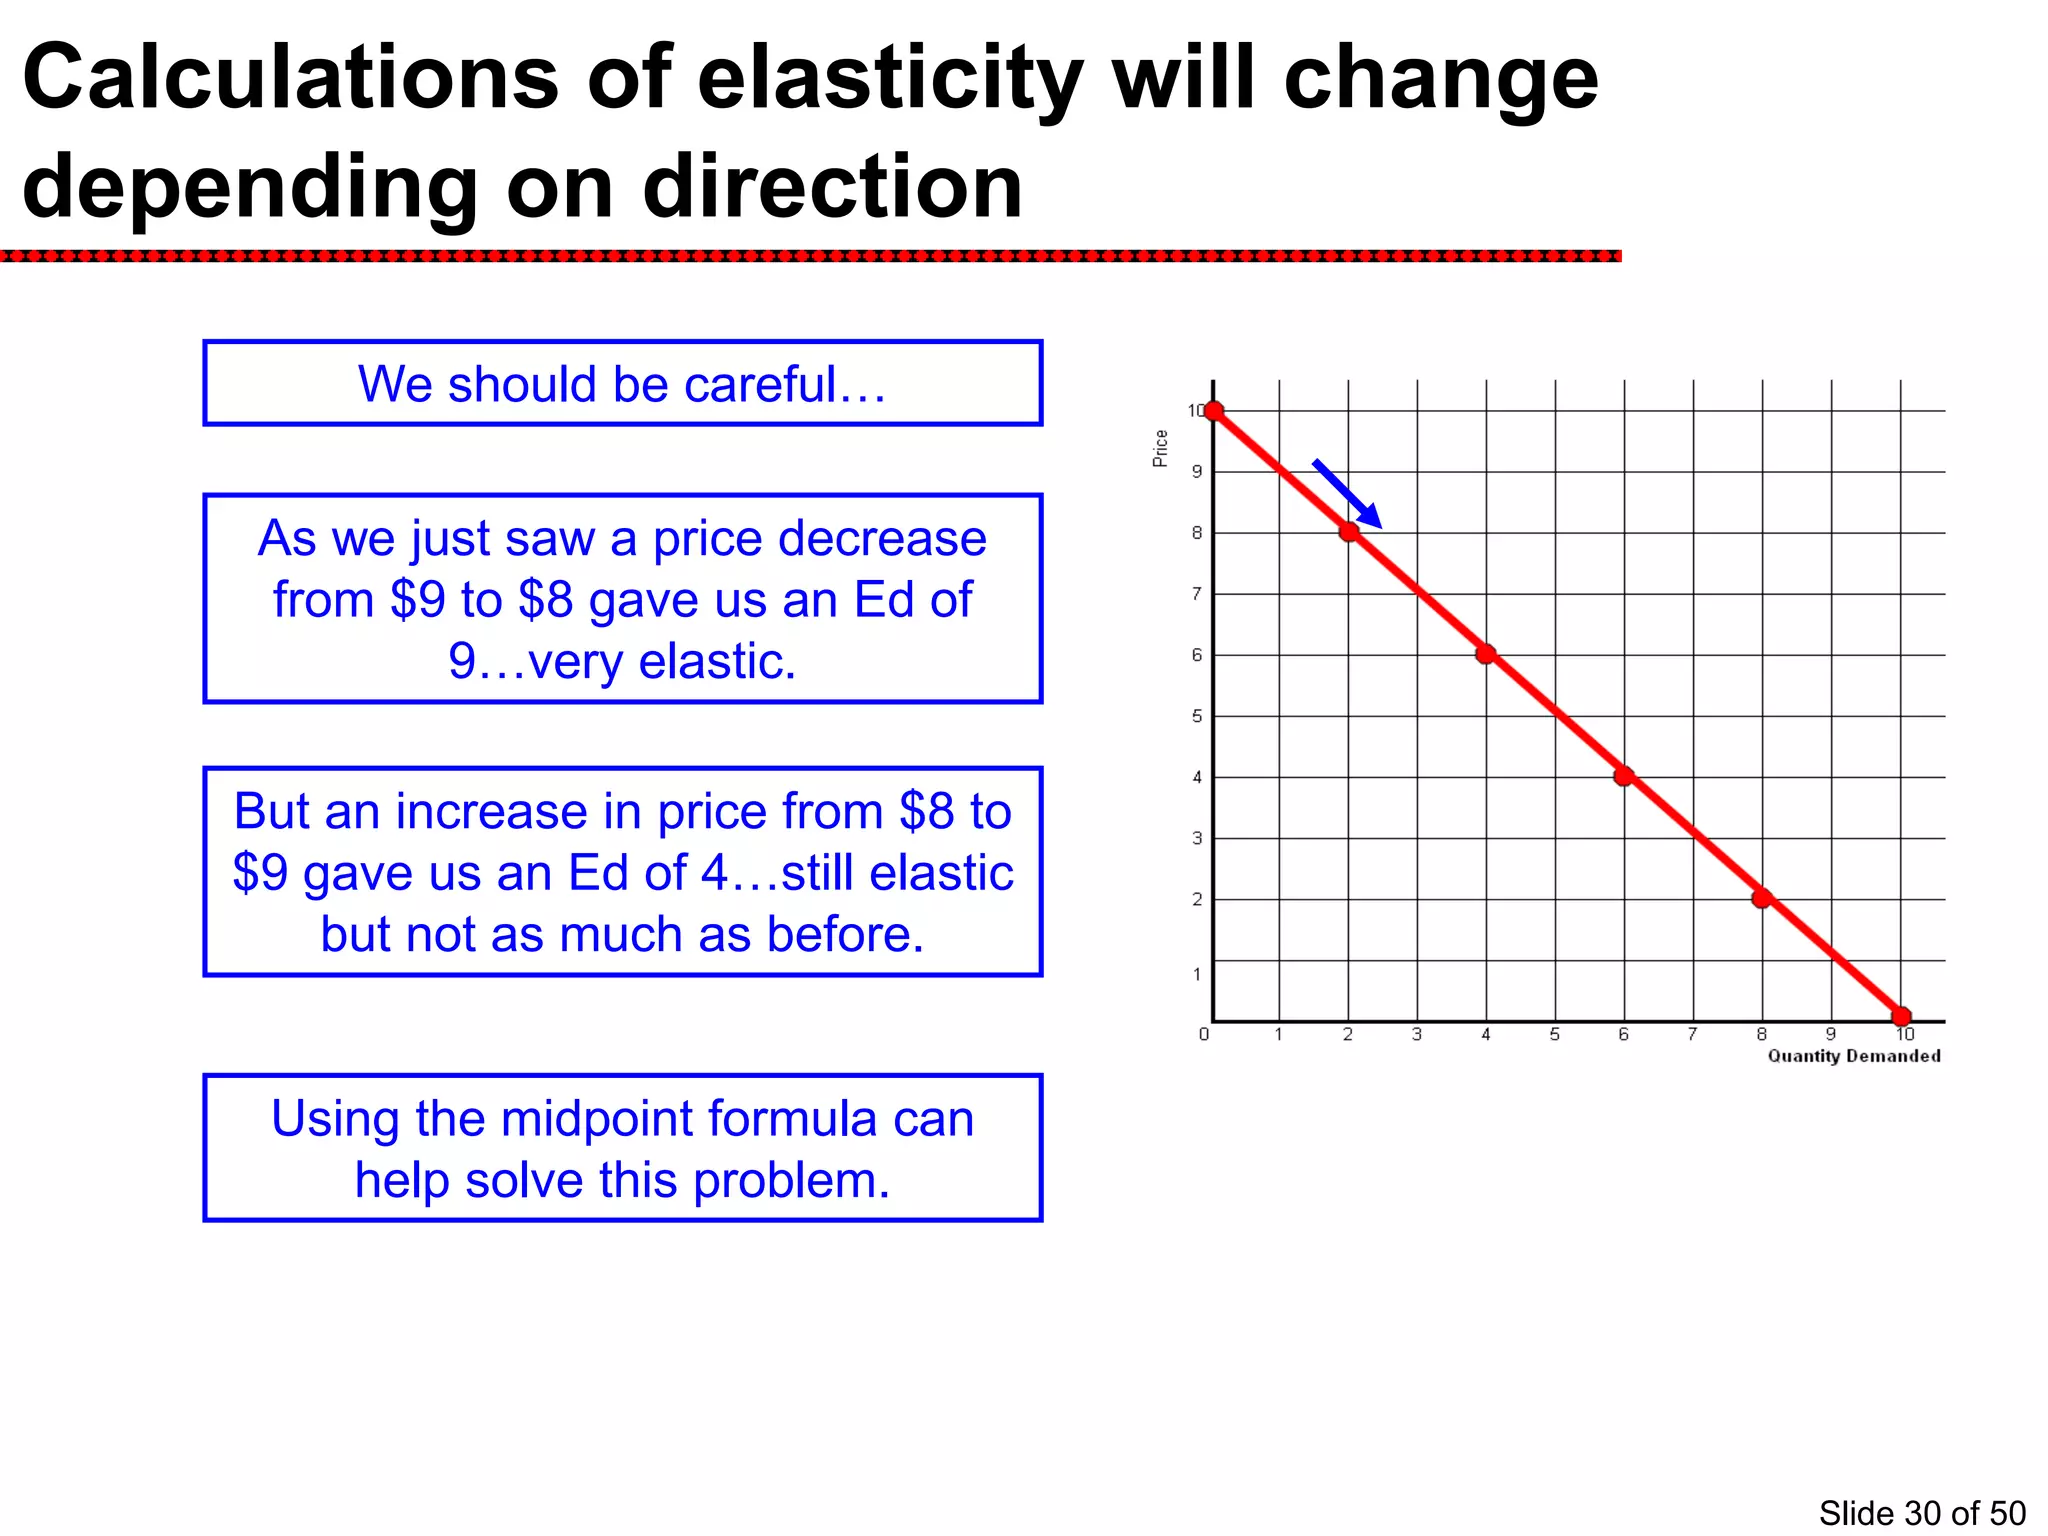
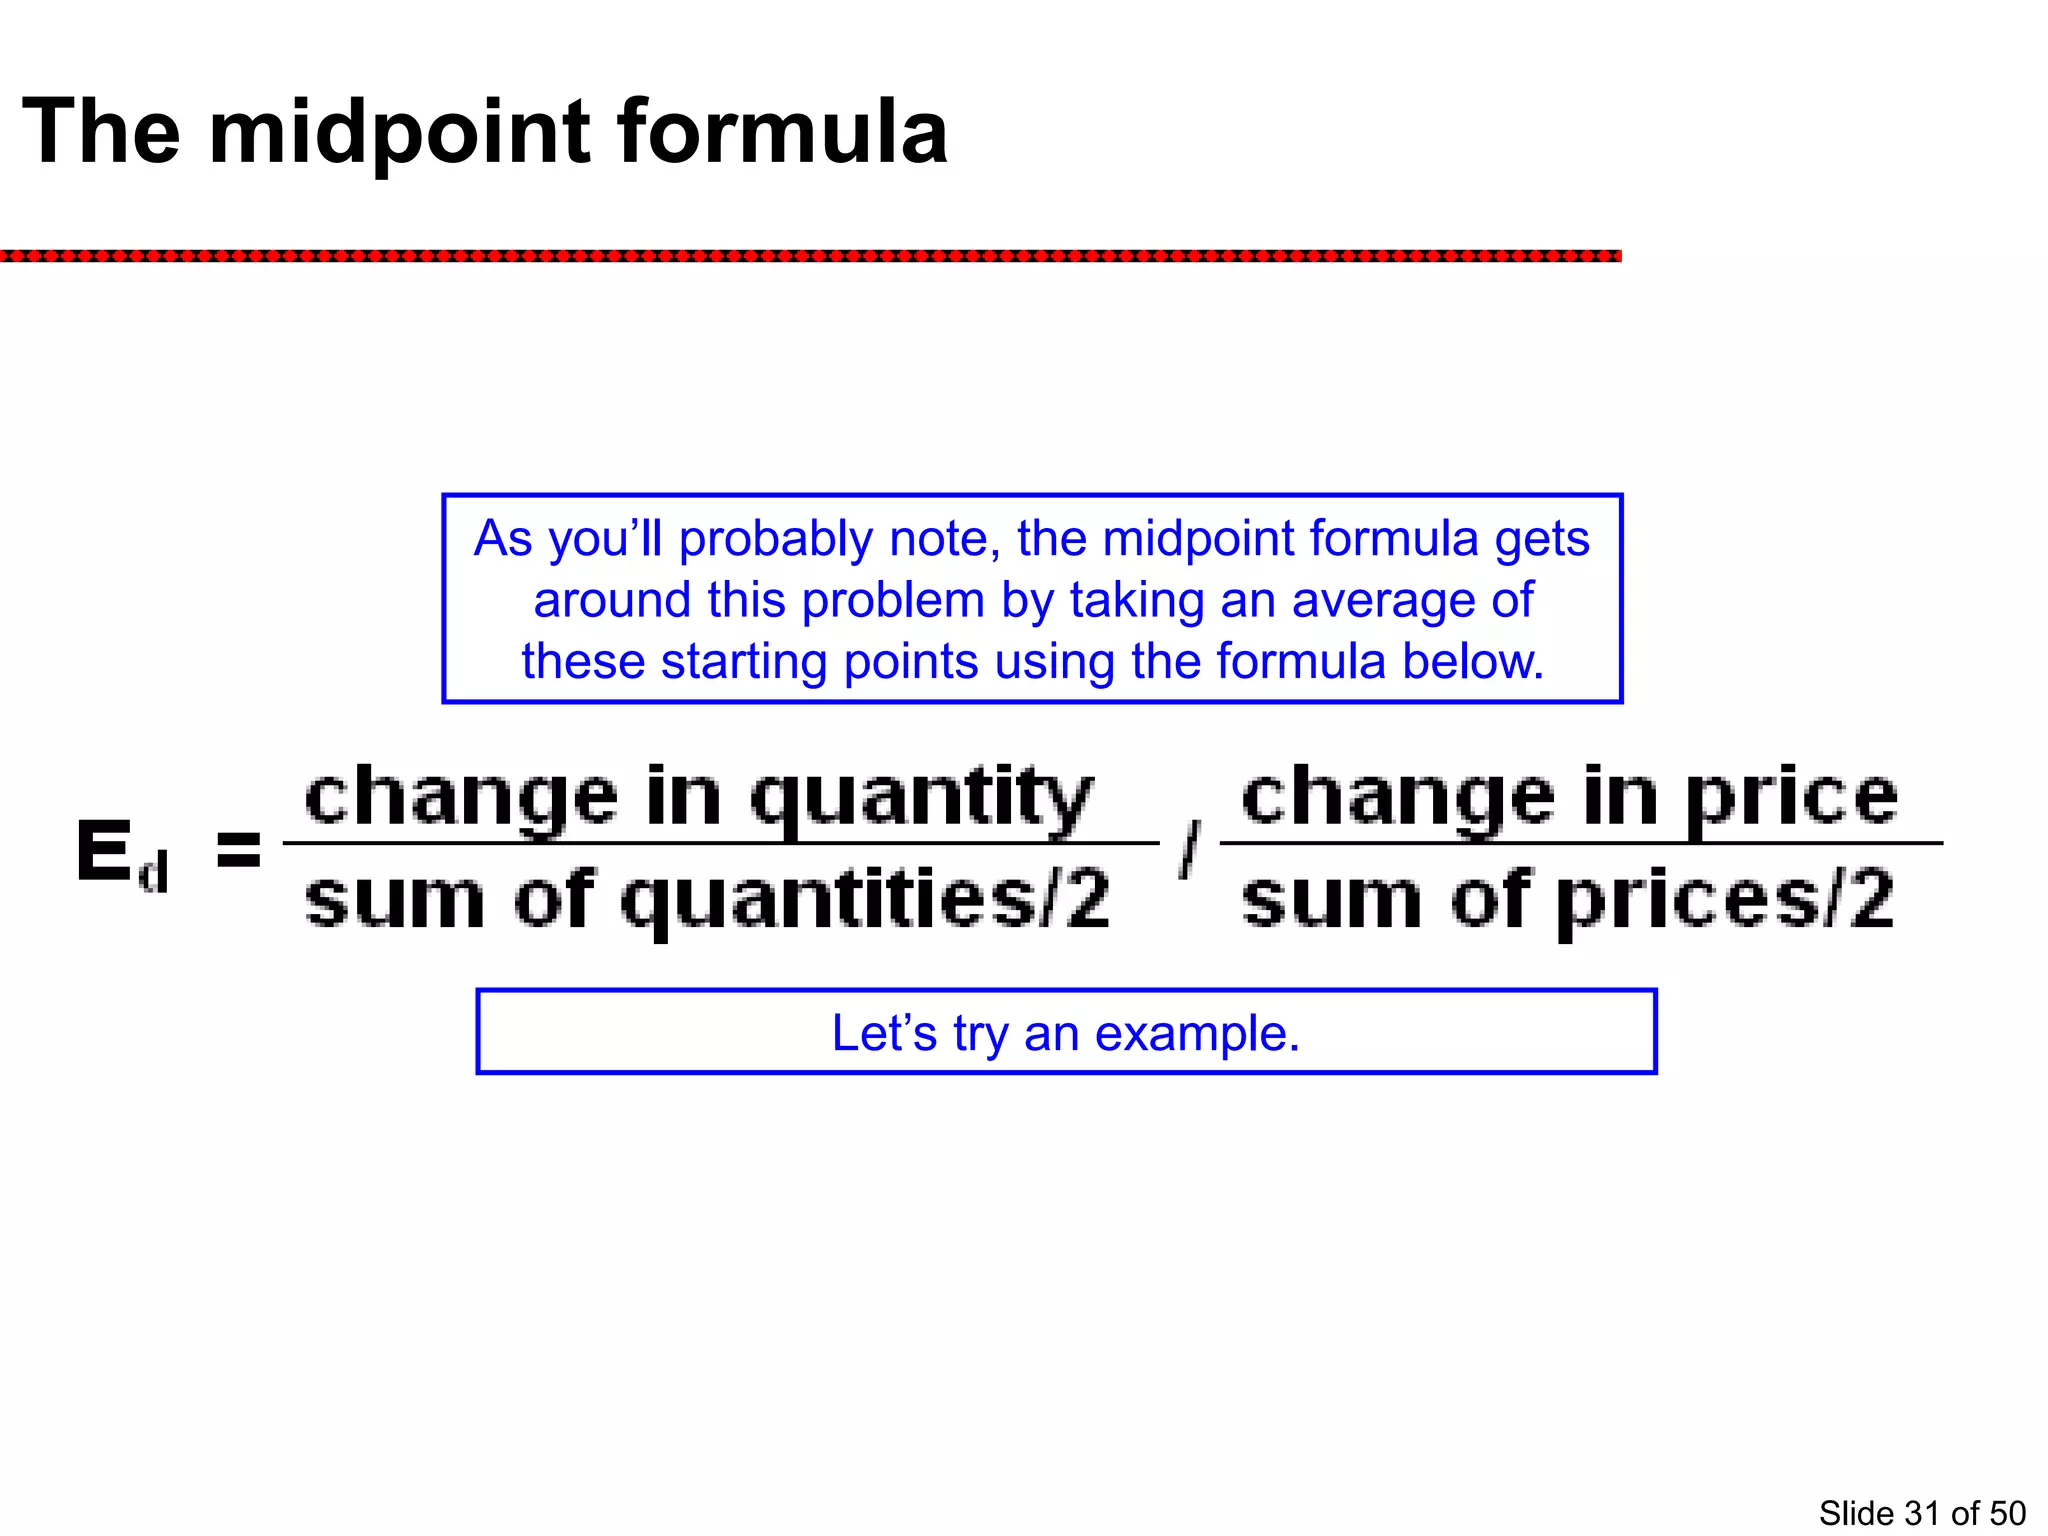
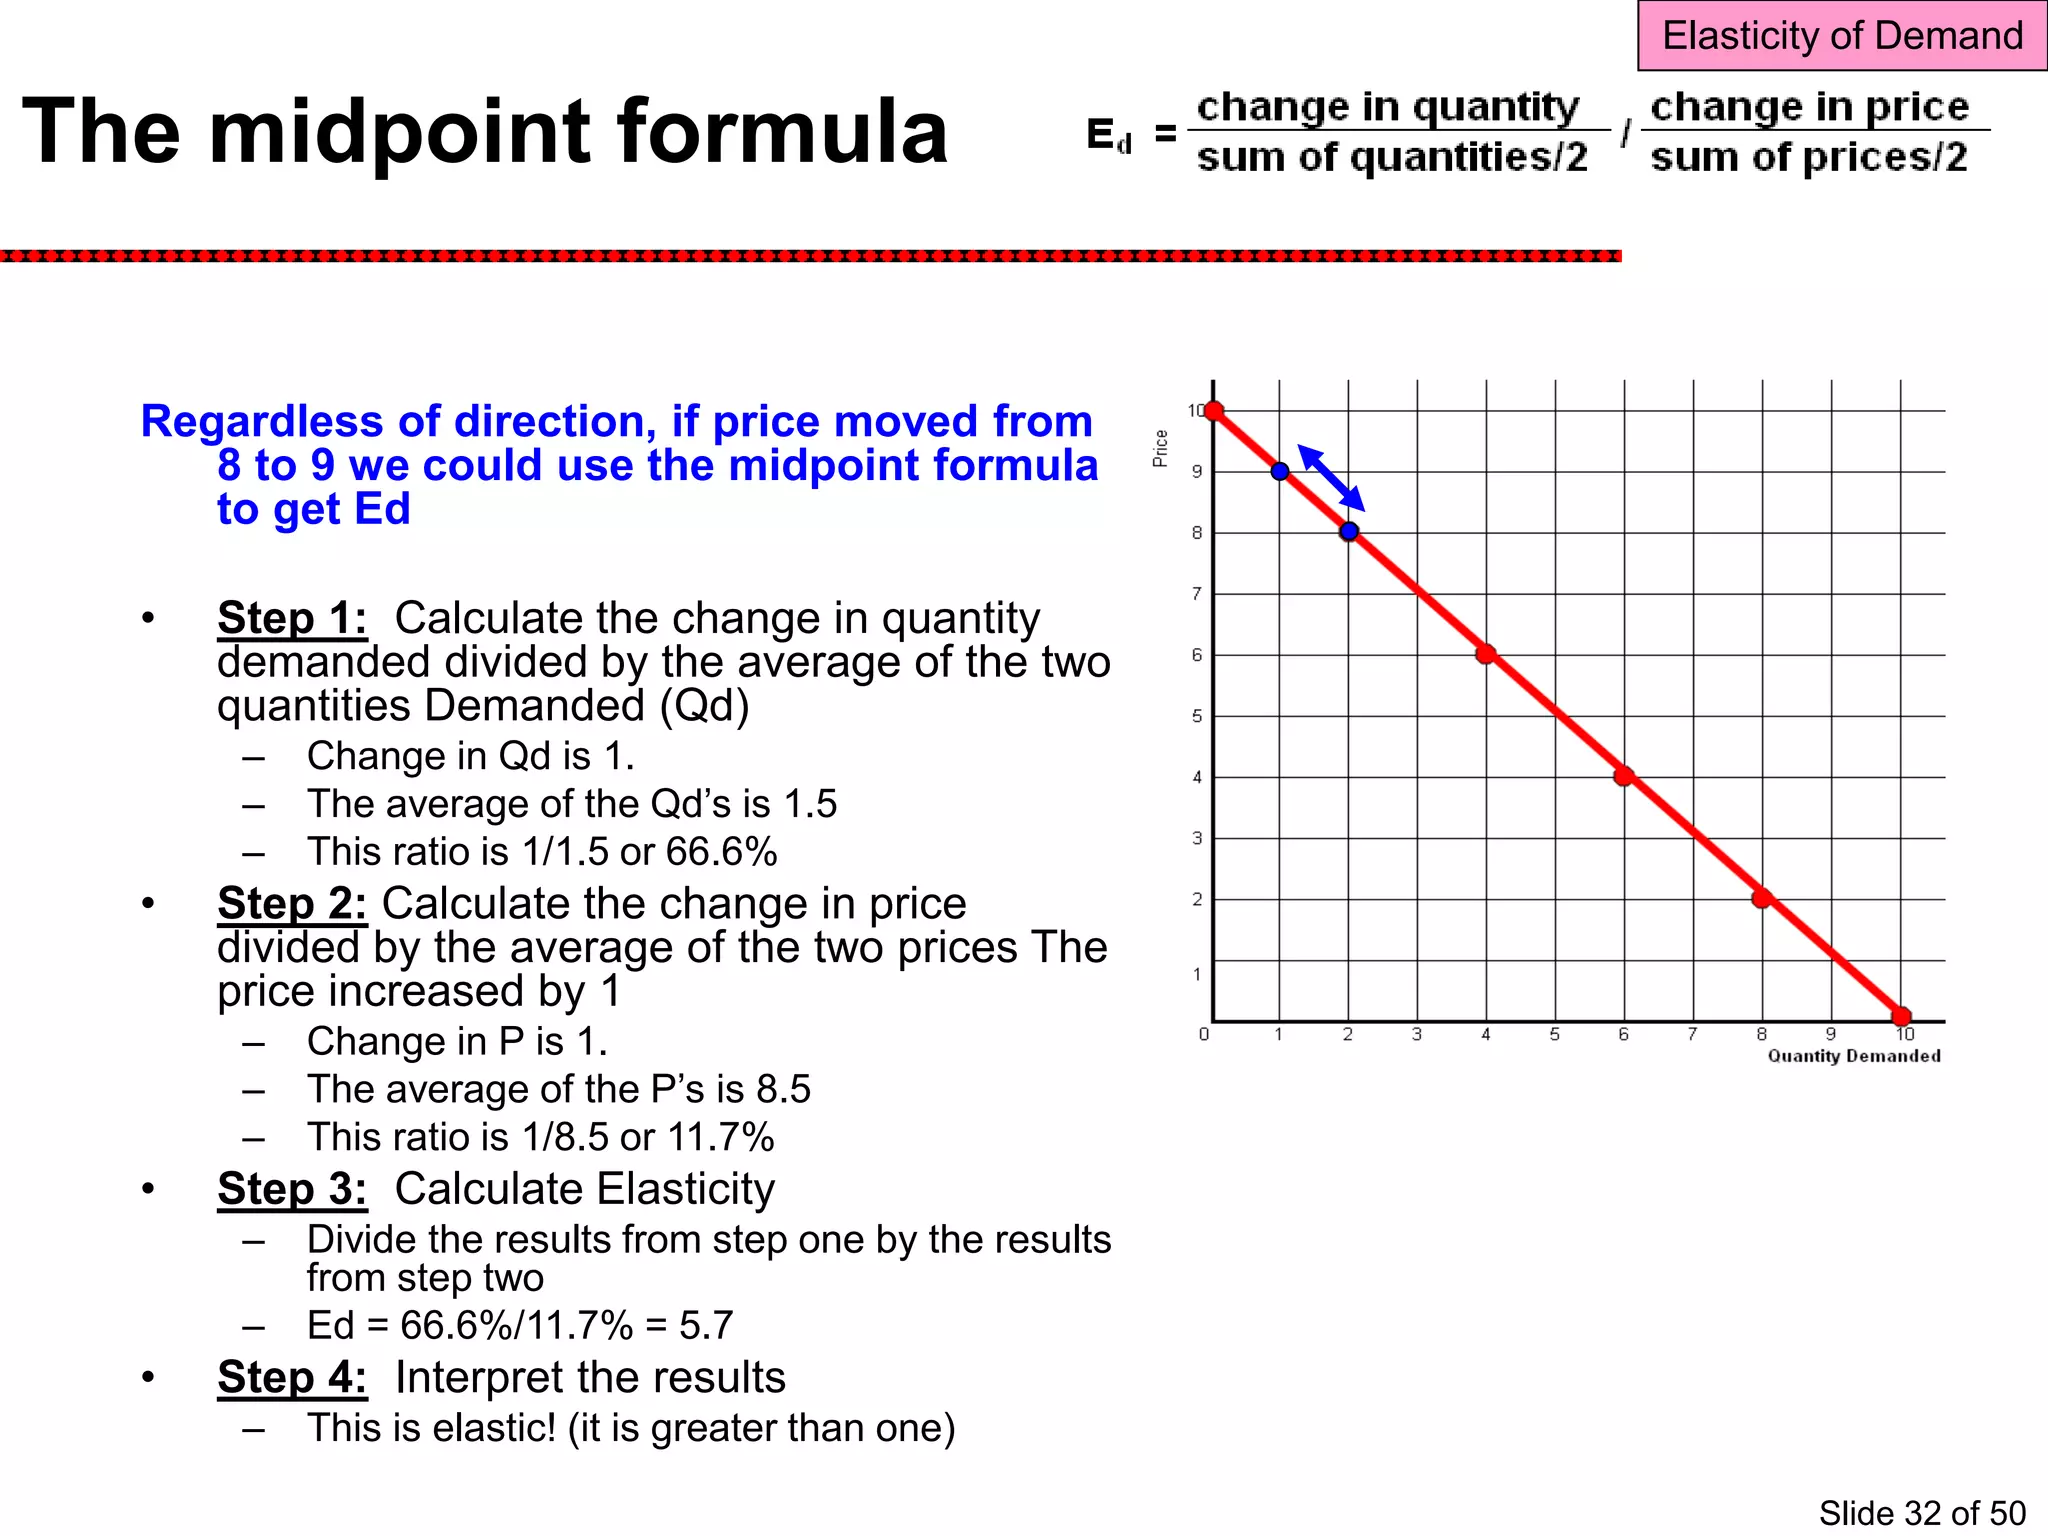

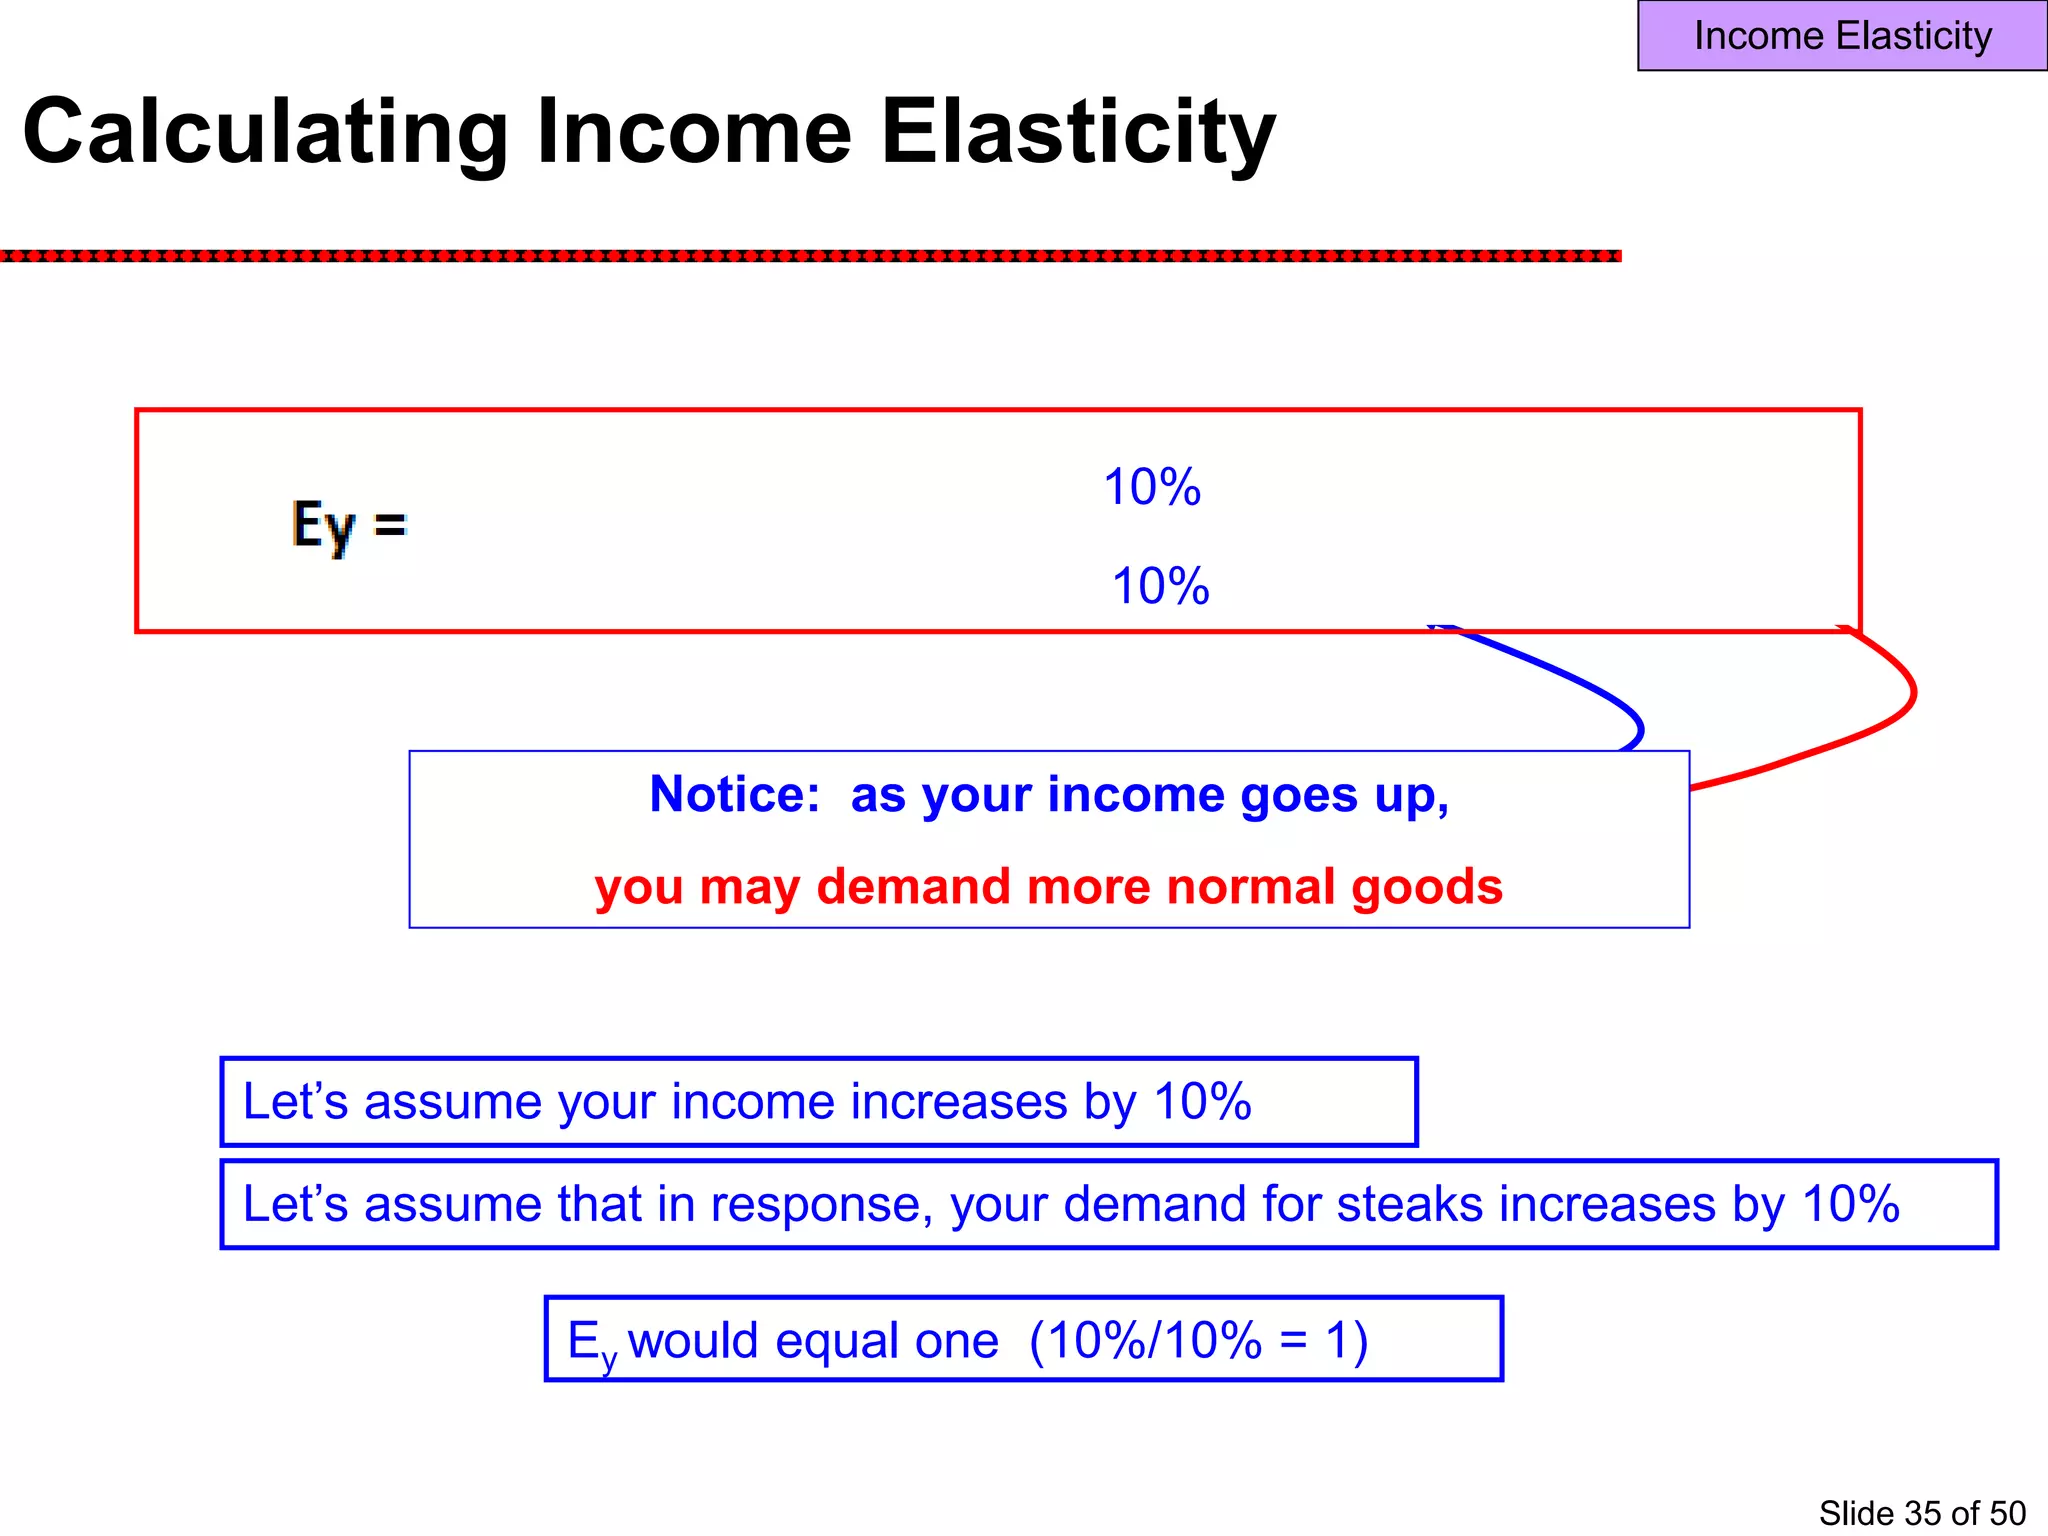
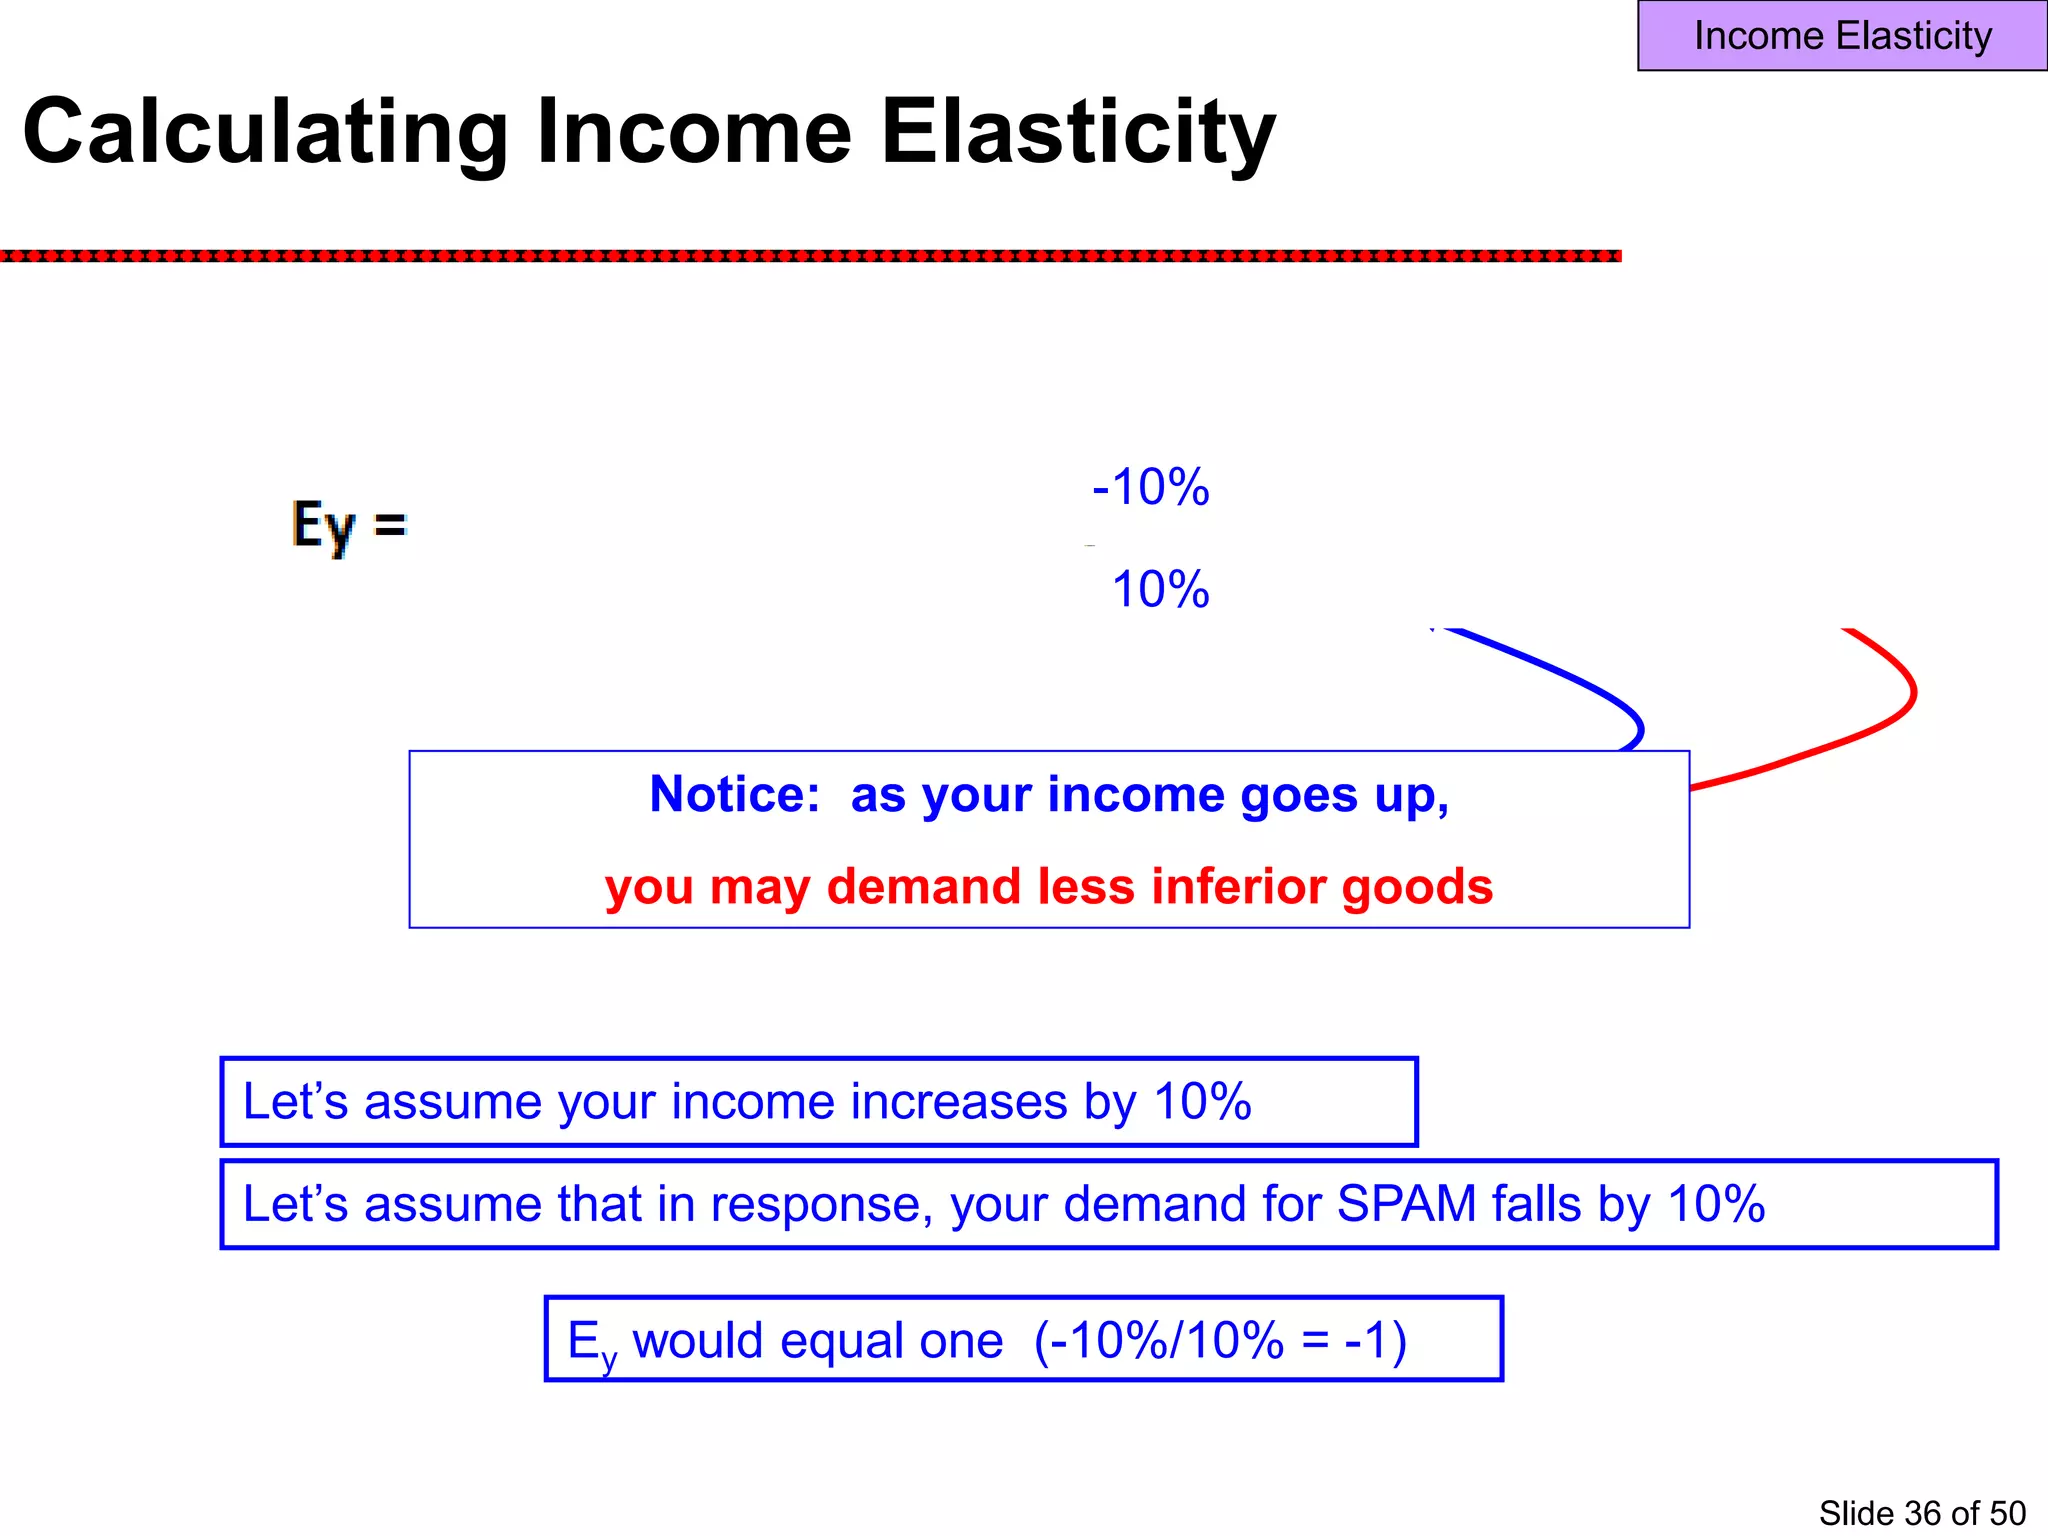
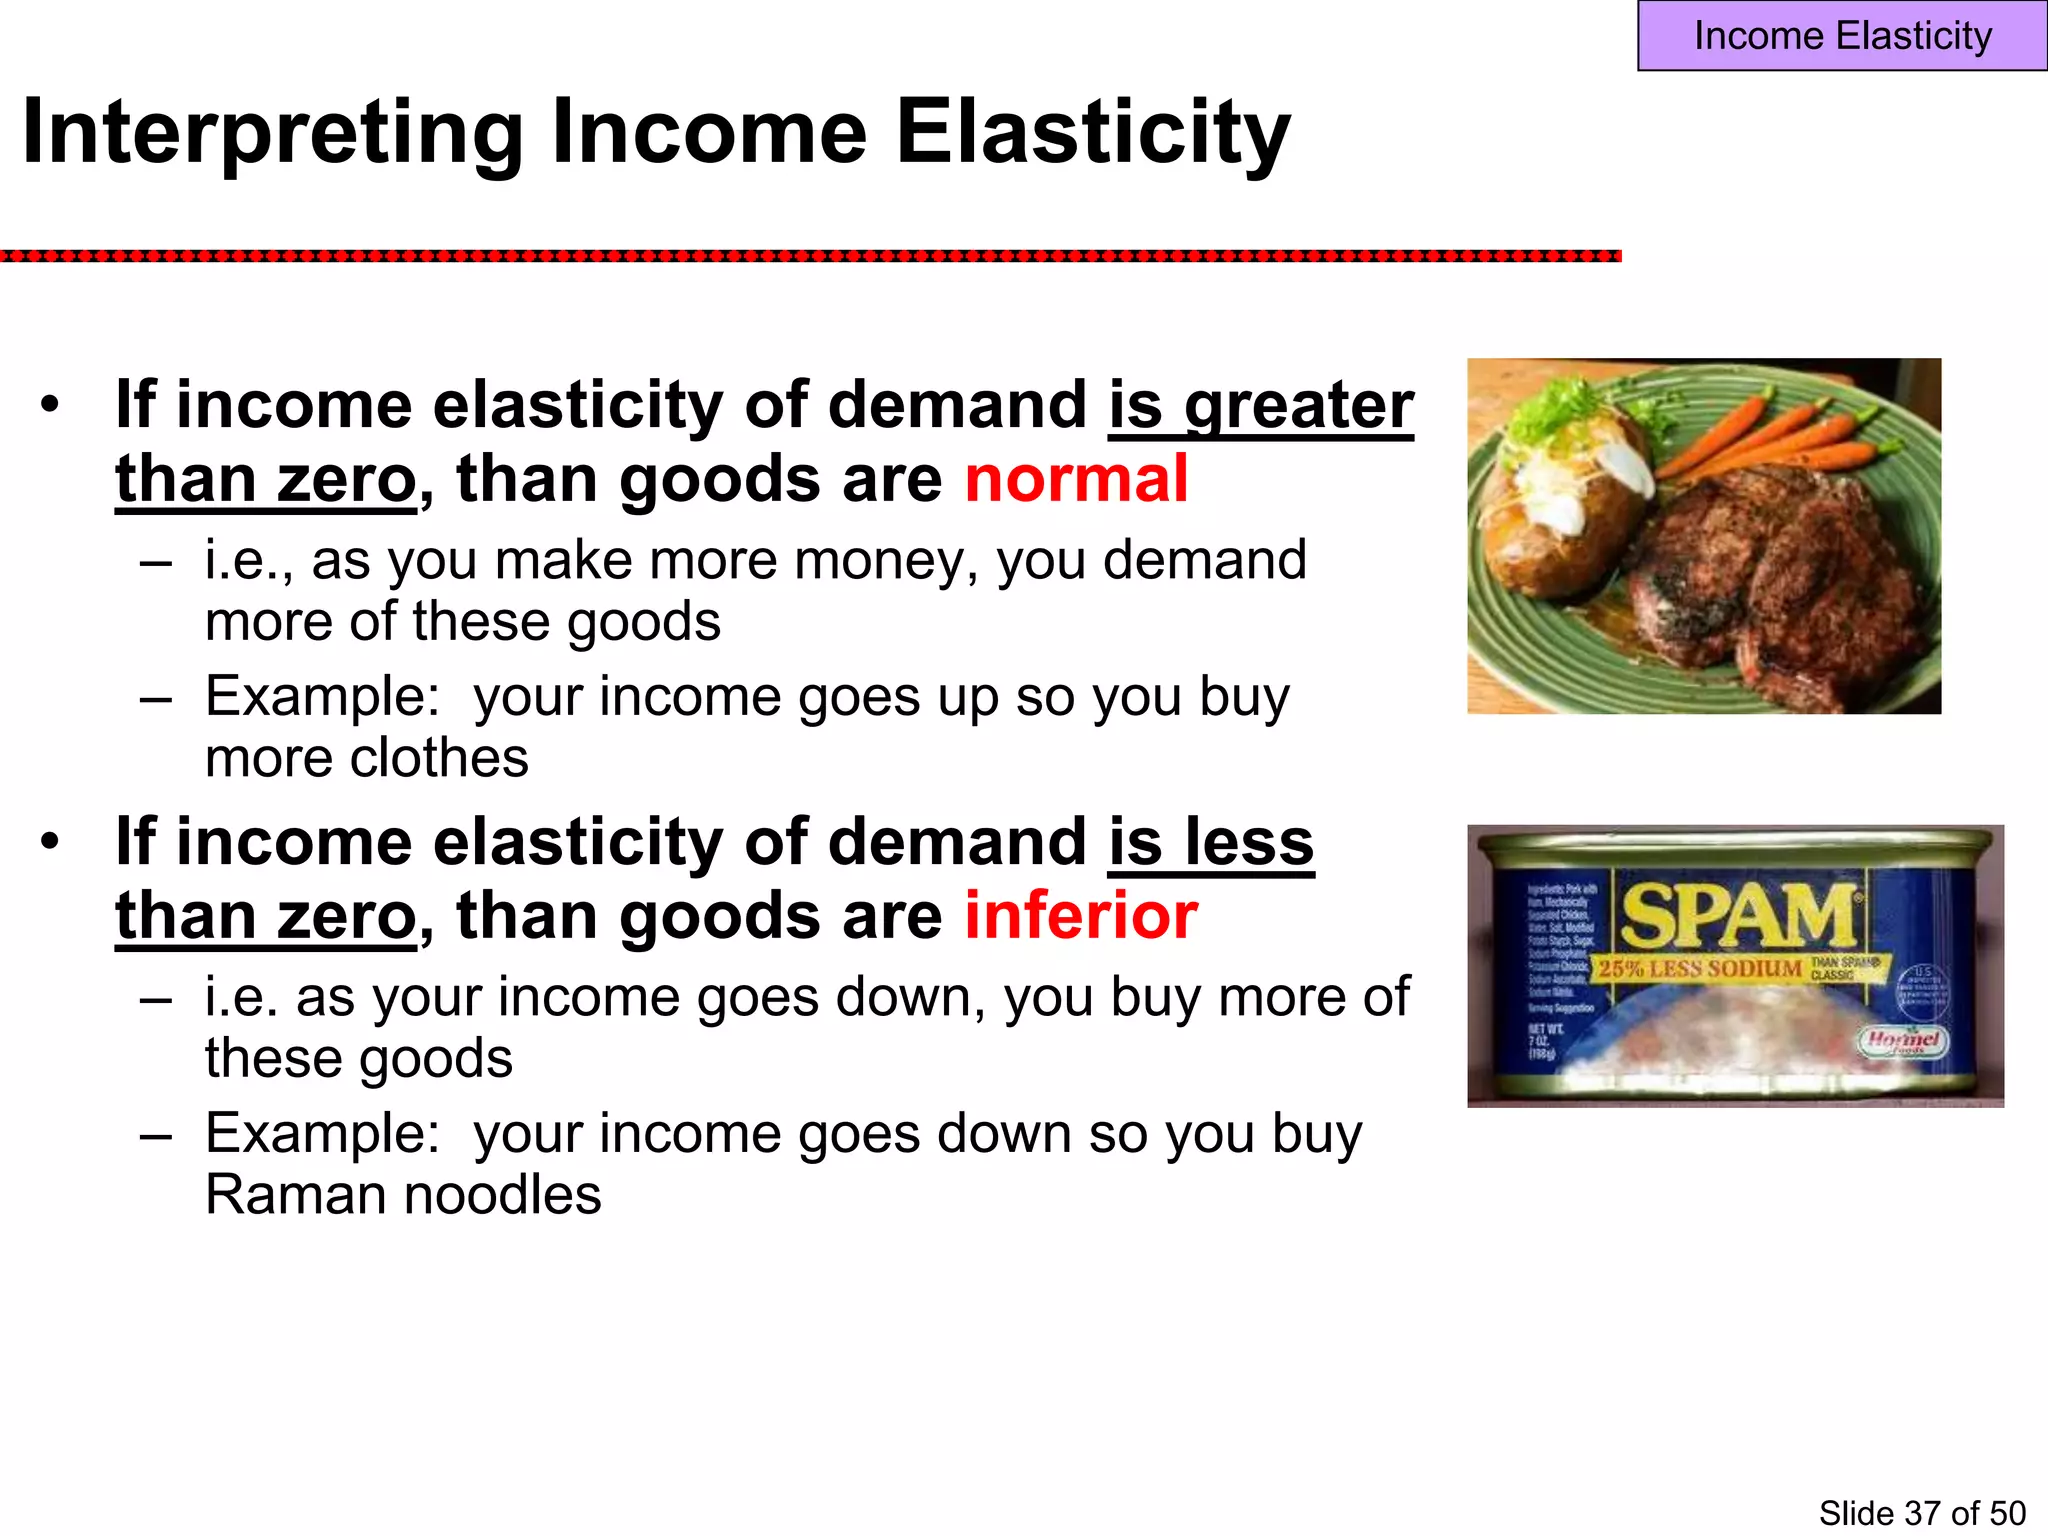

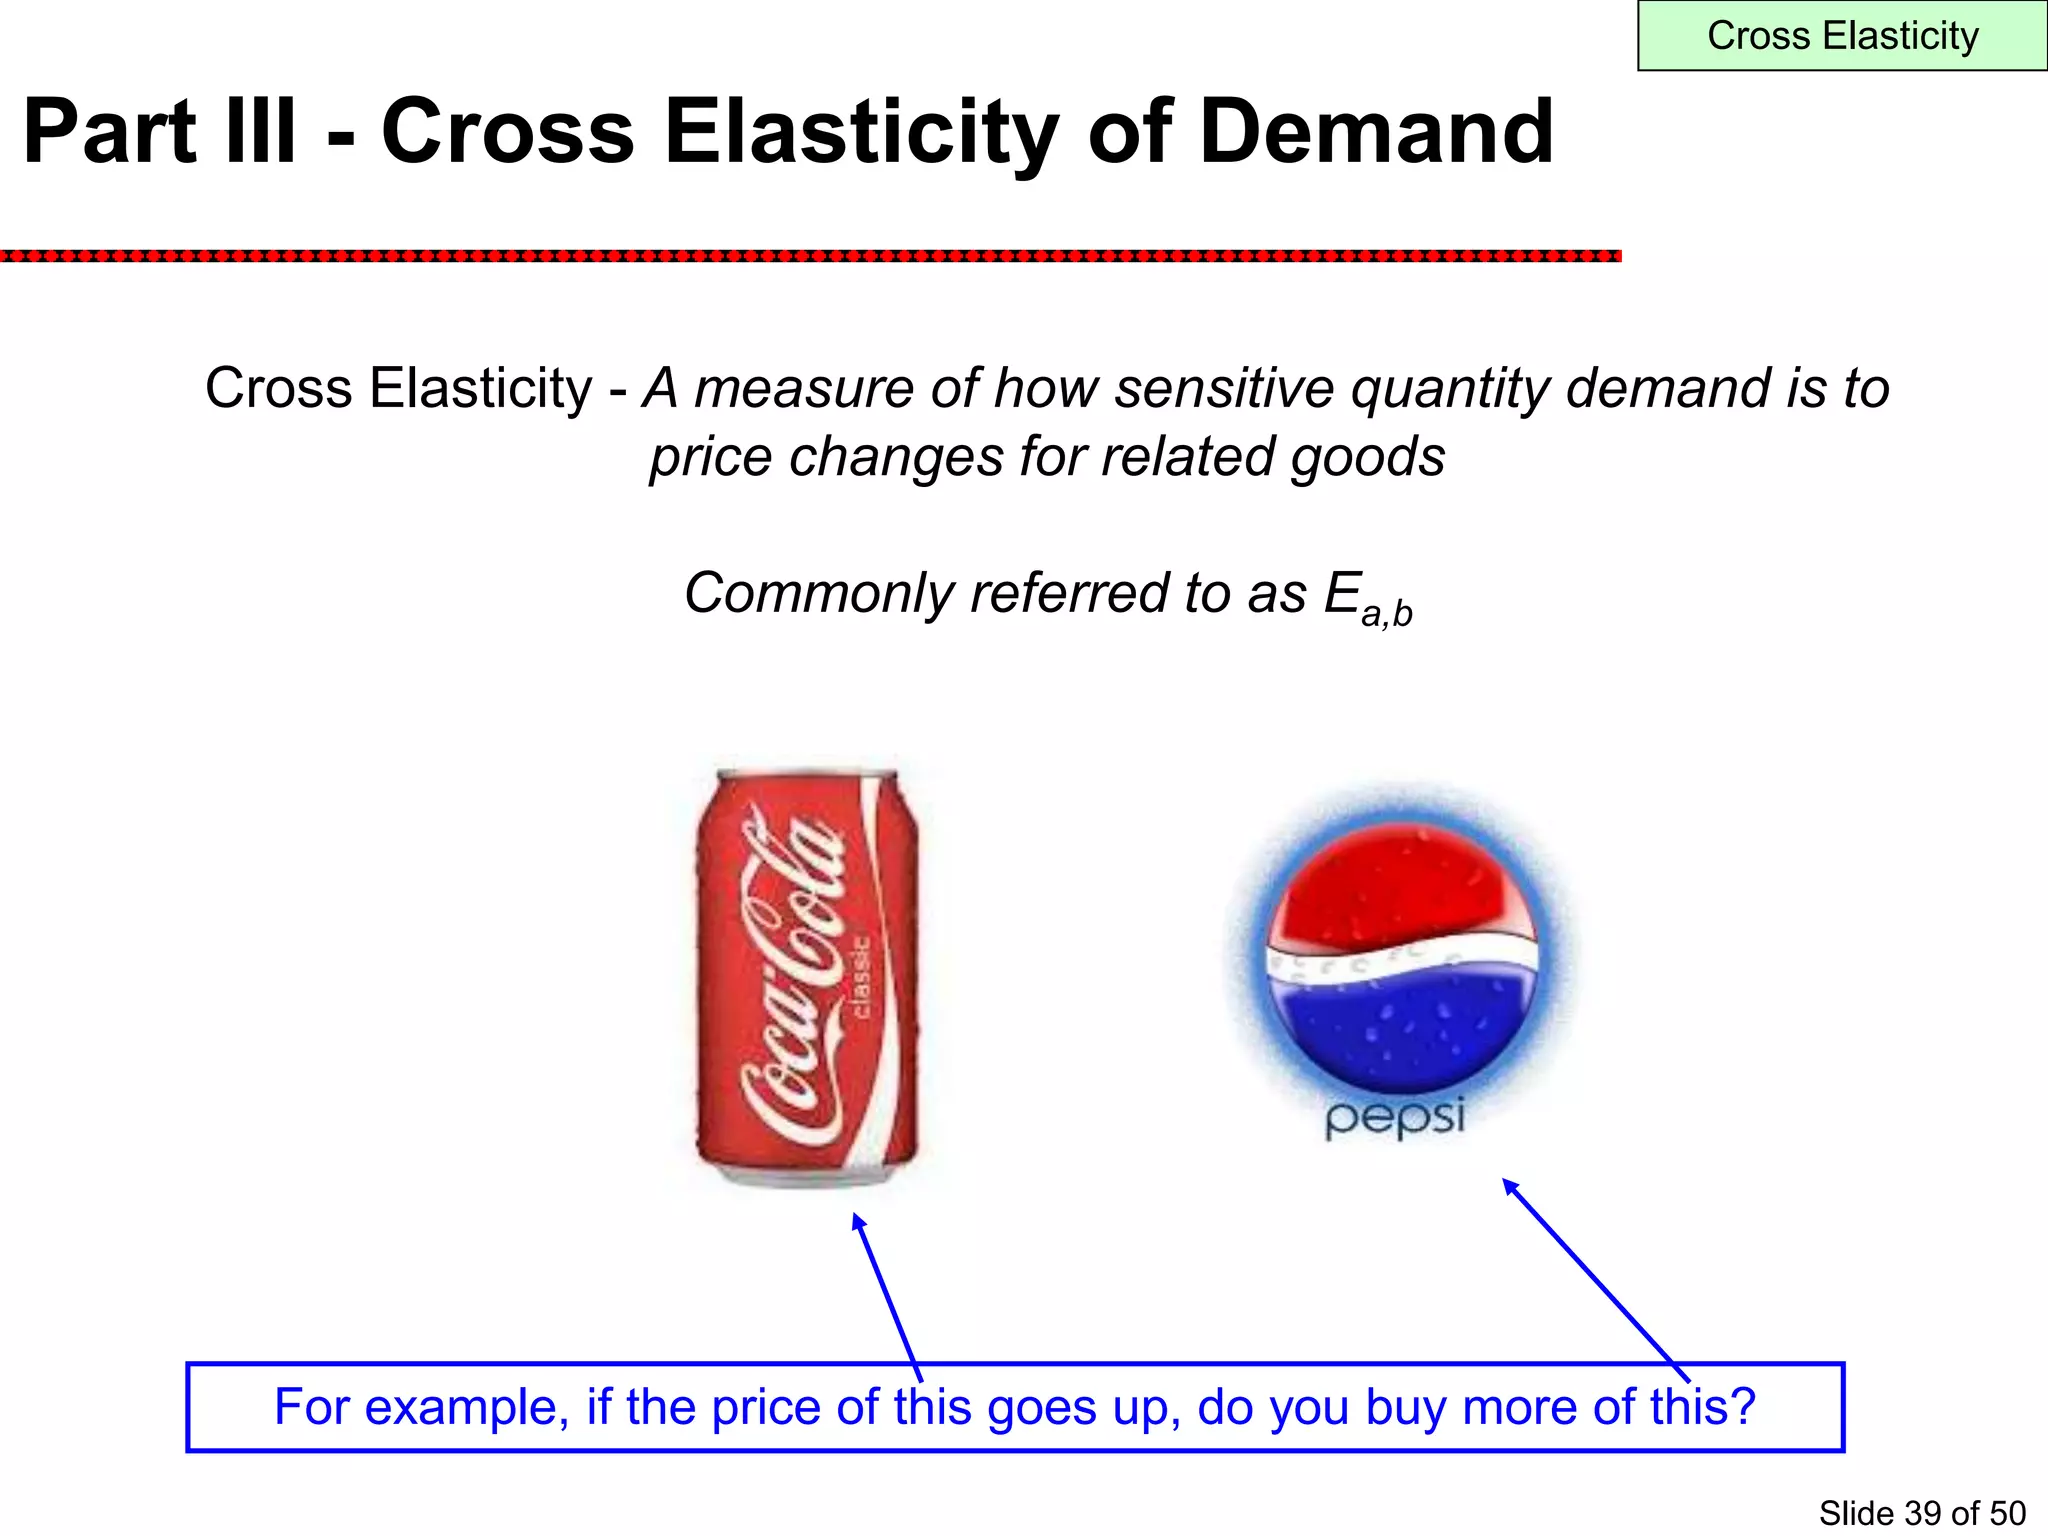

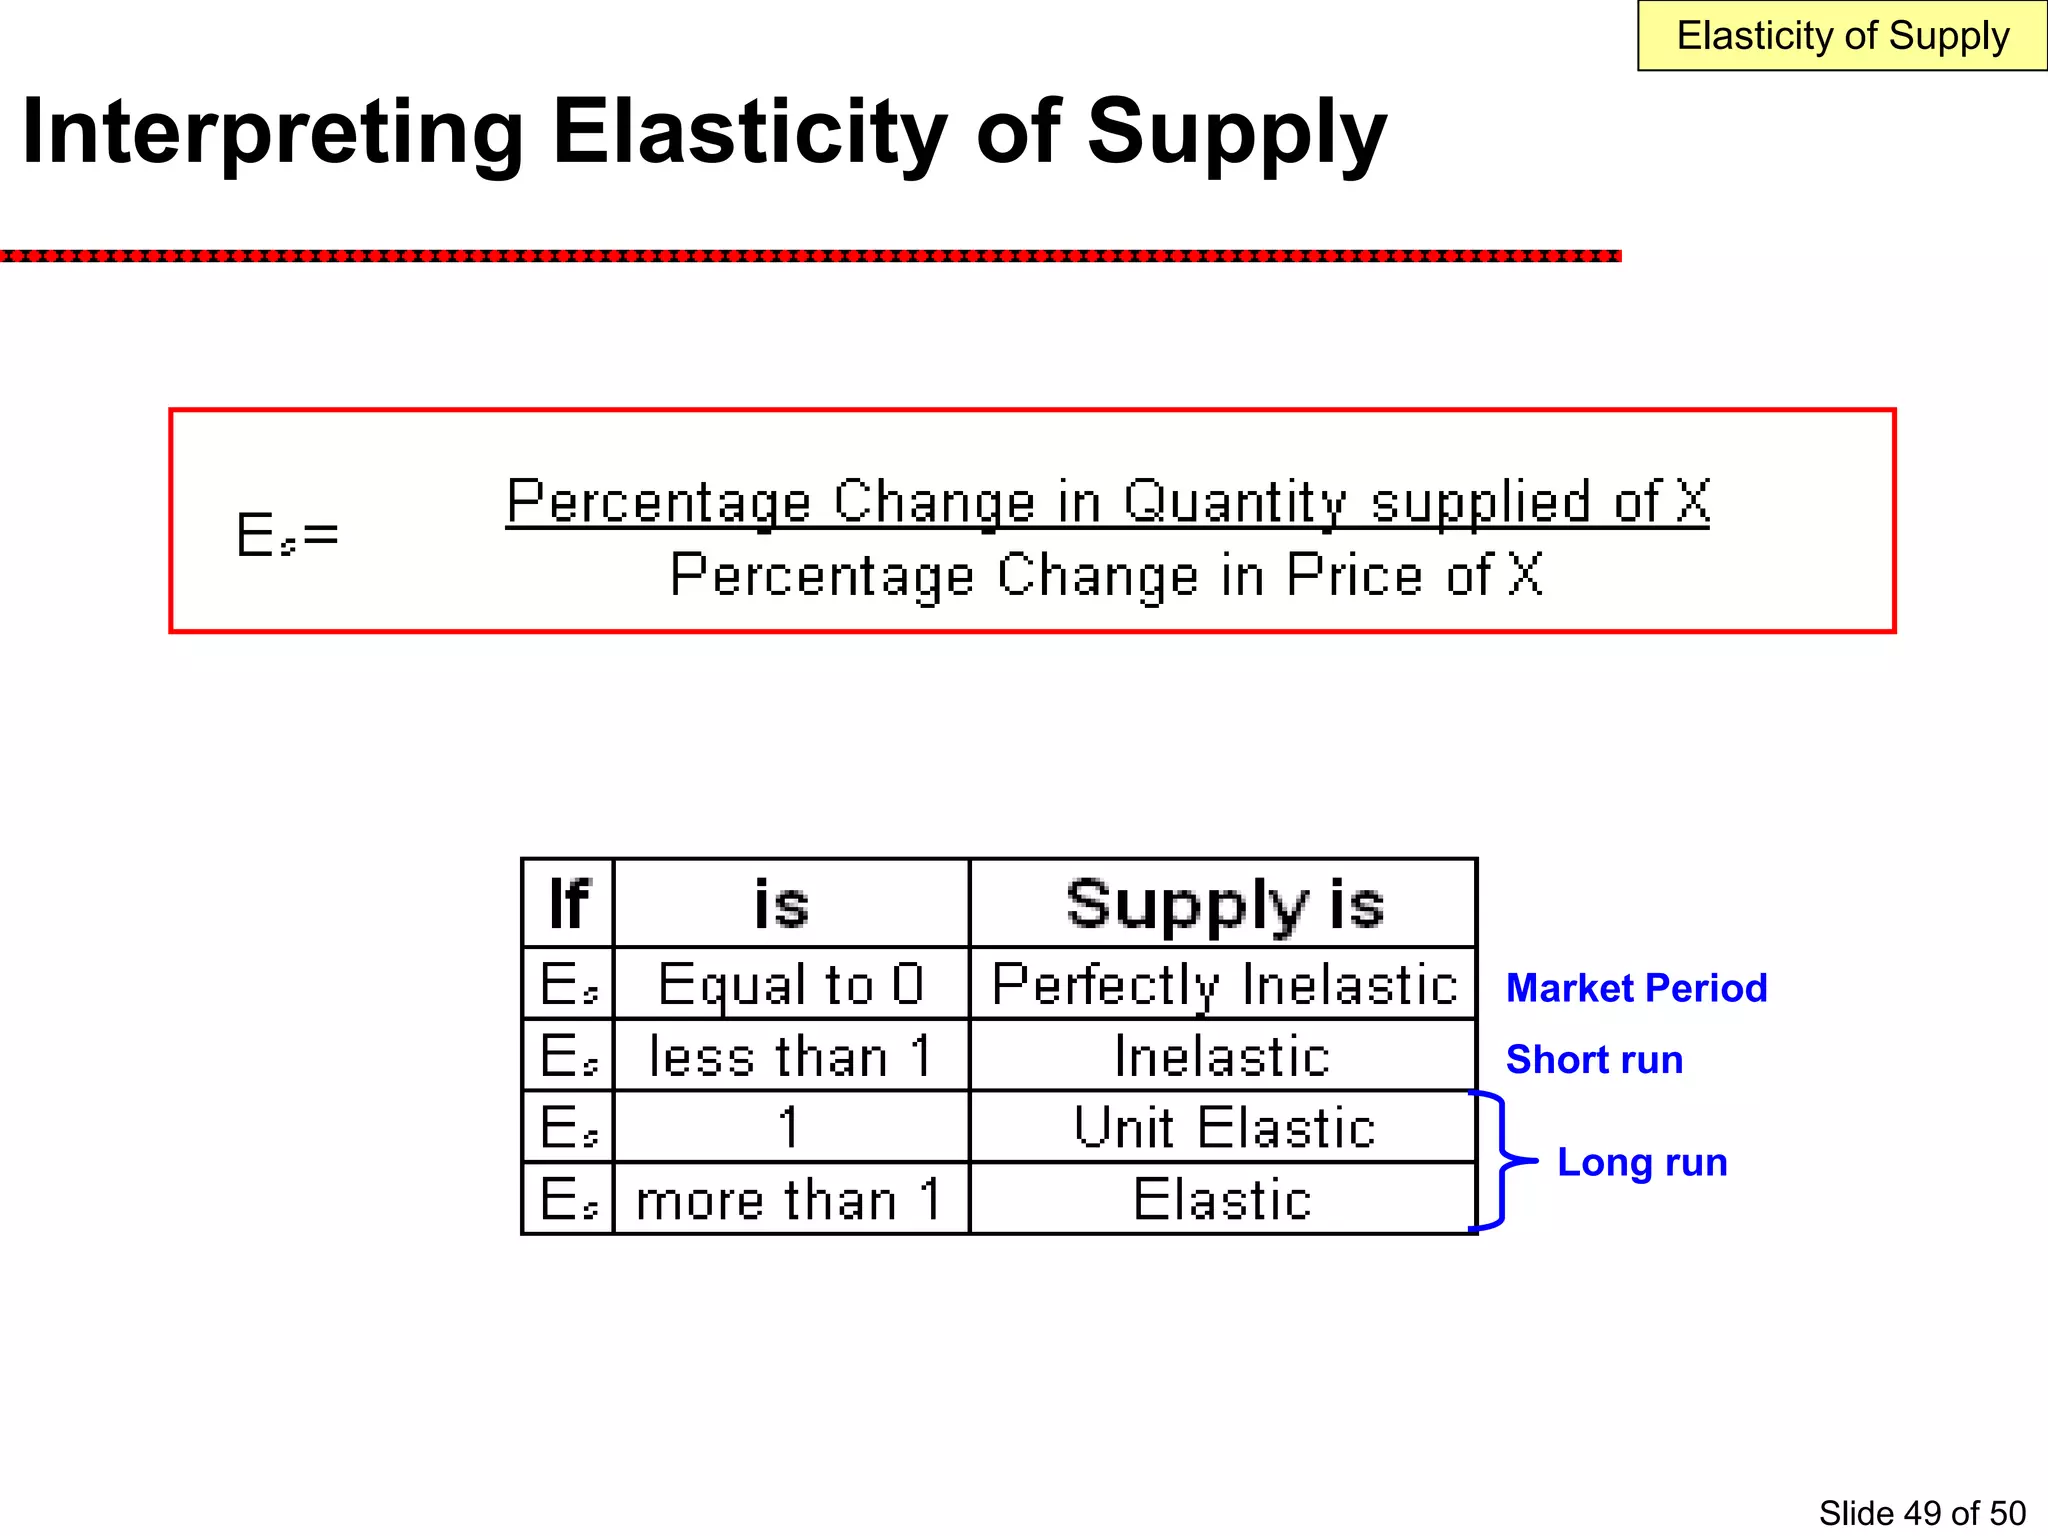
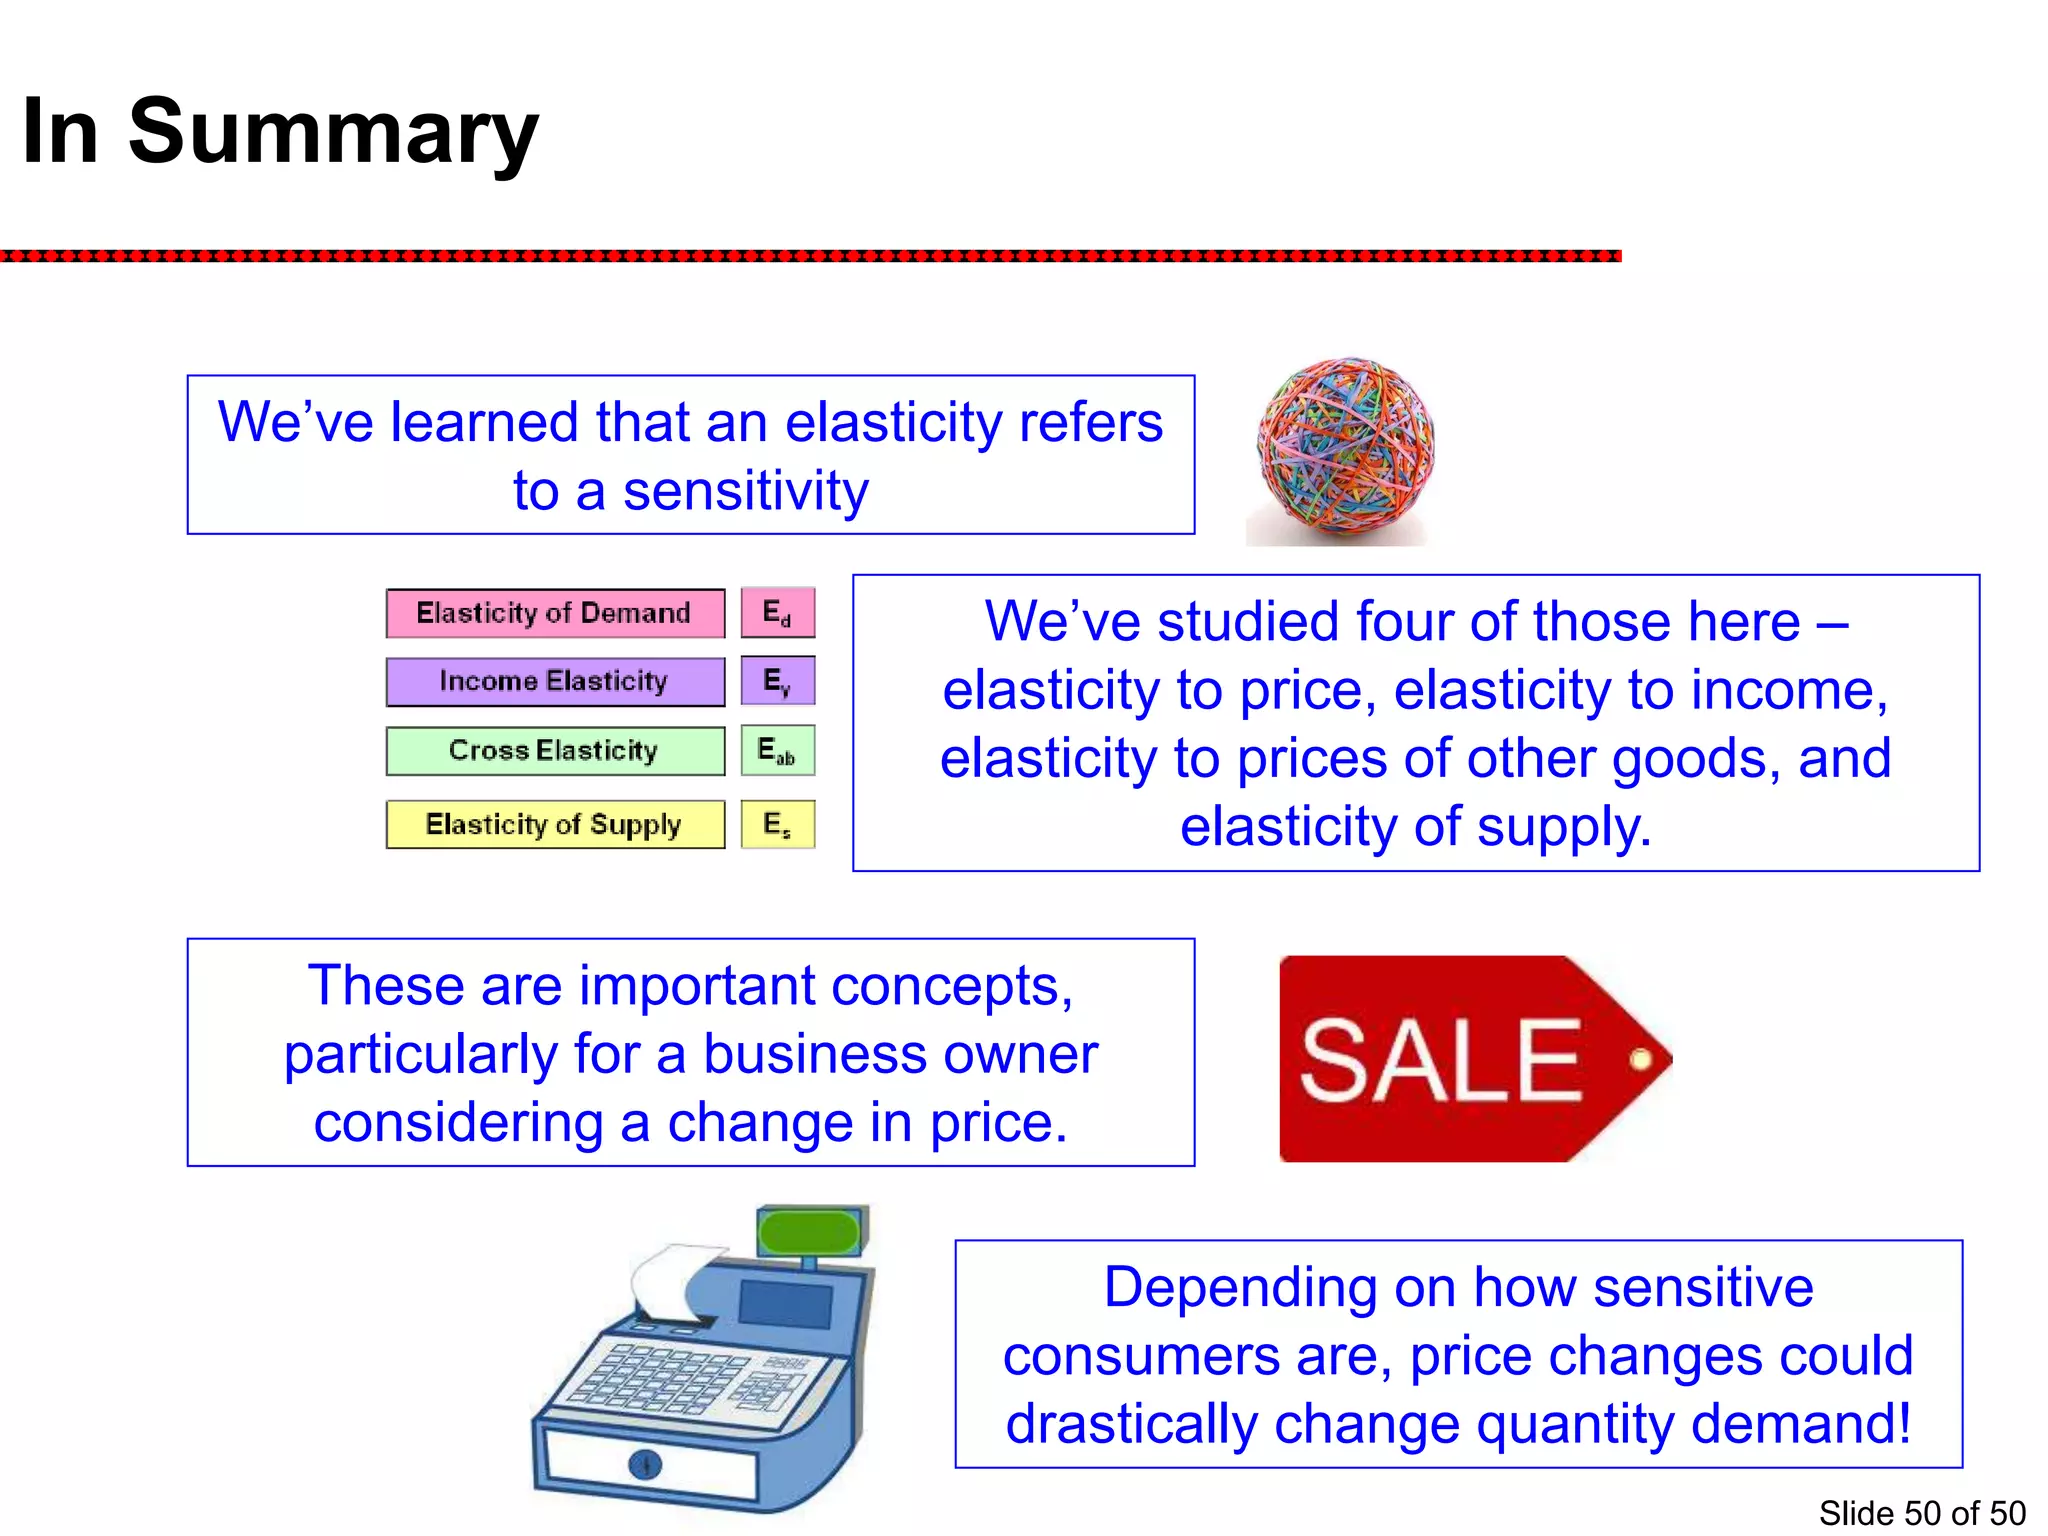

Elasticity measures the responsiveness of one variable to changes in another. This presentation discusses elasticity of demand, which measures how sensitive consumers are to changes in price. Demand is said to be elastic if a small price change leads to a large change in quantity demanded. It is inelastic if a large price change results in a small change in quantity. Calculating elasticity involves determining the percentage changes in both price and quantity demanded. Understanding elasticity helps economists predict how demand will respond to price fluctuations.

![[Microeconomics] Chapter 15 - Monopoly](https://cdn.slidesharecdn.com/ss_thumbnails/microchapter15monopoly-180225091108-thumbnail.jpg?width=640&height=640&fit=bounds)