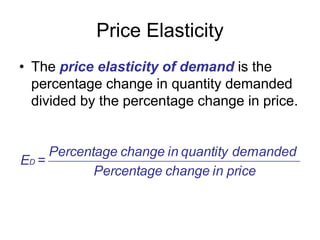
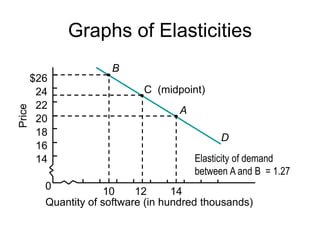
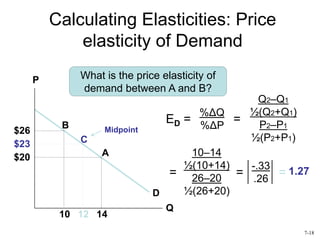
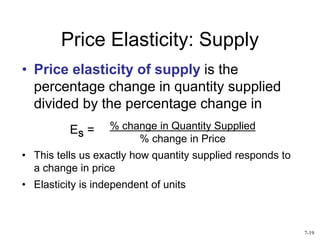
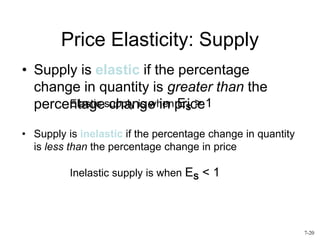
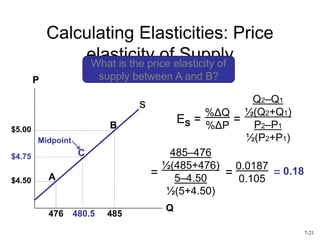
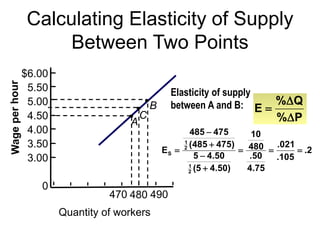
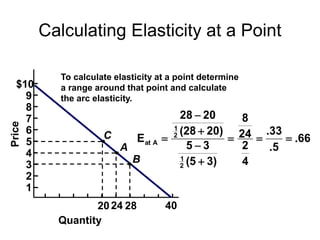
The Elasticity of Demand
Chapter 7
The Concept of Elasticity
• Elasticity is a measure of the
responsiveness of one variable to another.
• The greater the elasticity, the greater the
responsiveness.
Laugher Curve
Q. What’s the difference between an
economist and a befuddled old man with
Alzheimer’s?
A. The economist is the one with a
calculator.
The Concept of Elasticity
• Elasticity is a measure of the
responsiveness of one variable to another.
• The greater the elasticity, the greater the
responsiveness.
Price Elasticity
• The price elasticity of demand is the
percentage change in quantity demanded
divided by the percentage change in price.
price
in
change
Percentage
demanded
quantity
in
change
Percentage
=
ED
Sign of Price Elasticity
• According to the law of demand, whenever
the price rises, the quantity demanded
falls. Thus the price elasticity of
demand is always negative.
• Because it is always negative, economists
usually state the value without the sign.
What Information Price
Elasticity Provides
• Price elasticity of demand and supply
gives the exact quantity response to a
change in price.
Classifying Demand and Supply
as Elastic or Inelastic
• Demand is elastic if the percentage
change in quantity is greater than the
percentage change in price.
E > 1
Classifying Demand and Supply
as Elastic or Inelastic
• Demand is inelastic if the percentage
change in quantity is less than the
percentage change in price.
E < 1
Elastic Demand
• Elastic Demand means that quantity
changes by a greater percentage than the
percentage change in price.
Inelastic Demand
• Inelastic Demand means that quantity
doesn't change much with a change in
price.
Defining elasticities
• When price elasticity is between zero and
-1 we say demand is inelastic.
• When price elasticity is between -1 and
- infinity, we say demand is elastic.
• When price elasticity is -1, we say demand
is unit elastic.
Elasticity Is Independent of
Units
• Percentages allow us to have a measure
of responsiveness that is independent of
units.
• This makes comparisons of
responsiveness of different goods easier.
Calculating Elasticities
• To determine elasticity divide the
percentage change in quantity by the
percentage change in price.
The End-Point Problem
• The end-point problem – the percentage
change differs depending on whether you
view the change as a rise or a decline in
price.
The End-Point Problem
• Economists use the average of the end
points to calculate the percentage change.
 
 
2
1
1
2
1
2
1
2
P
+
P
)
P
-
(P
Q
Q
)
Q
-
(Q
=
Elasticity
½
½ 
Graphs of Elasticities
Quantity of software (in hundred thousands)
$26
24
22
20
18
16
14
0
D
B
A
10 12 14
C (midpoint)
Elasticity of demand
between A and B = 1.27
Calculating Elasticities: Price
elasticity of Demand
D
P
Q
What is the price elasticity of
demand between A and B?
$20
10
$26
14
Midpoint
B
A
ED =
%ΔQ
%ΔP
Q2–Q1
½(Q2+Q1)
P2–P1
½(P2+P1)
=
C
12
$23
=
10–14
½(10+14)
26–20
½(26+20)
-.33
.26
= 1.27
=
7-18
Price Elasticity: Supply
• Price elasticity of supply is the
percentage change in quantity supplied
divided by the percentage change in
• This tells us exactly how quantity supplied responds to
a change in price
ES =
• Elasticity is independent of units
% change in Quantity Supplied
% change in Price
7-19
Price Elasticity: Supply
• Supply is elastic if the percentage
change in quantity is greater than the
percentage change in price
Elastic supply is when ES > 1
• Supply is inelastic if the percentage change in quantity
is less than the percentage change in price
Inelastic supply is when ES < 1
7-20
Calculating Elasticities: Price
elasticity of Supply
P
Q
What is the price elasticity of
supply between A and B?
$4.50
476
$5.00
485
B
A
ES =
%ΔQ
%ΔP
Q2–Q1
½(Q2+Q1)
P2–P1
½(P2+P1)
=
=
485–476
½(485+476)
5–4.50
½(5+4.50)
Midpoint
C
480.5
$4.75
0.0187
0.105
= 0.18
=
S
7-21
Graphs of Elasticities
Elasticity of supply
between A and B = 0.18
Quantity of workers
$6.00
5.50
5.00
4.50
4.00
3.50
3.00
0
C
B
A
470
(midpoint)
480 490
Calculating Elasticity
)
P
P
(
P
P
)
Q
Q
(
Q
Q
P
%
Q
%
E
2
1
2
1
1
2
2
1
2
1
1
2








Calculating Elasticity of Demand
Between Two Points
27
.
1
26
.
33
.
23
6
12
4
)
20
26
(
20
26
)
10
14
(
14
10
E
2
1
2
1
D 









Quantity of software (in hundred thousands)
$26
24
22
20
18
16
14
0
Demand
B
A
10 12 14
C
midpoint
Elasticity of demand
between A and B: P
%
Q
%
E



Calculating Elasticity of Supply
Between Two Points
P
%
Q
%
E



Quantity of workers
$6.00
5.50
5.00
4.50
4.00
3.50
3.00
0
C
B
A
470 480 490
Elasticity of supply
between A and B:
2
.
105
.
021
.
75
.
4
50
.
480
10
)
50
.
4
5
(
50
.
4
5
)
475
485
(
475
485
E
2
1
2
1
S 







Calculating Elasticity at a Point
• Let us now turn to a method of calculating
the elasticity at a specific point, rather than
over a range or an arc.
Calculating Elasticity at a Point
• To calculate elasticity at a point, determine
a range around that point and calculate
the arc elasticity.
Calculating Elasticity at a Point
Quantity
$10
9
8
7
6
5
4
3
2
1
C
B
A
24 40
28
20
 
 
0.66
3
+
5
3)
-
(5
20
28
20)
-
(28
=
A
at
E 

½
½
Calculating Elasticity at a Point
Quantity
$10
9
8
7
6
5
4
3
2
1
C
B
A
24 40
28
20
To calculate elasticity at a point determine
a range around that point and calculate
the arc elasticity.
66
.
5
.
33
.
4
2
24
8
)
3
5
(
3
5
)
20
28
(
20
28
E
2
1
2
1
A
at 







Elasticity and Demand Curves
• Two important points to consider:
– Elasticity is related (but is not the same as)
slope.
– Elasticity changes along straight-line demand
and supply curves.
Calculating Elasticity at a Point
6 12 18 30 36 42 48 Quantity
8
7
6
5
4
3
2
1
$10
9
A
24 60
54
D
B
C
Supply
EA = 2.33
EB = 0.11
Demand
EC = 0.75
ED = 0.86
Elasticity and Demand Curves
• Two important points to consider:
– Elasticity is related (but is not the same as)
slope.
– Elasticity changes along straight-line demand
and supply curves.
Elasticity Is Not the Same as
Slope
• The steeper the curve at a given point, the
less elastic is supply or demand.
• There are two limiting examples of this.
Elasticity Is Not the Same as
Slope
• When the curves are flat, we call the
curves perfectly elastic.
• The quantity changes enormously in
response to a proportional change in price
(E = ).
Elasticity Is Not the Same as
Slope
• When the curves are vertical, we call the
curves perfectly inelastic.
• The quantity does not change at all in
response to an enormous proportional
change in price (E = 0).
Perfectly inelastic
demand curve
0
Quantity
Perfectly Inelastic Demand
Curve
Perfectly elastic
demand curve
Perfectly Elastic Demand Curve
0
Quantity
Demand Curve
Shapes and Elasticity
• Perfectly Elastic Demand Curve
– The demand curve is horizontal, any change in price can and
will cause consumers to change their consumption.
• Perfectly Inelastic Demand Curve
– The demand curve is vertical, the quantity demanded is totally
unresponsive to the price. Changes in price have no effect on
consumer demand.
• In between the two extreme shapes of demand curves
are the demand curves for most products.
Demand Curve
Shapes and Elasticity
Elasticity Changes Along
Straight-Line Curves
• Elasticity is not the same as slope.
• Elasticity changes along straight line
supply and demand curves–slope does
not.
Elasticity Along a Demand Curve
Price
$10
9
8
7
6
5
4
3
2
1
0 1 2 3 4 5 6 7 8 9 10 Quantity
Elasticity declines along
demand curve as we move
toward the quantity axis
Ed = 1
Ed = 0
Ed < 1
Ed > 1
Ed = ∞
The Price Elasticity of Demand Along a
Straight-line Demand Curve
Substitution and Elasticity
• As a general rule, the more substitutes a
good has, the more elastic is its supply
and demand.
Substitution and Demand
• The less a good is a necessity, the more
elastic its demand curve.
• Necessities tend to have fewer substitutes
than do luxuries.
Substitution and Demand
• Demand for goods that represent a large
proportion of one's budget are more elastic
than demand for goods that represent a
small proportion of one's budget.
Substitution and Demand
• Goods that cost very little relative to your
total expenditures are not worth spending
a lot of time figuring out if there is a good
substitute.
• It is worth spending a lot of time looking for
substitutes for goods that take a large
portion of one’s income.
Substitution and Demand
• The larger the time interval considered, or
the longer the run, the more elastic is the
good’s demand curve.
– There are more substitutes in the long run
than in the short run.
– The long run provides more options for
change.
Determinants of the
Price Elasticity of Demand
• The degree to which the price elasticity of
demand is inelastic or elastic depends on:
– How many substitutes there are
– How well a substitute can replace the good or
service under consideration
– The importance of the product in the
consumer’s total budget
– The time period under consideration

4-1 Elasticity of Demand.ppt

  • 1.
    The Elasticity ofDemand Chapter 7
  • 2.
    The Concept ofElasticity • Elasticity is a measure of the responsiveness of one variable to another. • The greater the elasticity, the greater the responsiveness.
  • 3.
    Laugher Curve Q. What’sthe difference between an economist and a befuddled old man with Alzheimer’s? A. The economist is the one with a calculator.
  • 4.
    The Concept ofElasticity • Elasticity is a measure of the responsiveness of one variable to another. • The greater the elasticity, the greater the responsiveness.
  • 5.
    Price Elasticity • Theprice elasticity of demand is the percentage change in quantity demanded divided by the percentage change in price. price in change Percentage demanded quantity in change Percentage = ED
  • 6.
    Sign of PriceElasticity • According to the law of demand, whenever the price rises, the quantity demanded falls. Thus the price elasticity of demand is always negative. • Because it is always negative, economists usually state the value without the sign.
  • 7.
    What Information Price ElasticityProvides • Price elasticity of demand and supply gives the exact quantity response to a change in price.
  • 8.
    Classifying Demand andSupply as Elastic or Inelastic • Demand is elastic if the percentage change in quantity is greater than the percentage change in price. E > 1
  • 9.
    Classifying Demand andSupply as Elastic or Inelastic • Demand is inelastic if the percentage change in quantity is less than the percentage change in price. E < 1
  • 10.
    Elastic Demand • ElasticDemand means that quantity changes by a greater percentage than the percentage change in price.
  • 11.
    Inelastic Demand • InelasticDemand means that quantity doesn't change much with a change in price.
  • 12.
    Defining elasticities • Whenprice elasticity is between zero and -1 we say demand is inelastic. • When price elasticity is between -1 and - infinity, we say demand is elastic. • When price elasticity is -1, we say demand is unit elastic.
  • 13.
    Elasticity Is Independentof Units • Percentages allow us to have a measure of responsiveness that is independent of units. • This makes comparisons of responsiveness of different goods easier.
  • 14.
    Calculating Elasticities • Todetermine elasticity divide the percentage change in quantity by the percentage change in price.
  • 15.
    The End-Point Problem •The end-point problem – the percentage change differs depending on whether you view the change as a rise or a decline in price.
  • 16.
    The End-Point Problem •Economists use the average of the end points to calculate the percentage change.     2 1 1 2 1 2 1 2 P + P ) P - (P Q Q ) Q - (Q = Elasticity ½ ½ 
  • 17.
    Graphs of Elasticities Quantityof software (in hundred thousands) $26 24 22 20 18 16 14 0 D B A 10 12 14 C (midpoint) Elasticity of demand between A and B = 1.27
  • 18.
    Calculating Elasticities: Price elasticityof Demand D P Q What is the price elasticity of demand between A and B? $20 10 $26 14 Midpoint B A ED = %ΔQ %ΔP Q2–Q1 ½(Q2+Q1) P2–P1 ½(P2+P1) = C 12 $23 = 10–14 ½(10+14) 26–20 ½(26+20) -.33 .26 = 1.27 = 7-18
  • 19.
    Price Elasticity: Supply •Price elasticity of supply is the percentage change in quantity supplied divided by the percentage change in • This tells us exactly how quantity supplied responds to a change in price ES = • Elasticity is independent of units % change in Quantity Supplied % change in Price 7-19
  • 20.
    Price Elasticity: Supply •Supply is elastic if the percentage change in quantity is greater than the percentage change in price Elastic supply is when ES > 1 • Supply is inelastic if the percentage change in quantity is less than the percentage change in price Inelastic supply is when ES < 1 7-20
  • 21.
    Calculating Elasticities: Price elasticityof Supply P Q What is the price elasticity of supply between A and B? $4.50 476 $5.00 485 B A ES = %ΔQ %ΔP Q2–Q1 ½(Q2+Q1) P2–P1 ½(P2+P1) = = 485–476 ½(485+476) 5–4.50 ½(5+4.50) Midpoint C 480.5 $4.75 0.0187 0.105 = 0.18 = S 7-21
  • 22.
    Graphs of Elasticities Elasticityof supply between A and B = 0.18 Quantity of workers $6.00 5.50 5.00 4.50 4.00 3.50 3.00 0 C B A 470 (midpoint) 480 490
  • 23.
  • 24.
    Calculating Elasticity ofDemand Between Two Points 27 . 1 26 . 33 . 23 6 12 4 ) 20 26 ( 20 26 ) 10 14 ( 14 10 E 2 1 2 1 D           Quantity of software (in hundred thousands) $26 24 22 20 18 16 14 0 Demand B A 10 12 14 C midpoint Elasticity of demand between A and B: P % Q % E   
  • 25.
    Calculating Elasticity ofSupply Between Two Points P % Q % E    Quantity of workers $6.00 5.50 5.00 4.50 4.00 3.50 3.00 0 C B A 470 480 490 Elasticity of supply between A and B: 2 . 105 . 021 . 75 . 4 50 . 480 10 ) 50 . 4 5 ( 50 . 4 5 ) 475 485 ( 475 485 E 2 1 2 1 S        
  • 26.
    Calculating Elasticity ata Point • Let us now turn to a method of calculating the elasticity at a specific point, rather than over a range or an arc.
  • 27.
    Calculating Elasticity ata Point • To calculate elasticity at a point, determine a range around that point and calculate the arc elasticity.
  • 28.
    Calculating Elasticity ata Point Quantity $10 9 8 7 6 5 4 3 2 1 C B A 24 40 28 20     0.66 3 + 5 3) - (5 20 28 20) - (28 = A at E   ½ ½
  • 29.
    Calculating Elasticity ata Point Quantity $10 9 8 7 6 5 4 3 2 1 C B A 24 40 28 20 To calculate elasticity at a point determine a range around that point and calculate the arc elasticity. 66 . 5 . 33 . 4 2 24 8 ) 3 5 ( 3 5 ) 20 28 ( 20 28 E 2 1 2 1 A at        
  • 30.
    Elasticity and DemandCurves • Two important points to consider: – Elasticity is related (but is not the same as) slope. – Elasticity changes along straight-line demand and supply curves.
  • 31.
    Calculating Elasticity ata Point 6 12 18 30 36 42 48 Quantity 8 7 6 5 4 3 2 1 $10 9 A 24 60 54 D B C Supply EA = 2.33 EB = 0.11 Demand EC = 0.75 ED = 0.86
  • 32.
    Elasticity and DemandCurves • Two important points to consider: – Elasticity is related (but is not the same as) slope. – Elasticity changes along straight-line demand and supply curves.
  • 33.
    Elasticity Is Notthe Same as Slope • The steeper the curve at a given point, the less elastic is supply or demand. • There are two limiting examples of this.
  • 34.
    Elasticity Is Notthe Same as Slope • When the curves are flat, we call the curves perfectly elastic. • The quantity changes enormously in response to a proportional change in price (E = ).
  • 35.
    Elasticity Is Notthe Same as Slope • When the curves are vertical, we call the curves perfectly inelastic. • The quantity does not change at all in response to an enormous proportional change in price (E = 0).
  • 36.
  • 37.
    Perfectly elastic demand curve PerfectlyElastic Demand Curve 0 Quantity
  • 38.
    Demand Curve Shapes andElasticity • Perfectly Elastic Demand Curve – The demand curve is horizontal, any change in price can and will cause consumers to change their consumption. • Perfectly Inelastic Demand Curve – The demand curve is vertical, the quantity demanded is totally unresponsive to the price. Changes in price have no effect on consumer demand. • In between the two extreme shapes of demand curves are the demand curves for most products.
  • 39.
  • 40.
    Elasticity Changes Along Straight-LineCurves • Elasticity is not the same as slope. • Elasticity changes along straight line supply and demand curves–slope does not.
  • 41.
    Elasticity Along aDemand Curve Price $10 9 8 7 6 5 4 3 2 1 0 1 2 3 4 5 6 7 8 9 10 Quantity Elasticity declines along demand curve as we move toward the quantity axis Ed = 1 Ed = 0 Ed < 1 Ed > 1 Ed = ∞
  • 42.
    The Price Elasticityof Demand Along a Straight-line Demand Curve
  • 43.
    Substitution and Elasticity •As a general rule, the more substitutes a good has, the more elastic is its supply and demand.
  • 44.
    Substitution and Demand •The less a good is a necessity, the more elastic its demand curve. • Necessities tend to have fewer substitutes than do luxuries.
  • 45.
    Substitution and Demand •Demand for goods that represent a large proportion of one's budget are more elastic than demand for goods that represent a small proportion of one's budget.
  • 46.
    Substitution and Demand •Goods that cost very little relative to your total expenditures are not worth spending a lot of time figuring out if there is a good substitute. • It is worth spending a lot of time looking for substitutes for goods that take a large portion of one’s income.
  • 47.
    Substitution and Demand •The larger the time interval considered, or the longer the run, the more elastic is the good’s demand curve. – There are more substitutes in the long run than in the short run. – The long run provides more options for change.
  • 48.
    Determinants of the PriceElasticity of Demand • The degree to which the price elasticity of demand is inelastic or elastic depends on: – How many substitutes there are – How well a substitute can replace the good or service under consideration – The importance of the product in the consumer’s total budget – The time period under consideration