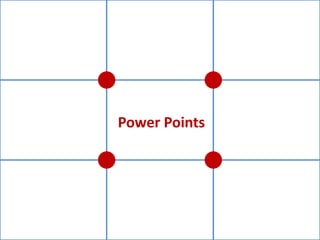
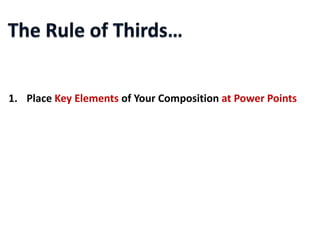
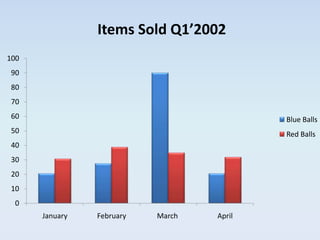
Effective PowerPoint Presentations


                      Kaan Demiryurek, Nov 2009
There are 300 million
  PowerPoint users*

*estimate
30 million presentations
            each day*

*estimate
PowerPoint can be confusing…
…might take long hours
…and sometimes drives crazy!
or…
…can be fun,
…and if successful,
…even can make you happy!
and
make
happy!
       How?
Audience     Message   Content


Simplicity   Format    Visuals
How will they benefit?

What to accomplish?

What design to use?
What do you

want them to

remember?
Will they tell what the message was?
How to deliver the message?
What to include?
would you prefer this?
or this?
What
Why
Who
Where
When
How
http://www.thebackofthenapkin.com/
Have a story…
…break it down…
…and put it all together…
…and tell your story
What you are is how you are perceived
                                 Rumi
Instructional Technology:
  A complex integrated process involving
  people, procedures, ideas, devices, and
  organization, for analyzing problems and
  devising, implementing, evaluating, and
  managing solutions to those problems in
  situations in which learning is purposive and
  controlled
  (HMRS 5th ed.)
                    Too detailed !
Instructional Technology:
  A process
  involving people, procedures & tools
  for solutions
  to problems in learning
  (HMRS 5th ed.)


                      Much Simpler
Instructional Technology;

A process

involving people, procedures, tools

for solutions

to problems in learning
(HMRS 5th ed.)


    Even Better?
Make it Big

Keep it Simple

Add a little variety and colors
•   This is Arial 12

•   This is Arial 18
• This is Arial 24
• This is Arial 32
• This is Arial 36
• This is Arial 44
•   This is Arial 12

•   This is Arial 18   Too Small
• This is Arial 24
• This is Arial 32
• This is Arial 36
• This is Arial 44
Look at it from 7 feet away

                   7 ft
Too many colors

Too Many Fonts and Styles

< 6 lines per slide

< 7 words per line

Simple fonts


E    vs.   E
This animation is annoying, not enhancing


  "Appear" and "Disappear" are better
Too distracting !

       7 ft
simple & to the point

         7 ft
Use colors to highlight and influence mood
Color Wheel


Opposite colors complement
Use contrasting colors
Light on dark vs dark on light
Use complementary colors
The color wheel


 These colors do not complement
Use contrasting colors
Light on dark vs dark on light
Use complementary colors
The color wheel


                Better ?
Pictures to provide context

Photographs for realism

Charts and graphs to minimize data

Do not over do it!
How do we take information during a presentation?


                                   Text     7%

                                   Visual   55%

                                   Vocal    38%


Research: Prof. Albert Mehrabian
How do we take information during a presentation?


Research: Prof. Albert Mehrabian
Source: Wharton Research Centre & Decker Communications
Choose the right image
Remove background colors


and use this space...
Crop unwanted portions of the images
What part of the picture?
Three different grounds from the same picture!
Power Points
1. Place Key Elements of Your Composition at Power Points
2. Place Key Elements of Your Composition Along Horizontal Lines


3. Place Key Elements of Your Composition Along Vertical Lines
Abc


  efg   xyz   tyu
Charts and graphs to minimize data
Items Sold in Q1’2002

           January February    March     April
Blue Balls     20.4     27.4        90     20.4
Red Balls      30.6     38.6      34.6     31.6
Items Sold Q1’2002
100
 90
 80
 70
 60
                                               Blue Balls
 50
                                               Red Balls
 40
 30
 20
 10
  0
      January   February     March     April
Items Sold Q1’2002
100
90
80
70
60                                         Blue Balls
50                                         Red Balls
40
30
20
10
 0
      January   February   March   April
Data Trend

  Year       Share (%)
  1987          32
  1988          30
  1989          28
  1990          27
  1991          29
  1992          33
  1993          38
  1994          41
  1995          45
  1996          48
  1997          52
  1998          56
  1999          59
  2000          59
  2001          58
  2002          59
  2003          60
  2004          62
  2005          63
  2006          62
  2007          60
Data Trend (%)


                                                                              63 62
                                                            59 59 58 59 60 62       60
                                                         56
                                                    52
                                               48
                                          45
                                     41
                                38
$ % Share


            32 30          33
                  28 27 29
Shareholding Pattern as of June 30, 2009 of Infosys


   Shareholder                       % Shareholding
   Indian Promoters                          16%
   Banks, FIs, Insurance Companies           4%
   FIIs                                      36%
   Indian Public                             16%
   Others                                    28%
Shareholding Pattern as of June 30, 2009 of Infosys


                               Indian
                             Promoters
                                16%
         Others
          28%                              Banks, FIs, Insu
                                               rance
                                             Companies
                                                4%


   Indian Public
       16%
                                    FIIs
                                    36%
Remember…
Audience     Message   Content


Simplicity   Format    Visuals
Also remember…
PowerPoint is
just a tool…
…create your own presentation with it
…and don’t forget to save so often!


                     “CTRL + S”
Thank you…
Back-up
Some more examples…
Effective Powerpoint Presentations

Effective Powerpoint Presentations

Editor's Notes

  • #5 You may have been asked to prepare a project summary, a report, a deck…etcAnd it can be really confusing, especially if you are starting from scratch and not sure; How to start What template to use What to include...
  • #6 If not planned well, may take long hoursYou may want to change/modify the template, the content…etc a lot while working on…
  • #7 And in some certain cases may really drive crazy, especially when crashed…
  • #8 Plato
  • #9 If you know how to deal with it and leverage it to create your own presentation
  • #13 These are the six principles I usually try to stick to when I am working with PowerPoint. They seem very obvious to all of us but I promise you we usually take them for granted!
  • #14 George Bernard Shaw - Irish playwright (26 July 1856 – 2 November 1950)
  • #15 Need to know the audience, their background, interests and understand what they want to see to define; How we want them to benefit? What do we want to accomplish after the presentation is over? what design, what template will we use?
  • #16 Is the message I am trying to deliver clear to everyone?Do I highlight it well enough?
  • #19 What to include?FactsStatisticsDataExecutive summaryRecommendations…
  • #20 The content and the way you put them together is the key to deliver the message
  • #22 If you cook all those ingredients all together and dump into a bowl, you will get thisSo easy to cookWill people like it? Would you like it?
  • #23 Very simple but classy presentation
  • #24 We can always use 6W’s while working on the message and the contentAsk these W’s about the topic we will be working on before we start building the presentationIt really helps!..
  • #25 Strongly recommended!
  • #26 After working on the main message, contents;we need to create a story, a well-prepared flow for the contentsto make sureeverything flows smoothly and serves to the point!
  • #27 Break the story to pieces to better view the flow;How to startHow to developHow to finish
  • #28 Then make sure everything is put together in a flawless flow…
  • #29 Also make sure the entire piece tells your story and delivers your message
  • #31 Simplicity always wins !
  • #33 Bill GatesVery complex slide behind him, you cannot focus on the presenter while there is this slide ob the screenThe audience will try to keep up with the slide and try to read and understand
  • #34 Steve JobsVery simple, to the point
  • #35 Please read the definition for Instructional TechnologyBlank the screen and ask them to repeat the definition
  • #37 Ask for the audience’s thoughts…
  • #38 You can do as many slides as you wantIt costs $0.00/slide in PowerPoint !!!!
  • #41 If it is readable from 7 ft on your screen then it will be readable in many conference or meeting rooms since the screens are usually adjusted accordingly
  • #42 No fonts with tails, it is difficult to read themDifferent colors or bold is better than Italic or Underline
  • #43 Use the animations only when you think it is necessary and helps you with the context
  • #46 When used correctly colors help to great extent;To highlight somethingTo differentiate somethingTo influence the emotionsSo on…
  • #75 Very difficult to follow the trend
  • #76 When there is more than 14 data points, line and area charts are better to show the trend
  • #78 Pie charts are great to talk about shares
  • #80 Once again, they seem so obvious but usually taken for granted