Download as PDF, PPTX


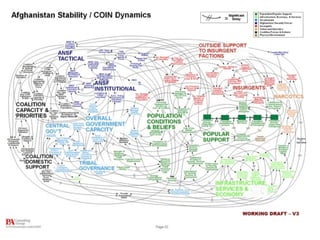


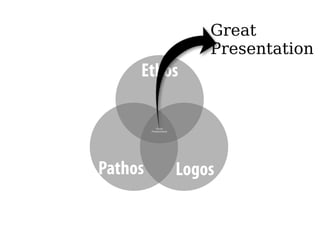


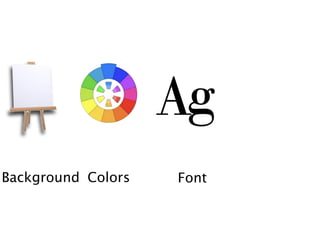

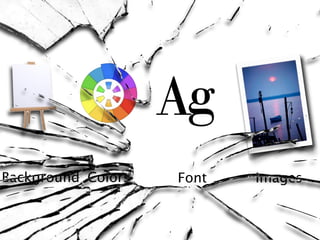


The presentation by Mohit Chhabra addresses the challenges and strategies in effective presentations, emphasizing the importance of simplicity, audience engagement, and storytelling. It critiques the common use of PowerPoint and offers insights into creating more impactful slides by reducing complexity and enhancing visual communication. It also highlights the significance of quality in data presentation and the necessity for a well-structured narrative in delivering information.


