Download as PDF, PPTX


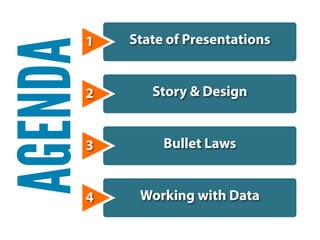


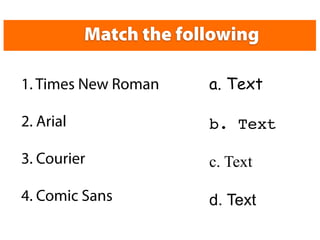


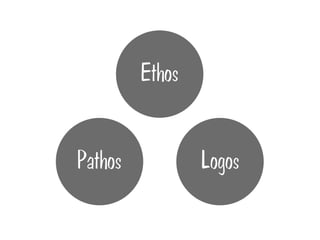


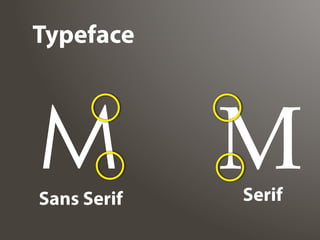


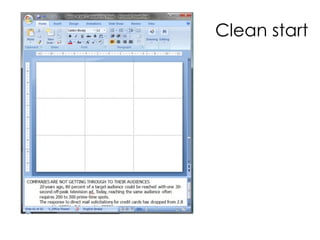


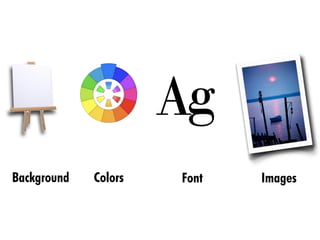


This presentation discusses various aspects of presentation design including storytelling, visual design, use of data, and bullet points. It emphasizes keeping presentations simple with thoughtful reduction, using sans serif fonts, limiting text on slides, and focusing on conveying a clear story or message over detailed facts and figures. Effective visual design is highlighted as important for engaging an audience and getting one's message across.


