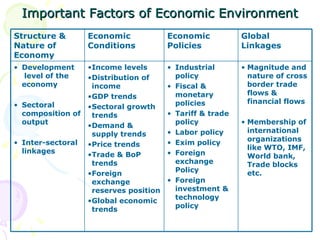
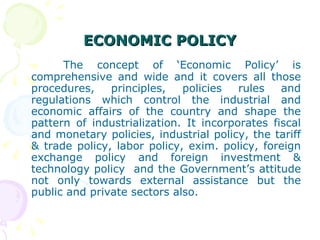
ECONOMIC POLICY Concept and Implications
Important Factors of Economic Environment Structure & Nature of Economy  Economic Conditions Economic Policies Global Linkages Development  level of the economy Sectoral composition of output Inter-sectoral linkages Income levels Distribution of  income GDP trends Sectoral growth trends Demand & supply trends Price trends Trade & BoP trends Foreign exchange reserves position Global economic trends Industrial policy  Fiscal & monetary policies Tariff & trade policy Labor policy Exim policy Foreign exchange Policy Foreign investment & technology policy Magnitude and nature of cross border trade flows & financial flows Membership of international organizations like WTO, IMF, World bank, Trade blocks etc.
ECONOMIC POLICY The concept of ‘Economic Policy’ is comprehensive and wide and it covers all those procedures, principles, policies rules and regulations which control the industrial and economic affairs of the country and shape the pattern of industrialization. It incorporates fiscal and monetary policies, industrial policy, the tariff & trade policy, labor policy, exim. policy, foreign exchange policy and foreign investment & technology policy  and the Government’s attitude not only towards external assistance but the public and private sectors also.
Economic Policy "Economic policy of any nation is a powerful instrument on the part of policy makers to direct the economy in the desired direction if formulated such a policy properly and implemented effectively. The India’s Economic Policy  is formulated keeping into consideration India's immediate as well as long term economic requirements. The India Economic Policy  is adopted so far has given rich dividends.
THRUST OF NEW ECONOMIC POLICY “ Any efficient control apparatus has to rely primarily on the accelerator and the steering wheel and only minimally on brakes. Brakes have, no doubt, to be applied to avoid pitfalls and hurdles. But to impart speed to the economy as we must and to steer in the right direction, other levers of the control have to be deployed, such as competition, incentives and penalties”  -L.K. Jha
FOCUS OF NEW ECONOMIC POLICY   “ There has been however a general agreement that a very distinctive feature of economic policy changes taken as a whole is the greater scope for unfettered expansion they offer to the private sector, particularly in the corporate segment of manufacturing industry, and the opportunities opened up to the multinational enterprises” - K.N. Raj
Types of Economic Policy Macroeconomic stabilization policy tries to keep the  money supply  growing, but not so quick that it results in excessive inflation. Trade policy  refers to  tariffs ,  trade agreements  and the international institutions that govern them. Policies designed to create  Economic growth Policies related to  development economics ,  Redistribution  of income, property, or wealth;  Regulation ;   Anti-trust ;   Industrial policy Technology-based Economic Development Policy
Objectives of IIP  The main objectives of the  India Economic Policy  is to take care of the basic parameters of the  Indian Economy  as mentioned below:  Agriculture Industry Licensing Policy Monetary Policy Fiscal Policy Commercial Policy Pricing Policy
New trends in Economic Policy Improvement in productivity Absorption of modern technology Fuller utilization of capacity Redefined role of Public sector New impetus to private sector
THE MAIN CONSTITUENT OF THE ECONOMIC POLICY Policy of liberalization accompanied by removal/ relaxation of control; Restoration of the competition; Reorientation of the fiscal policy; Modernization of the industries with a hi-tech bias; A long term perspective; and A bigger role for the private sector
PRIVATIZATION- THE MAJOR CONSTITUENT OF NEP “ Privatization connotes a wide range of Ideas ” “ Privatization is the general process of involving the private sector in the ownership or operations of a state owned enterprise. It also covers ‘contracting out’ and the privatization of the management through management contracts, leases or franchise arrangements”
MEASURES OF PRIVATIZATION Ownership measures -Total decentralization -Joint ventures -Liquidation -Management buy-outs Organizational measures - Holding Company structure -Leasing -Restructuring -Disinvestment -Token privatization Operational measures
Relevant Economic Indicators Facilitating Economic Comparisons  (Source: WB, WDR-2006) Country/ Region GNI GNI (PPP) GNI per capita GNI (PPP) per capita $ billion Rank $ billion Rank (Dollars) (Dollars) USA 12,151 1 11,655 1 41,400 39,710 Japan 4,750 2 3,838 3 37,180 30,040 Germany 2,489 3 2,310 5 30,120 27,950 UK 2,016 4 1,869 6 33,940 31,460 France 1,859 5 1,759 7 30,090 29,320 China 1,677 6 7,170 2 1,290 5,530 Italy 1,504 7 1,604 8 26,120 27,860 Canada 906 8 978 12 28,390 30,660 Spain 876 9 1,035 9 21,210 25,070 Mexico 703 10 995 10 6,770 9,590 India 675 11 3,347 4 620 3,100 Korea, Rep. 673 12 982 11 13,980 20,400 World 39,834 - 55,584 - 6,280 8,760 High Income Countries 32,064 - 31,000 - 32,040 30,970 Middle Income Countries 6,594 - 19,483 - 2,190 6,480 Low Income Countries 1,184 - 5,279 - 510 2,260
Contribution of Services Sector To Value Added as % of GDP  (Source: WB, WDR-2009) Country/Region 1980 1990 2003 2009  (Apprx.) World 56 60 68 70 High Income Economies 59 64 71 72 Low & Middle Income Economies  42 46 51 55 India 39 42 52 54
Revenue , Fiscal & Primary Deficit Revenue Deficit = Revenue Expenditure – Revenue Receipts Fiscal Deficit =  Total Expenditure (Revenue + Capital) – Total Income (Revenue Receipts + Recovery of Loans + Other Receipts) Primary Deficit =  Fiscal Deficit – Interest Payments
Performance of Economic Policy till December, 2010 ( Some useful indicators) The overall growth of Gross Domestic Product (GDP) at factor cost at constant prices, as per the Revised Estimates of CSO was 7.4 per cent in 2009-10. The growth in GDP is placed at 8.9 per cent in the second quarter of 2010-11.  Overall growth in the Index of Industrial Production (IIP) was 2.7 per cent during November 2010 as compared to 11.3 per cent in November 2009. During April-November 2010-11, IIP growth was 9.5 per cent as compared to 7.4 per cent during April-November 2009-10.
Performance of economic policy (Some useful indicators) Core infrastructure-supportive sectors grew by 2.3 per cent in November 2010 as compared to the growth of 5.9 per cent in November 2009. During April-November 2010-11, these sectors grew by 5.0 per cent as compared to 4.5 per cent during April-November 2009-10. Broad money (M3) (up to December 17, 2010) increased by 7.7 per cent as compared to 9.4 per cent during the corresponding period of the last year. The year-on-year growth, as on December 17, 2010 was 15.0 per cent as compared to 18.0 per cent last year.
Performance of economic policy (Some useful indicators) Exports, in US dollar terms increased by 26.5 per cent and imports increased by 11.2 per cent, during November 2010.  Foreign Currency Assets stood at US $ 268.1 billion at end December 2010 compared to US$ 258.8 billion at end December 2009.  Rupee appreciated against Pound Sterling, Japanese Yen and Euro, and depreciated against US Dollar in the month of December 2010 over November 2010  Year-on-year inflation in terms of Wholesale Price Index was 8.43 per cent for the month of December, 2010 as compared to 6.92 per cent in December, 2009.
Performance……… Tax revenue (net to Centre) during April-November, 2010-11 recorded a growth of 27.4 per cent compared with corresponding period of 2009-10. Non-tax revenue grew by 142.5 per cent in April-November 2010-11 on account of one-off nature of receipts of proceeds from Spectrum auction.
Rupee Movement Rupee comes from: Borrowings and other liabilities  14p Corporate Tax  24p Income tax  15p Customs  13p Excise  15p Service tax & other taxes  7p Non tax revenue  10p Non-debt capital receipts  2 p 100p Rupee goes to: Central plan  19p Interest  21p Defence  11p Subsidies  8p Other non-plan expenditure  10p States share of taxes and duties 19p Non-plan assistance to States  & UTs.  5p State & UT plan assistance  7p  100p

Economic policy

  • 1.
    ECONOMIC POLICY Conceptand Implications
  • 2.
    Important Factors ofEconomic Environment Structure & Nature of Economy Economic Conditions Economic Policies Global Linkages Development level of the economy Sectoral composition of output Inter-sectoral linkages Income levels Distribution of income GDP trends Sectoral growth trends Demand & supply trends Price trends Trade & BoP trends Foreign exchange reserves position Global economic trends Industrial policy Fiscal & monetary policies Tariff & trade policy Labor policy Exim policy Foreign exchange Policy Foreign investment & technology policy Magnitude and nature of cross border trade flows & financial flows Membership of international organizations like WTO, IMF, World bank, Trade blocks etc.
  • 3.
    ECONOMIC POLICY Theconcept of ‘Economic Policy’ is comprehensive and wide and it covers all those procedures, principles, policies rules and regulations which control the industrial and economic affairs of the country and shape the pattern of industrialization. It incorporates fiscal and monetary policies, industrial policy, the tariff & trade policy, labor policy, exim. policy, foreign exchange policy and foreign investment & technology policy and the Government’s attitude not only towards external assistance but the public and private sectors also.
  • 4.
    Economic Policy "Economicpolicy of any nation is a powerful instrument on the part of policy makers to direct the economy in the desired direction if formulated such a policy properly and implemented effectively. The India’s Economic Policy is formulated keeping into consideration India's immediate as well as long term economic requirements. The India Economic Policy is adopted so far has given rich dividends.
  • 5.
    THRUST OF NEWECONOMIC POLICY “ Any efficient control apparatus has to rely primarily on the accelerator and the steering wheel and only minimally on brakes. Brakes have, no doubt, to be applied to avoid pitfalls and hurdles. But to impart speed to the economy as we must and to steer in the right direction, other levers of the control have to be deployed, such as competition, incentives and penalties” -L.K. Jha
  • 6.
    FOCUS OF NEWECONOMIC POLICY “ There has been however a general agreement that a very distinctive feature of economic policy changes taken as a whole is the greater scope for unfettered expansion they offer to the private sector, particularly in the corporate segment of manufacturing industry, and the opportunities opened up to the multinational enterprises” - K.N. Raj
  • 7.
    Types of EconomicPolicy Macroeconomic stabilization policy tries to keep the money supply growing, but not so quick that it results in excessive inflation. Trade policy refers to tariffs , trade agreements and the international institutions that govern them. Policies designed to create Economic growth Policies related to development economics , Redistribution of income, property, or wealth; Regulation ; Anti-trust ; Industrial policy Technology-based Economic Development Policy
  • 8.
    Objectives of IIP The main objectives of the India Economic Policy is to take care of the basic parameters of the Indian Economy as mentioned below: Agriculture Industry Licensing Policy Monetary Policy Fiscal Policy Commercial Policy Pricing Policy
  • 9.
    New trends inEconomic Policy Improvement in productivity Absorption of modern technology Fuller utilization of capacity Redefined role of Public sector New impetus to private sector
  • 10.
    THE MAIN CONSTITUENTOF THE ECONOMIC POLICY Policy of liberalization accompanied by removal/ relaxation of control; Restoration of the competition; Reorientation of the fiscal policy; Modernization of the industries with a hi-tech bias; A long term perspective; and A bigger role for the private sector
  • 11.
    PRIVATIZATION- THE MAJORCONSTITUENT OF NEP “ Privatization connotes a wide range of Ideas ” “ Privatization is the general process of involving the private sector in the ownership or operations of a state owned enterprise. It also covers ‘contracting out’ and the privatization of the management through management contracts, leases or franchise arrangements”
  • 12.
    MEASURES OF PRIVATIZATIONOwnership measures -Total decentralization -Joint ventures -Liquidation -Management buy-outs Organizational measures - Holding Company structure -Leasing -Restructuring -Disinvestment -Token privatization Operational measures
  • 13.
    Relevant Economic IndicatorsFacilitating Economic Comparisons (Source: WB, WDR-2006) Country/ Region GNI GNI (PPP) GNI per capita GNI (PPP) per capita $ billion Rank $ billion Rank (Dollars) (Dollars) USA 12,151 1 11,655 1 41,400 39,710 Japan 4,750 2 3,838 3 37,180 30,040 Germany 2,489 3 2,310 5 30,120 27,950 UK 2,016 4 1,869 6 33,940 31,460 France 1,859 5 1,759 7 30,090 29,320 China 1,677 6 7,170 2 1,290 5,530 Italy 1,504 7 1,604 8 26,120 27,860 Canada 906 8 978 12 28,390 30,660 Spain 876 9 1,035 9 21,210 25,070 Mexico 703 10 995 10 6,770 9,590 India 675 11 3,347 4 620 3,100 Korea, Rep. 673 12 982 11 13,980 20,400 World 39,834 - 55,584 - 6,280 8,760 High Income Countries 32,064 - 31,000 - 32,040 30,970 Middle Income Countries 6,594 - 19,483 - 2,190 6,480 Low Income Countries 1,184 - 5,279 - 510 2,260
  • 14.
    Contribution of ServicesSector To Value Added as % of GDP (Source: WB, WDR-2009) Country/Region 1980 1990 2003 2009 (Apprx.) World 56 60 68 70 High Income Economies 59 64 71 72 Low & Middle Income Economies 42 46 51 55 India 39 42 52 54
  • 15.
    Revenue , Fiscal& Primary Deficit Revenue Deficit = Revenue Expenditure – Revenue Receipts Fiscal Deficit = Total Expenditure (Revenue + Capital) – Total Income (Revenue Receipts + Recovery of Loans + Other Receipts) Primary Deficit = Fiscal Deficit – Interest Payments
  • 16.
    Performance of EconomicPolicy till December, 2010 ( Some useful indicators) The overall growth of Gross Domestic Product (GDP) at factor cost at constant prices, as per the Revised Estimates of CSO was 7.4 per cent in 2009-10. The growth in GDP is placed at 8.9 per cent in the second quarter of 2010-11. Overall growth in the Index of Industrial Production (IIP) was 2.7 per cent during November 2010 as compared to 11.3 per cent in November 2009. During April-November 2010-11, IIP growth was 9.5 per cent as compared to 7.4 per cent during April-November 2009-10.
  • 17.
    Performance of economicpolicy (Some useful indicators) Core infrastructure-supportive sectors grew by 2.3 per cent in November 2010 as compared to the growth of 5.9 per cent in November 2009. During April-November 2010-11, these sectors grew by 5.0 per cent as compared to 4.5 per cent during April-November 2009-10. Broad money (M3) (up to December 17, 2010) increased by 7.7 per cent as compared to 9.4 per cent during the corresponding period of the last year. The year-on-year growth, as on December 17, 2010 was 15.0 per cent as compared to 18.0 per cent last year.
  • 18.
    Performance of economicpolicy (Some useful indicators) Exports, in US dollar terms increased by 26.5 per cent and imports increased by 11.2 per cent, during November 2010. Foreign Currency Assets stood at US $ 268.1 billion at end December 2010 compared to US$ 258.8 billion at end December 2009. Rupee appreciated against Pound Sterling, Japanese Yen and Euro, and depreciated against US Dollar in the month of December 2010 over November 2010 Year-on-year inflation in terms of Wholesale Price Index was 8.43 per cent for the month of December, 2010 as compared to 6.92 per cent in December, 2009.
  • 19.
    Performance……… Tax revenue(net to Centre) during April-November, 2010-11 recorded a growth of 27.4 per cent compared with corresponding period of 2009-10. Non-tax revenue grew by 142.5 per cent in April-November 2010-11 on account of one-off nature of receipts of proceeds from Spectrum auction.
  • 20.
    Rupee Movement Rupeecomes from: Borrowings and other liabilities 14p Corporate Tax 24p Income tax 15p Customs 13p Excise 15p Service tax & other taxes 7p Non tax revenue 10p Non-debt capital receipts 2 p 100p Rupee goes to: Central plan 19p Interest 21p Defence 11p Subsidies 8p Other non-plan expenditure 10p States share of taxes and duties 19p Non-plan assistance to States & UTs. 5p State & UT plan assistance 7p 100p