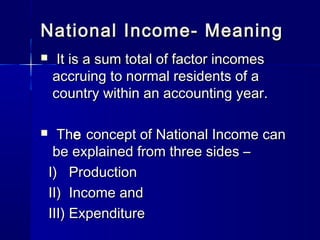
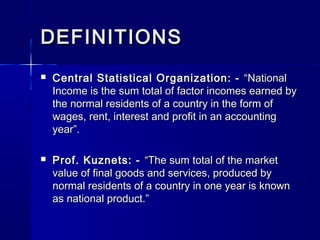
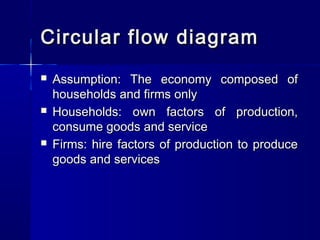
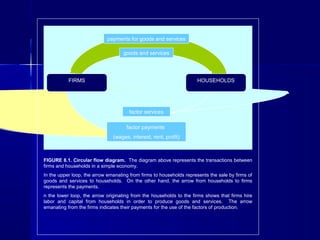
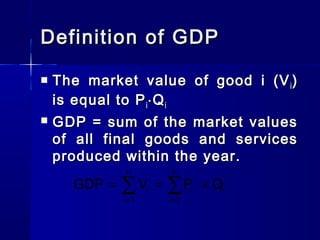
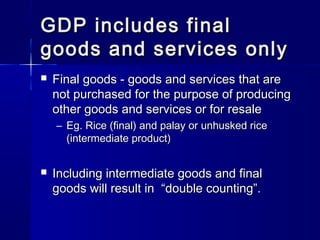
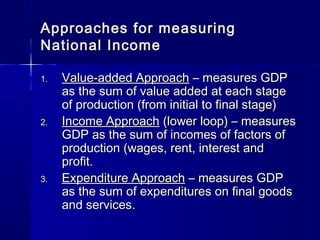
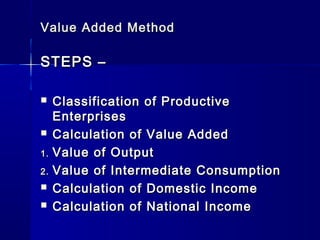
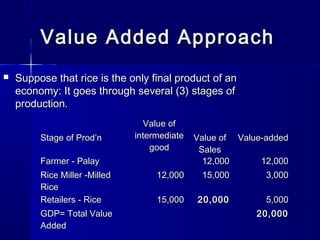
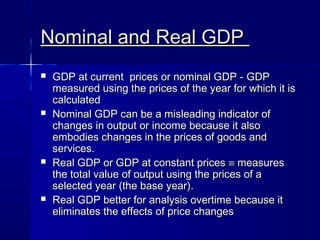
National income is defined as the sum total of factor incomes earned by normal residents of a country within an accounting year. It can be measured using the production, income, and expenditure approaches. The value added method sums the value added at each stage of production to measure GDP. The income method measures GDP as the sum of incomes from wages, rent, interest, and profits. The expenditure method measures GDP as the sum of final consumption and investment expenditures. National income provides important information about a country's economic activity and living standards.
The G20 is an apt model for global cooperation in today’s world. Its response to the global financial crisis is a testament to the impact G20 members can make when working together. The G20 introduced trillions of dollars in fiscal stimulus packages worldwide, which saved or created millions of jobs that would otherwise have been destroyed. It also put in place measures to limit the collapse of financial markets and helped maintain consumer and business confidence.
This is showing the developing countries' situation. Compiled to teach Japanese high school students about developing countries. It was also made for those interested in attending university is Development related courses.
World Trade Organization- Brief OverviewKashyap Shah
How and WHY GATT changed to WTO ?
What are the various functions & objectives of WTO.
Some of the key characteristics of WTO Agreements
From India's Perspective- Advantages & Disadvantages
Concept of national income and comparison with pakistanAgamya Dixit
It discusses the various concepts of national income like GDP, GNP, circular flow of income , etc .. It also brings to light the data related to national income for past few years and the trends. It also presents a comparison with the national income trends of Pakistan.
Business Valuation Principles for EntrepreneursBen Wann
This insightful presentation is designed to equip entrepreneurs with the essential knowledge and tools needed to accurately value their businesses. Understanding business valuation is crucial for making informed decisions, whether you're seeking investment, planning to sell, or simply want to gauge your company's worth.
[Note: This is a partial preview. To download this presentation, visit:
https://www.oeconsulting.com.sg/training-presentations]
Sustainability has become an increasingly critical topic as the world recognizes the need to protect our planet and its resources for future generations. Sustainability means meeting our current needs without compromising the ability of future generations to meet theirs. It involves long-term planning and consideration of the consequences of our actions. The goal is to create strategies that ensure the long-term viability of People, Planet, and Profit.
Leading companies such as Nike, Toyota, and Siemens are prioritizing sustainable innovation in their business models, setting an example for others to follow. In this Sustainability training presentation, you will learn key concepts, principles, and practices of sustainability applicable across industries. This training aims to create awareness and educate employees, senior executives, consultants, and other key stakeholders, including investors, policymakers, and supply chain partners, on the importance and implementation of sustainability.
LEARNING OBJECTIVES
1. Develop a comprehensive understanding of the fundamental principles and concepts that form the foundation of sustainability within corporate environments.
2. Explore the sustainability implementation model, focusing on effective measures and reporting strategies to track and communicate sustainability efforts.
3. Identify and define best practices and critical success factors essential for achieving sustainability goals within organizations.
CONTENTS
1. Introduction and Key Concepts of Sustainability
2. Principles and Practices of Sustainability
3. Measures and Reporting in Sustainability
4. Sustainability Implementation & Best Practices
To download the complete presentation, visit: https://www.oeconsulting.com.sg/training-presentations
Unveiling the Secrets How Does Generative AI Work.pdfSam H
At its core, generative artificial intelligence relies on the concept of generative models, which serve as engines that churn out entirely new data resembling their training data. It is like a sculptor who has studied so many forms found in nature and then uses this knowledge to create sculptures from his imagination that have never been seen before anywhere else. If taken to cyberspace, gans work almost the same way.
Accpac to QuickBooks Conversion Navigating the Transition with Online Account...PaulBryant58
This article provides a comprehensive guide on how to
effectively manage the convert Accpac to QuickBooks , with a particular focus on utilizing online accounting services to streamline the process.
RMD24 | Debunking the non-endemic revenue myth Marvin Vacquier Droop | First ...BBPMedia1
Marvin neemt je in deze presentatie mee in de voordelen van non-endemic advertising op retail media netwerken. Hij brengt ook de uitdagingen in beeld die de markt op dit moment heeft op het gebied van retail media voor niet-leveranciers.
Retail media wordt gezien als het nieuwe advertising-medium en ook mediabureaus richten massaal retail media-afdelingen op. Merken die niet in de betreffende winkel liggen staan ook nog niet in de rij om op de retail media netwerken te adverteren. Marvin belicht de uitdagingen die er zijn om echt aansluiting te vinden op die markt van non-endemic advertising.
Falcon stands out as a top-tier P2P Invoice Discounting platform in India, bridging esteemed blue-chip companies and eager investors. Our goal is to transform the investment landscape in India by establishing a comprehensive destination for borrowers and investors with diverse profiles and needs, all while minimizing risk. What sets Falcon apart is the elimination of intermediaries such as commercial banks and depository institutions, allowing investors to enjoy higher yields.
As a business owner in Delaware, staying on top of your tax obligations is paramount, especially with the annual deadline for Delaware Franchise Tax looming on March 1. One such obligation is the annual Delaware Franchise Tax, which serves as a crucial requirement for maintaining your company’s legal standing within the state. While the prospect of handling tax matters may seem daunting, rest assured that the process can be straightforward with the right guidance. In this comprehensive guide, we’ll walk you through the steps of filing your Delaware Franchise Tax and provide insights to help you navigate the process effectively.
What are the main advantages of using HR recruiter services.pdfHumanResourceDimensi1
HR recruiter services offer top talents to companies according to their specific needs. They handle all recruitment tasks from job posting to onboarding and help companies concentrate on their business growth. With their expertise and years of experience, they streamline the hiring process and save time and resources for the company.
2. National Income- MeaningNational Income- Meaning
It is a sum total of factor incomesIt is a sum total of factor incomes
accruing to normal residents of aaccruing to normal residents of a
country within an accounting year.country within an accounting year.
ThThee concept of National Income canconcept of National Income can
be explained from three sides –be explained from three sides –
I) ProductionI) Production
II) Income andII) Income and
III) ExpenditureIII) Expenditure
3. DEFINITIONSDEFINITIONS
Central Statistical Organization: -Central Statistical Organization: - “National“National
Income is the sum total of factor incomes earned byIncome is the sum total of factor incomes earned by
the normal residents of a country in the form ofthe normal residents of a country in the form of
wages, rent, interest and profit in an accountingwages, rent, interest and profit in an accounting
year”.year”.
Prof. Kuznets: -Prof. Kuznets: - “The sum total of the market“The sum total of the market
value of final goods and services, produced byvalue of final goods and services, produced by
normal residents of a country in one year is knownnormal residents of a country in one year is known
as national product.”as national product.”
4. Circular flow diagramCircular flow diagram
summarizes the transactions betweensummarizes the transactions between
the different economic agentsthe different economic agents
agents: households, firms (business),agents: households, firms (business),
government, and foreigners (rest ofgovernment, and foreigners (rest of
the world)the world)
5. Circular flow diagramCircular flow diagram
Assumption: The economy composed ofAssumption: The economy composed of
households and firms onlyhouseholds and firms only
Households: own factors of production,Households: own factors of production,
consume goods and serviceconsume goods and service
Firms: hire factors of production to produceFirms: hire factors of production to produce
goods and servicesgoods and services
6. FIGURE 8.1. Circular flow diagram. The diagram above represents the transactions between
firms and households in a simple economy.
In the upper loop, the arrow emanating from firms to households represents the sale by firms of
goods and services to households. On the other hand, the arrow from households to firms
represents the payments.
n the lower loop, the arrow originating from the households to the firms shows that firms hire
labor and capital from households in order to produce goods and services. The arrow
emanating from the firms indicates their payments for the use of the factors of production.
factor payments
(wages, interest, rent, profit)
factor services
goods and services
payments for goods and services
HOUSEHOLDSFIRMS
7. MARKETS FOR
FACTORS OF
PRODUCTION
MARKETS FOR
GOODS AND
SERVICES
FIRMS HOUSEHOLDS
Good and
services
bought
Good and
services sold
Revenue
(=GDP)
Spending
(=GDP)
Inputs for
Production
Land, labor
and capital
Wages, rent,
interest and
profit (=GDP)
Flow of goods & services
Flow of money: pesos
Income (=GDP)
THE CIRCULAR FLOW DIAGRAM
8. Transfer paymentsTransfer payments
Transfer payments – are transactionsTransfer payments – are transactions
wherein one party is not obliged towherein one party is not obliged to
deliver a good or service in return fordeliver a good or service in return for
the payment.the payment.
Examples: retirement benefits,Examples: retirement benefits,
unemployment benefits, scholarships,unemployment benefits, scholarships,
and donationsand donations..
9. Concepts/Aggregates of NationalConcepts/Aggregates of National
IncomeIncome
Gross Domestic Product at Market Price (GDPGross Domestic Product at Market Price (GDPMPMP))
Gross National Product at Market Price (GDPGross National Product at Market Price (GDPMPMP))
Net National Product at Market Price (NNPNet National Product at Market Price (NNPMPMP))
Net Domestic Product at Market Price (NDPNet Domestic Product at Market Price (NDPMPMP))
Gross Domestic Product at Factor Cost (GDPGross Domestic Product at Factor Cost (GDPFCFC))
Gross National Product at Factor Cost (GNPGross National Product at Factor Cost (GNPFCFC))
Net National Product at Factor Cost (NNPNet National Product at Factor Cost (NNPFCFC))
Net Domestic Product at Factor Cost (NDPNet Domestic Product at Factor Cost (NDPFCFC))
Factor Income From Net Domestic ProductFactor Income From Net Domestic Product
Accruing to Private SectorAccruing to Private Sector
Private IncomePrivate Income
10. Basic Concepts -Basic Concepts -
Domestic and National ConceptsDomestic and National Concepts
1.Domestic Income = National Income – NFYA1.Domestic Income = National Income – NFYA
2. National Income = Domestic Income + NFYA2. National Income = Domestic Income + NFYA
Market Price and Factor Cost ConceptsMarket Price and Factor Cost Concepts
1.1. Market Price = Factor Cost + NITMarket Price = Factor Cost + NIT
2.2. Factor Cost = Market Price – NITFactor Cost = Market Price – NIT
Gross and Net ConceptsGross and Net Concepts
1.1. Gross Product = Net Product + DepreciationGross Product = Net Product + Depreciation
2.2. Net product = Gross Product – DepreciationNet product = Gross Product – Depreciation
11. Definition of GDPDefinition of GDP
The market value of good i (VThe market value of good i (Vii ))
is equal to Pis equal to Pii ⋅⋅QQii
GDP = sum of the market valuesGDP = sum of the market values
of all final goods and servicesof all final goods and services
produced within the year.produced within the year.
= =
= = ×∑ ∑
n n
i i i
i 1 i 1
GDP V P Q
12. GDP includes finalGDP includes final
goods and services onlygoods and services only
Final goods - goods and services that areFinal goods - goods and services that are
not purchased for the purpose of producingnot purchased for the purpose of producing
other goods and services or for resaleother goods and services or for resale
– Eg. Rice (final) and palay or unhusked riceEg. Rice (final) and palay or unhusked rice
(intermediate product)(intermediate product)
Including intermediate goods and finalIncluding intermediate goods and final
goods will result in “double counting”.goods will result in “double counting”.
13. Approaches for measuringApproaches for measuring
National IncomeNational Income
1.1. Value-added ApproachValue-added Approach – measures GDP– measures GDP
as the sum of value added at each stageas the sum of value added at each stage
of production (from initial to final stage)of production (from initial to final stage)
2.2. Income ApproachIncome Approach (lower loop) – measures(lower loop) – measures
GDP as the sum of incomes of factors ofGDP as the sum of incomes of factors of
production (wages, rent, interest andproduction (wages, rent, interest and
profit.profit.
3.3. Expenditure ApproachExpenditure Approach – measures GDP– measures GDP
as the sum of expenditures on final goodsas the sum of expenditures on final goods
and services.and services.
14. Value Added MethodValue Added Method
STEPS –STEPS –
Classification of ProductiveClassification of Productive
EnterprisesEnterprises
Calculation of Value AddedCalculation of Value Added
1.1. Value of OutputValue of Output
2.2. Value of Intermediate ConsumptionValue of Intermediate Consumption
Calculation of Domestic IncomeCalculation of Domestic Income
Calculation of National IncomeCalculation of National Income
15. Value Added ApproachValue Added Approach
Suppose that rice is the only final product of anSuppose that rice is the only final product of an
economy: It goes through several (3) stages ofeconomy: It goes through several (3) stages of
production.production.
Stage of Prod’nStage of Prod’n
Value ofValue of
intermediateintermediate
goodgood
Value ofValue of
SalesSales
Value-addedValue-added
Farmer - PalayFarmer - Palay 12,00012,000 12,00012,000
Rice Miller -MilledRice Miller -Milled
RiceRice
12,00012,000 15,00015,000 3,0003,000
Retailers - RiceRetailers - Rice 15,00015,000 20,00020,000 5,0005,000
GDP= Total ValueGDP= Total Value
AddedAdded
20,00020,000
16. Cautions Regarding Value AddedCautions Regarding Value Added
1) Value of intermediate goods is not1) Value of intermediate goods is not
included in Product Method.included in Product Method.
2) Value of second hand goods is not2) Value of second hand goods is not
included in product method.included in product method.
3) Imputed rent is included in this3) Imputed rent is included in this
method.method.
17. Income MethodIncome Method
STEPSSTEPS
Classification of ProductiveClassification of Productive
EnterprisesEnterprises
Classification of Factor IncomeClassification of Factor Income
1.1. Compensation of Employees (COE)Compensation of Employees (COE)
2.2. Operating Surplus (O.S.)Operating Surplus (O.S.)
3.3. Mixed IncomeMixed Income
Calculation of Domestic IncomeCalculation of Domestic Income
Calculation of National IncomeCalculation of National Income
18. Income ApproachIncome Approach
ITEMS SYMBOLS VALUE
Compensation of
Employees
COE 1,093,800
Operating Surplus OS 2,215,100
Depreciation D 357,200
Net Indirect Taxes NIT 356,600
Gross Domestic Product GDP 4,022,700
19. Cautions Regarding IncomeCautions Regarding Income
MethodsMethods
Windfall gainsWindfall gains
Income from illegal activitiesIncome from illegal activities
Transfer earningsTransfer earnings
The sale and purchase of secondThe sale and purchase of second
hand goodshand goods
Imputed value of servicesImputed value of services
20. Expenditure MethodExpenditure Method
STEPSSTEPS
Identification and classification ofIdentification and classification of
Economic Units incurring FinalEconomic Units incurring Final
ExpenditureExpenditure
Classification of Final ExpenditureClassification of Final Expenditure
1.1. Final Consumption ExpenditureFinal Consumption Expenditure
2.2. Final Investment ExpenditureFinal Investment Expenditure
Calculation of Domestic IncomeCalculation of Domestic Income
21. NDPNDPFCFC = Private Final Consumption= Private Final Consumption
Expenditure + Government FinalExpenditure + Government Final
Consumption Expenditure + GrossConsumption Expenditure + Gross
Domestic Capital Expenditure (GrossDomestic Capital Expenditure (Gross
Fixed Capital Formation + Change inFixed Capital Formation + Change in
Stock) + Net Exports (Exports –Stock) + Net Exports (Exports –
Imports)- Dep.-NITImports)- Dep.-NIT
Calculation of National IncomeCalculation of National Income
22. Cautions Regarding ExpenditureCautions Regarding Expenditure
MethodMethod
Only final expenditure is included inOnly final expenditure is included in
national income.national income.
Expenditure on shares and bonds areExpenditure on shares and bonds are
not included.not included.
Expenditure on second hand goods isExpenditure on second hand goods is
not included in national income.not included in national income.
Expenditure on transfer payments isExpenditure on transfer payments is
not included in national income.not included in national income.
23. Nominal and Real GDPNominal and Real GDP
GDP at current prices or nominal GDP -GDP at current prices or nominal GDP - GDPGDP
measured using the prices of the year for which it ismeasured using the prices of the year for which it is
calculatedcalculated
Nominal GDP can be a misleading indicator ofNominal GDP can be a misleading indicator of
changes in output or income because it alsochanges in output or income because it also
embodies changes in the prices of goods andembodies changes in the prices of goods and
services.services.
Real GDP or GDP at constant pricesReal GDP or GDP at constant prices ≡≡ measuresmeasures
the total value of output using the prices of athe total value of output using the prices of a
selected year (the base year).selected year (the base year).
Real GDP better for analysis overtime because itReal GDP better for analysis overtime because it
eliminates the effects of price changeseliminates the effects of price changes
26. GDP per capitaGDP per capita
Measures how much output or income wasMeasures how much output or income was
produced or received, on the average, by anproduced or received, on the average, by an
individual in an economyindividual in an economy
Useful for comparing the performance of a countryUseful for comparing the performance of a country
overtime and a country’s performance relative to itsovertime and a country’s performance relative to its
neighborsneighbors
GDP
GDP per capita
population
=
27. Per Capita GNI Per Capita GNI Poverty rate
Myanmar b
217 26.6
Nepal 250 30.9
Cambodia 350 34.7
Lao PDR 390 33.5
Bangladesh 440 49.8
Viet Nam 540 19.5
Pakistan 600 32.6
India 620 26.1
Sri Lanka 1010 22.7
Indonesia 1140 18.2
Philippines 1170 30.0
China 1500 3.1
Thailand 2490 9.8
Malaysia 4520 7.5
Korea, Rep. of 14000 3.6
Taiwan 14770 0.8
Singapore 24760 0.0
PER CAPITA GROSS NATIONAL INCOME, 2004 (US$)
28. Some Limitations of GDP orSome Limitations of GDP or
GNP as measures of growthGNP as measures of growth
Ignores income distributionIgnores income distribution
Ignores environmental degradationIgnores environmental degradation
Does not include activities that do notDoes not include activities that do not
go through the formal markets sectorsgo through the formal markets sectors
Does not include “illegal” activities likeDoes not include “illegal” activities like
drug trafficking, prostitution,drug trafficking, prostitution,
moonlightingmoonlighting