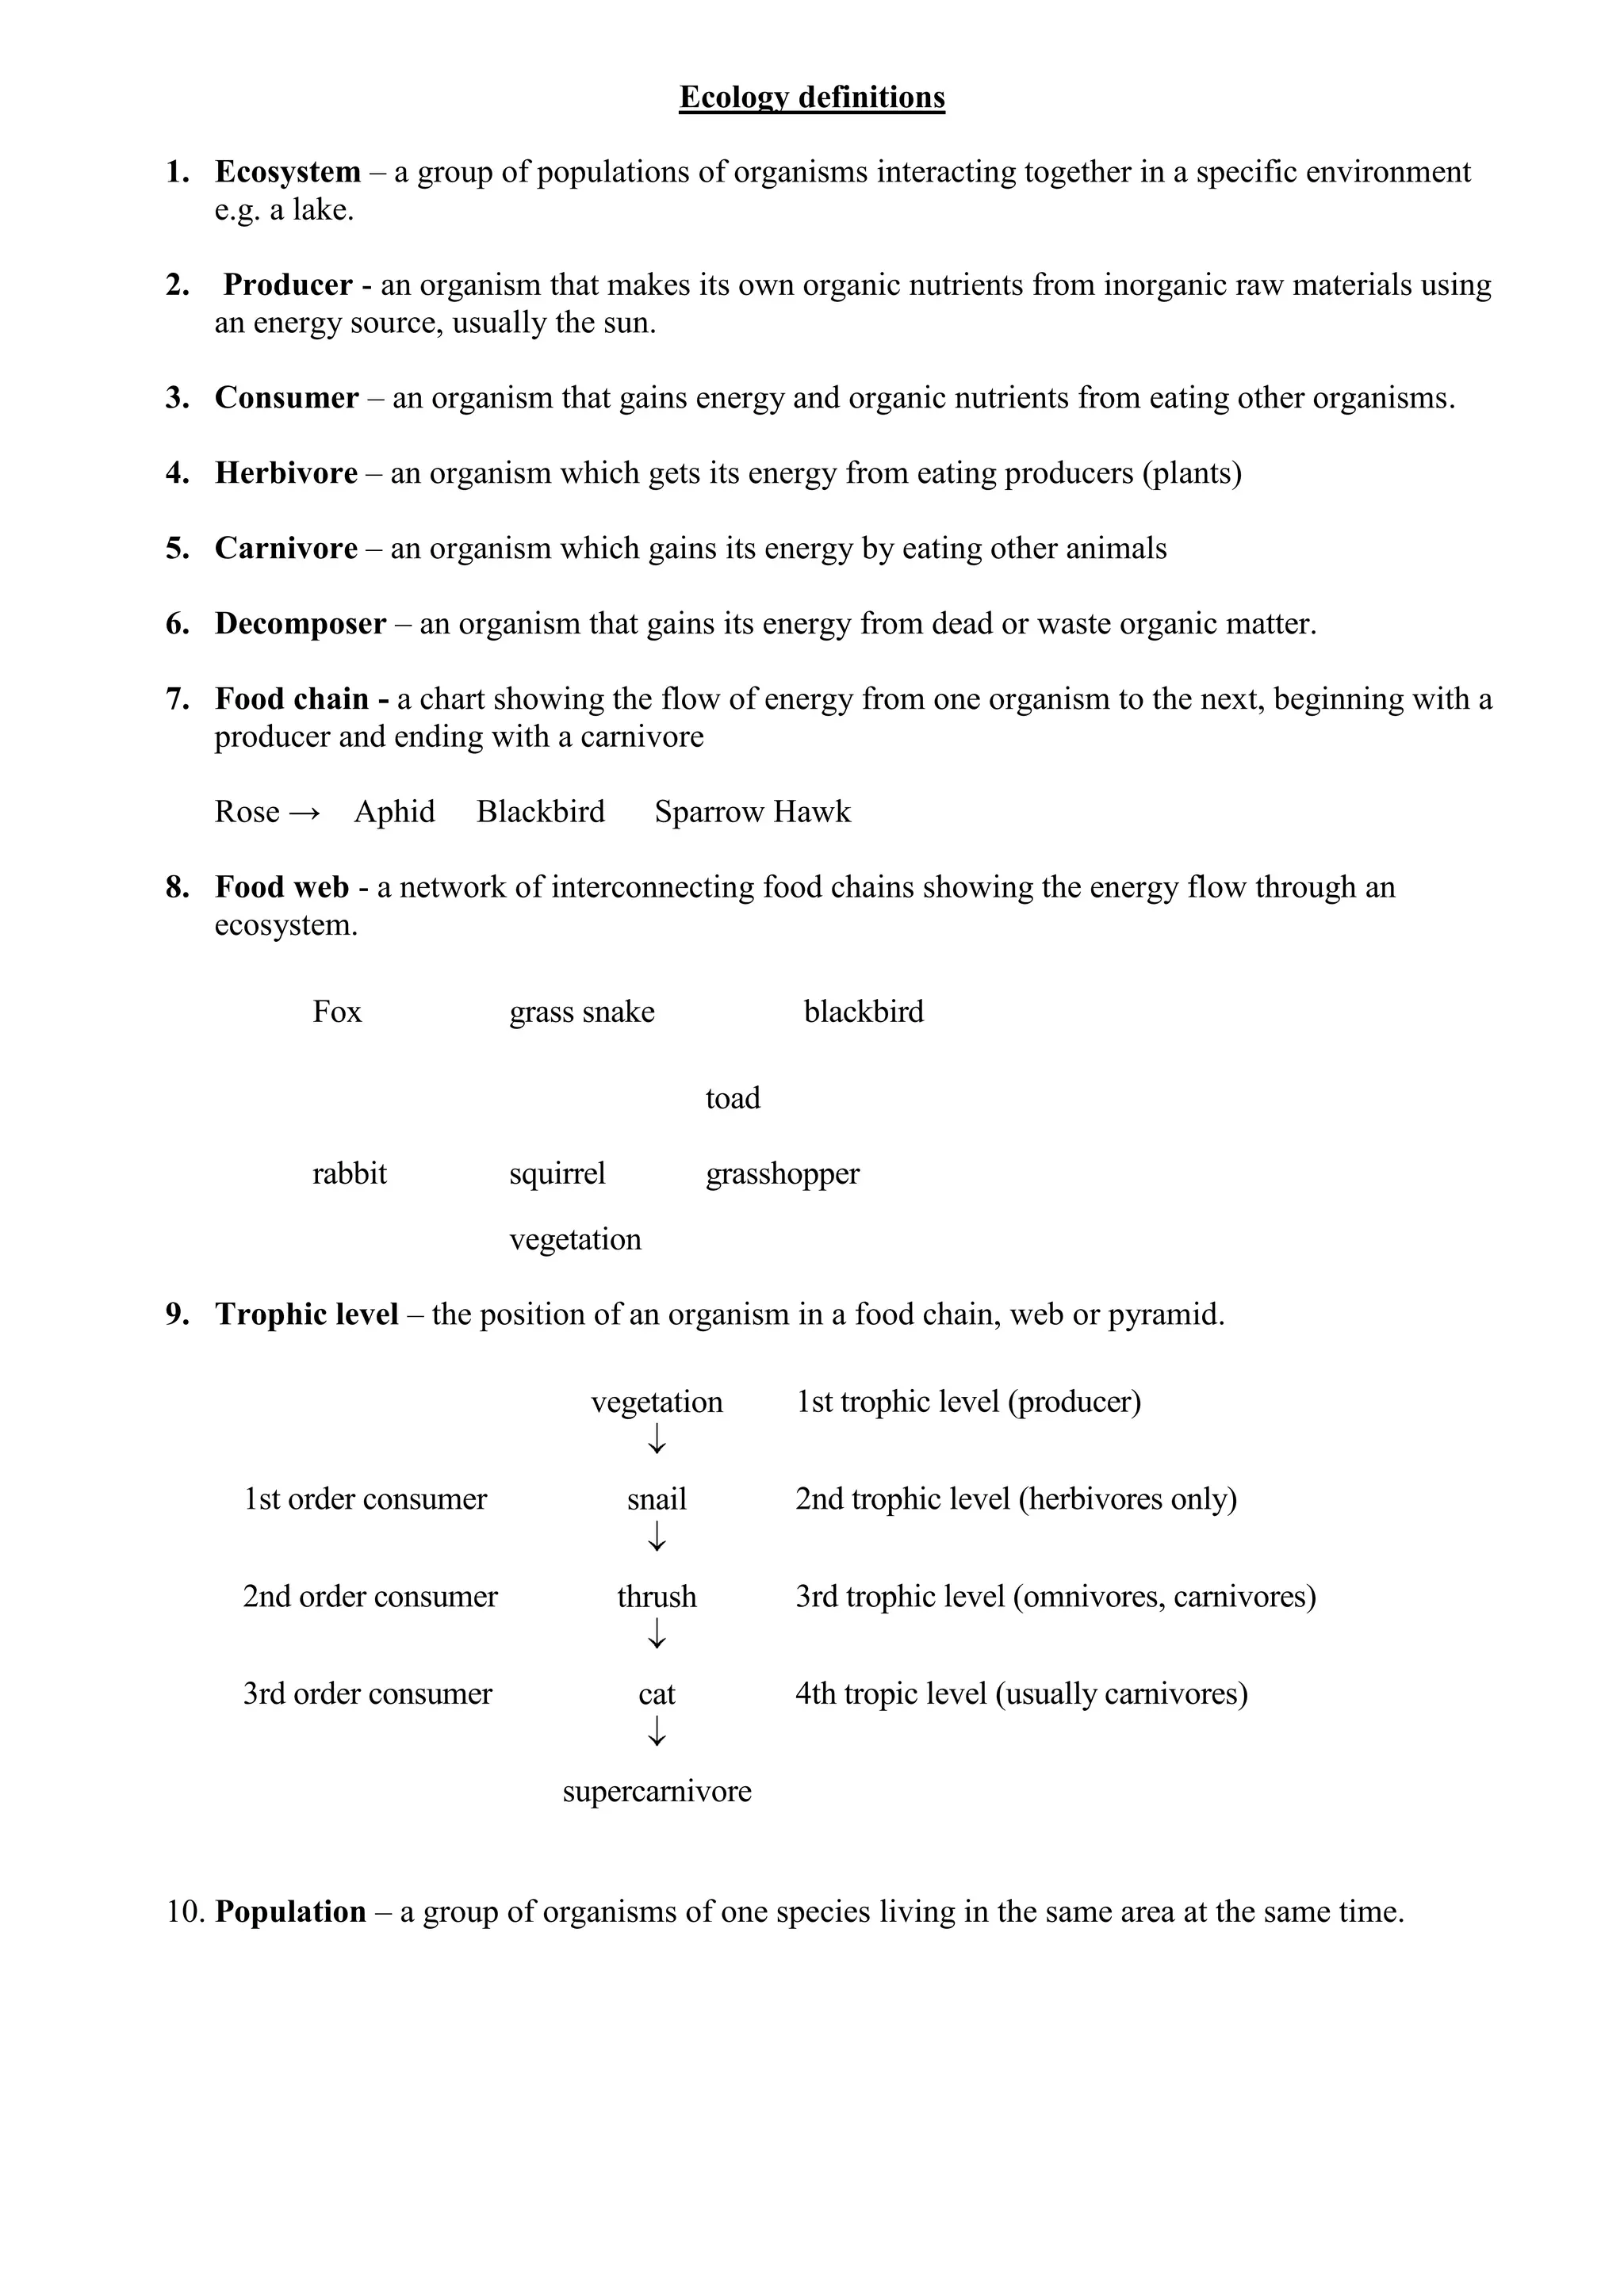
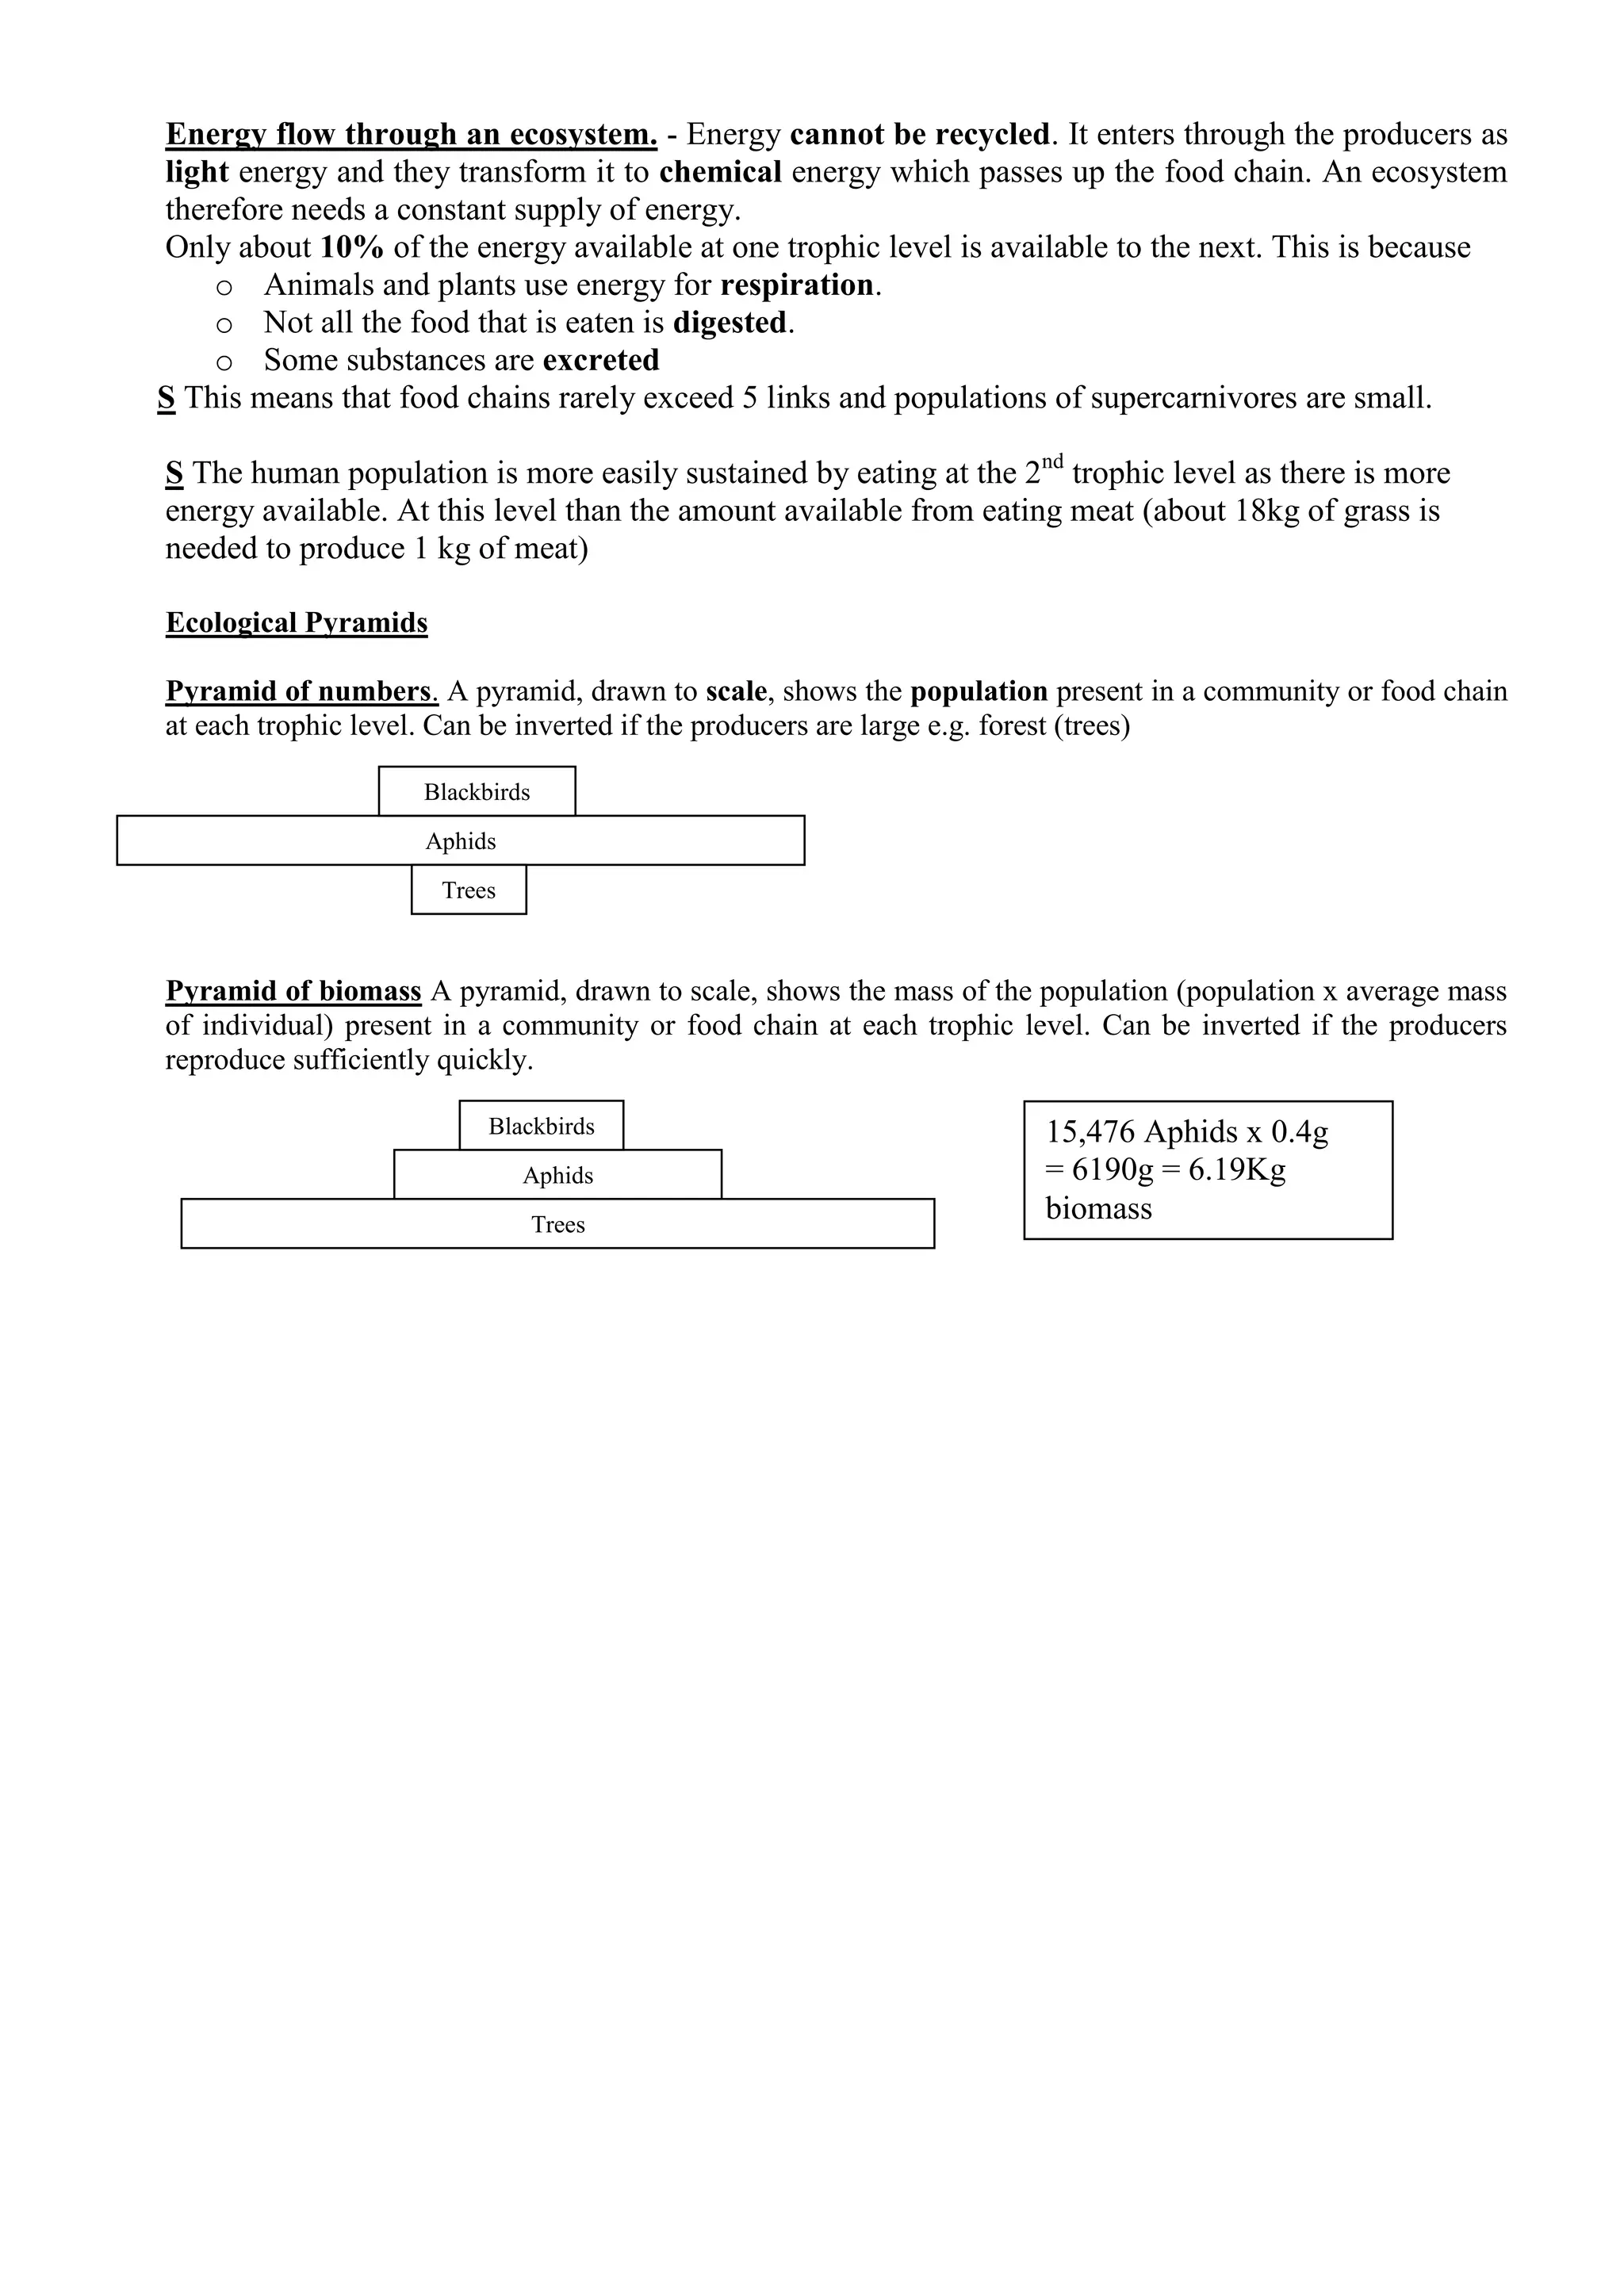
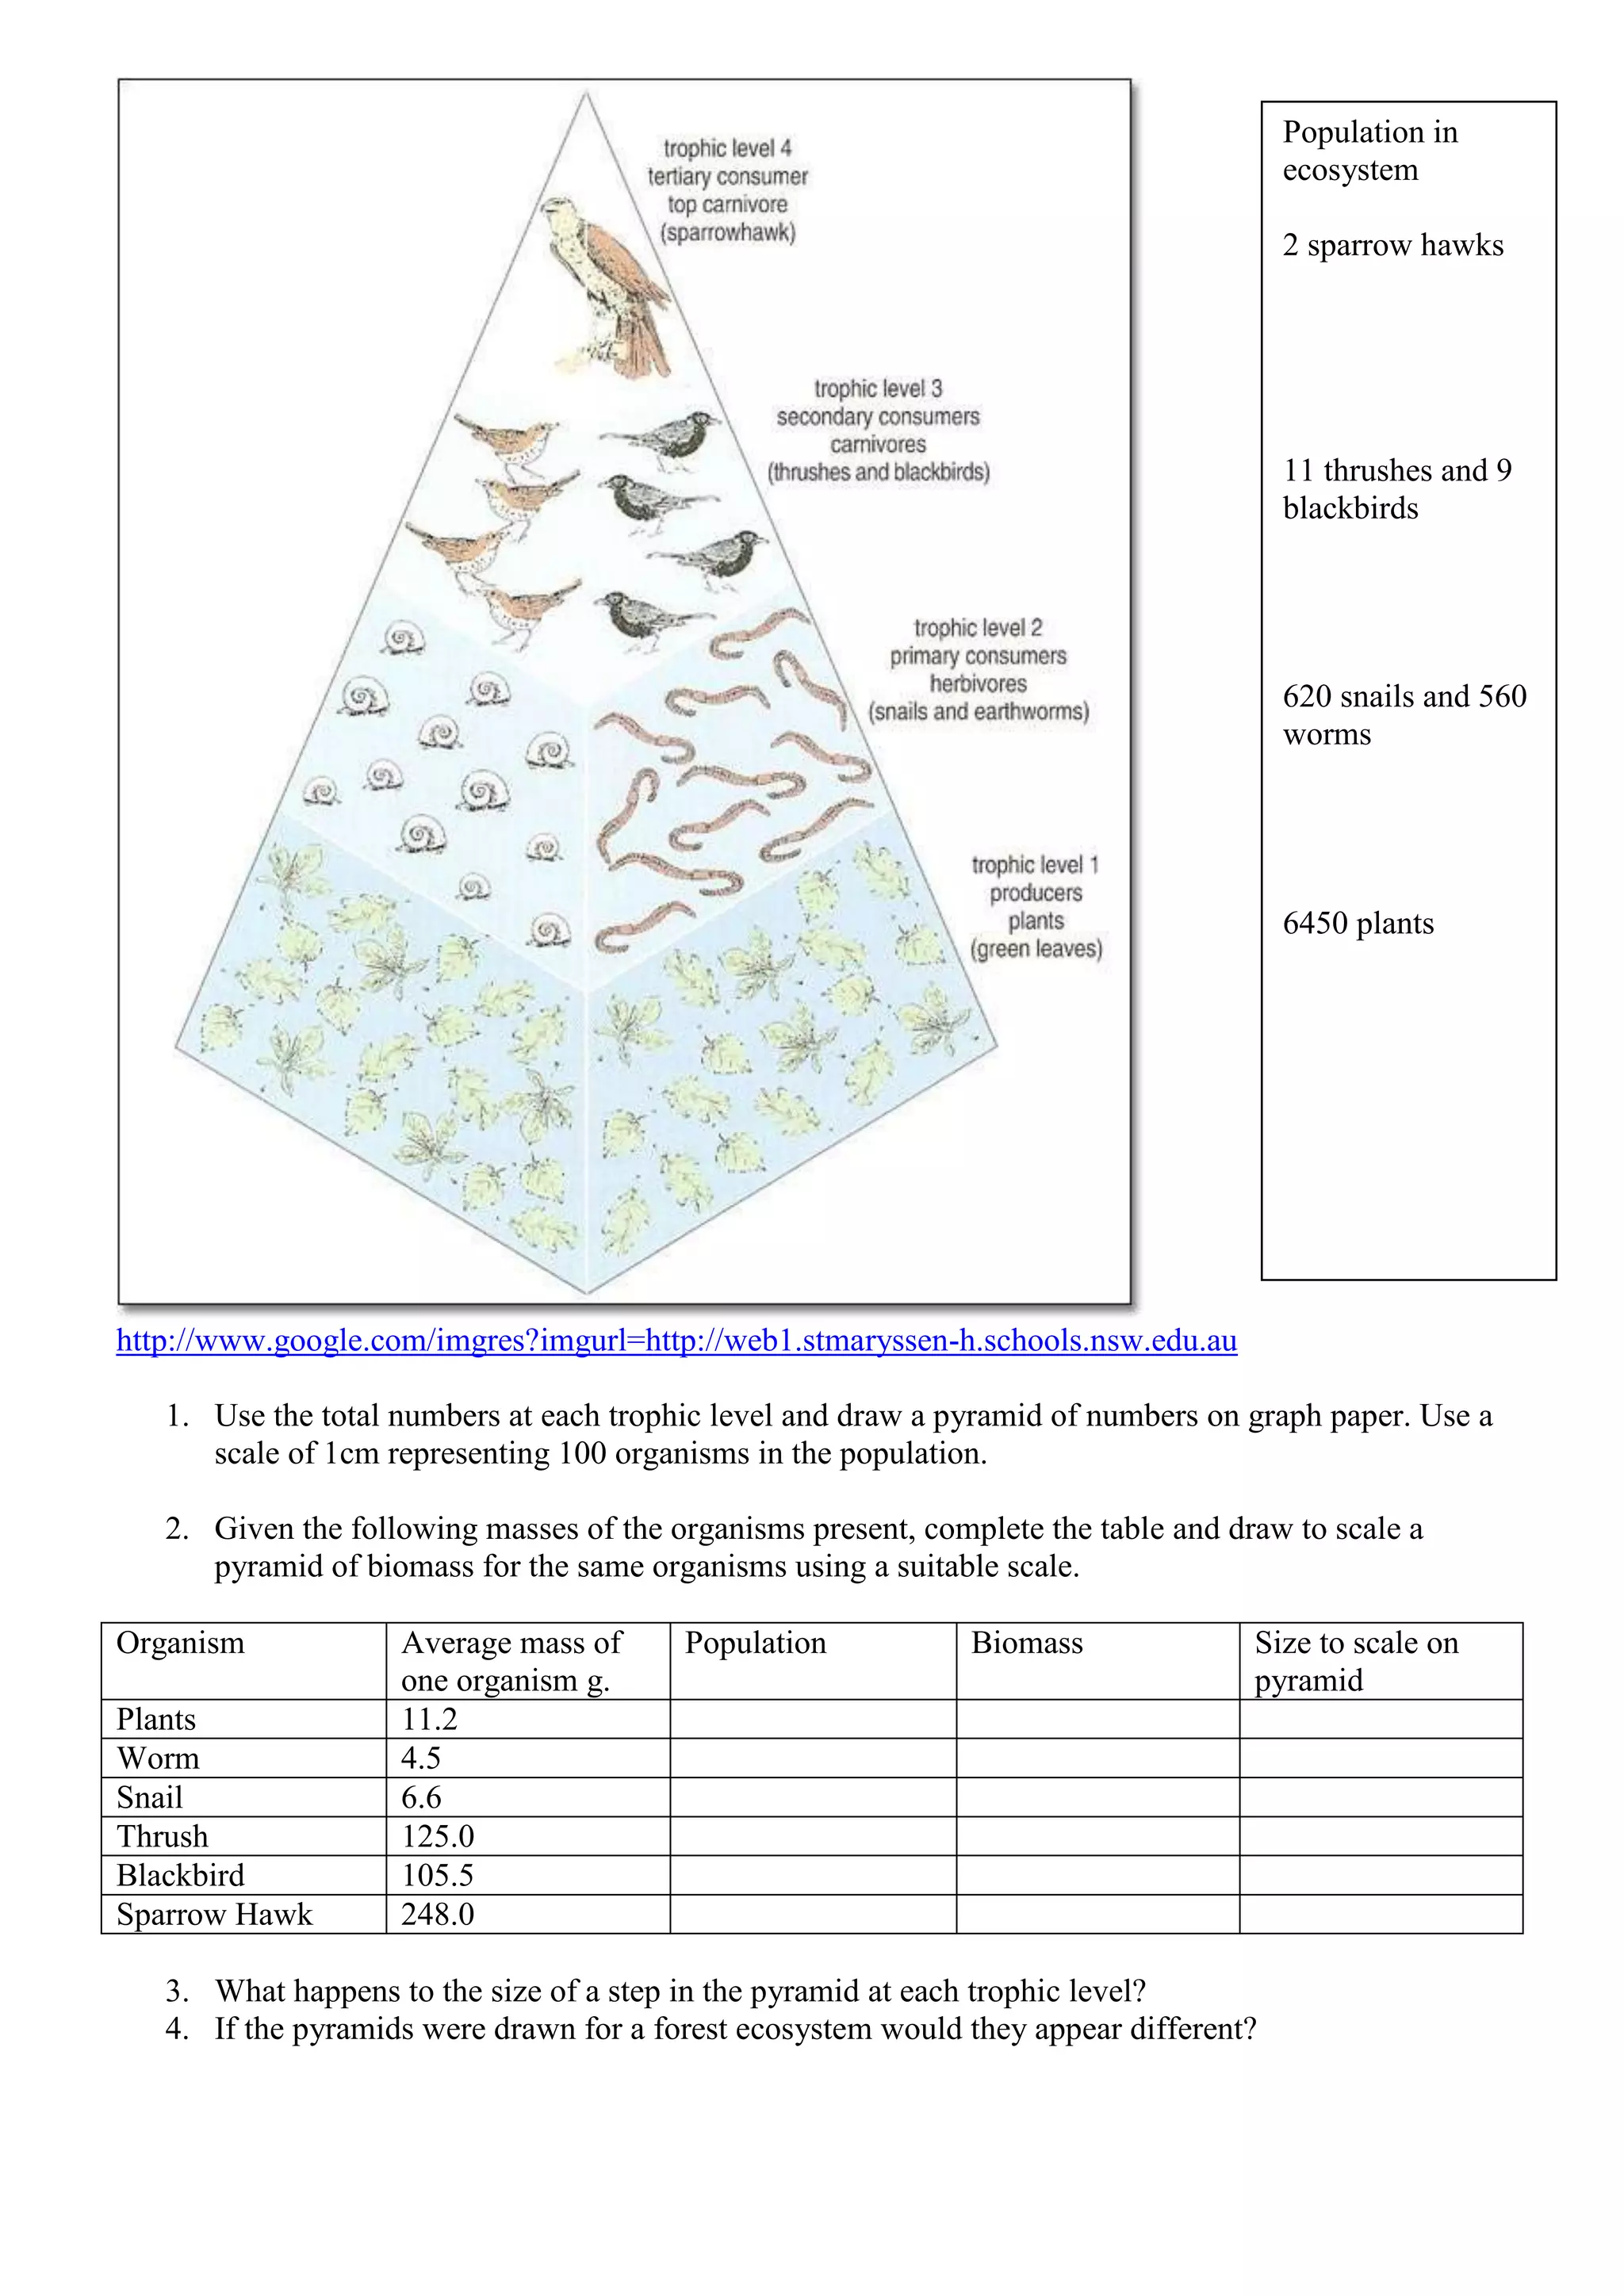
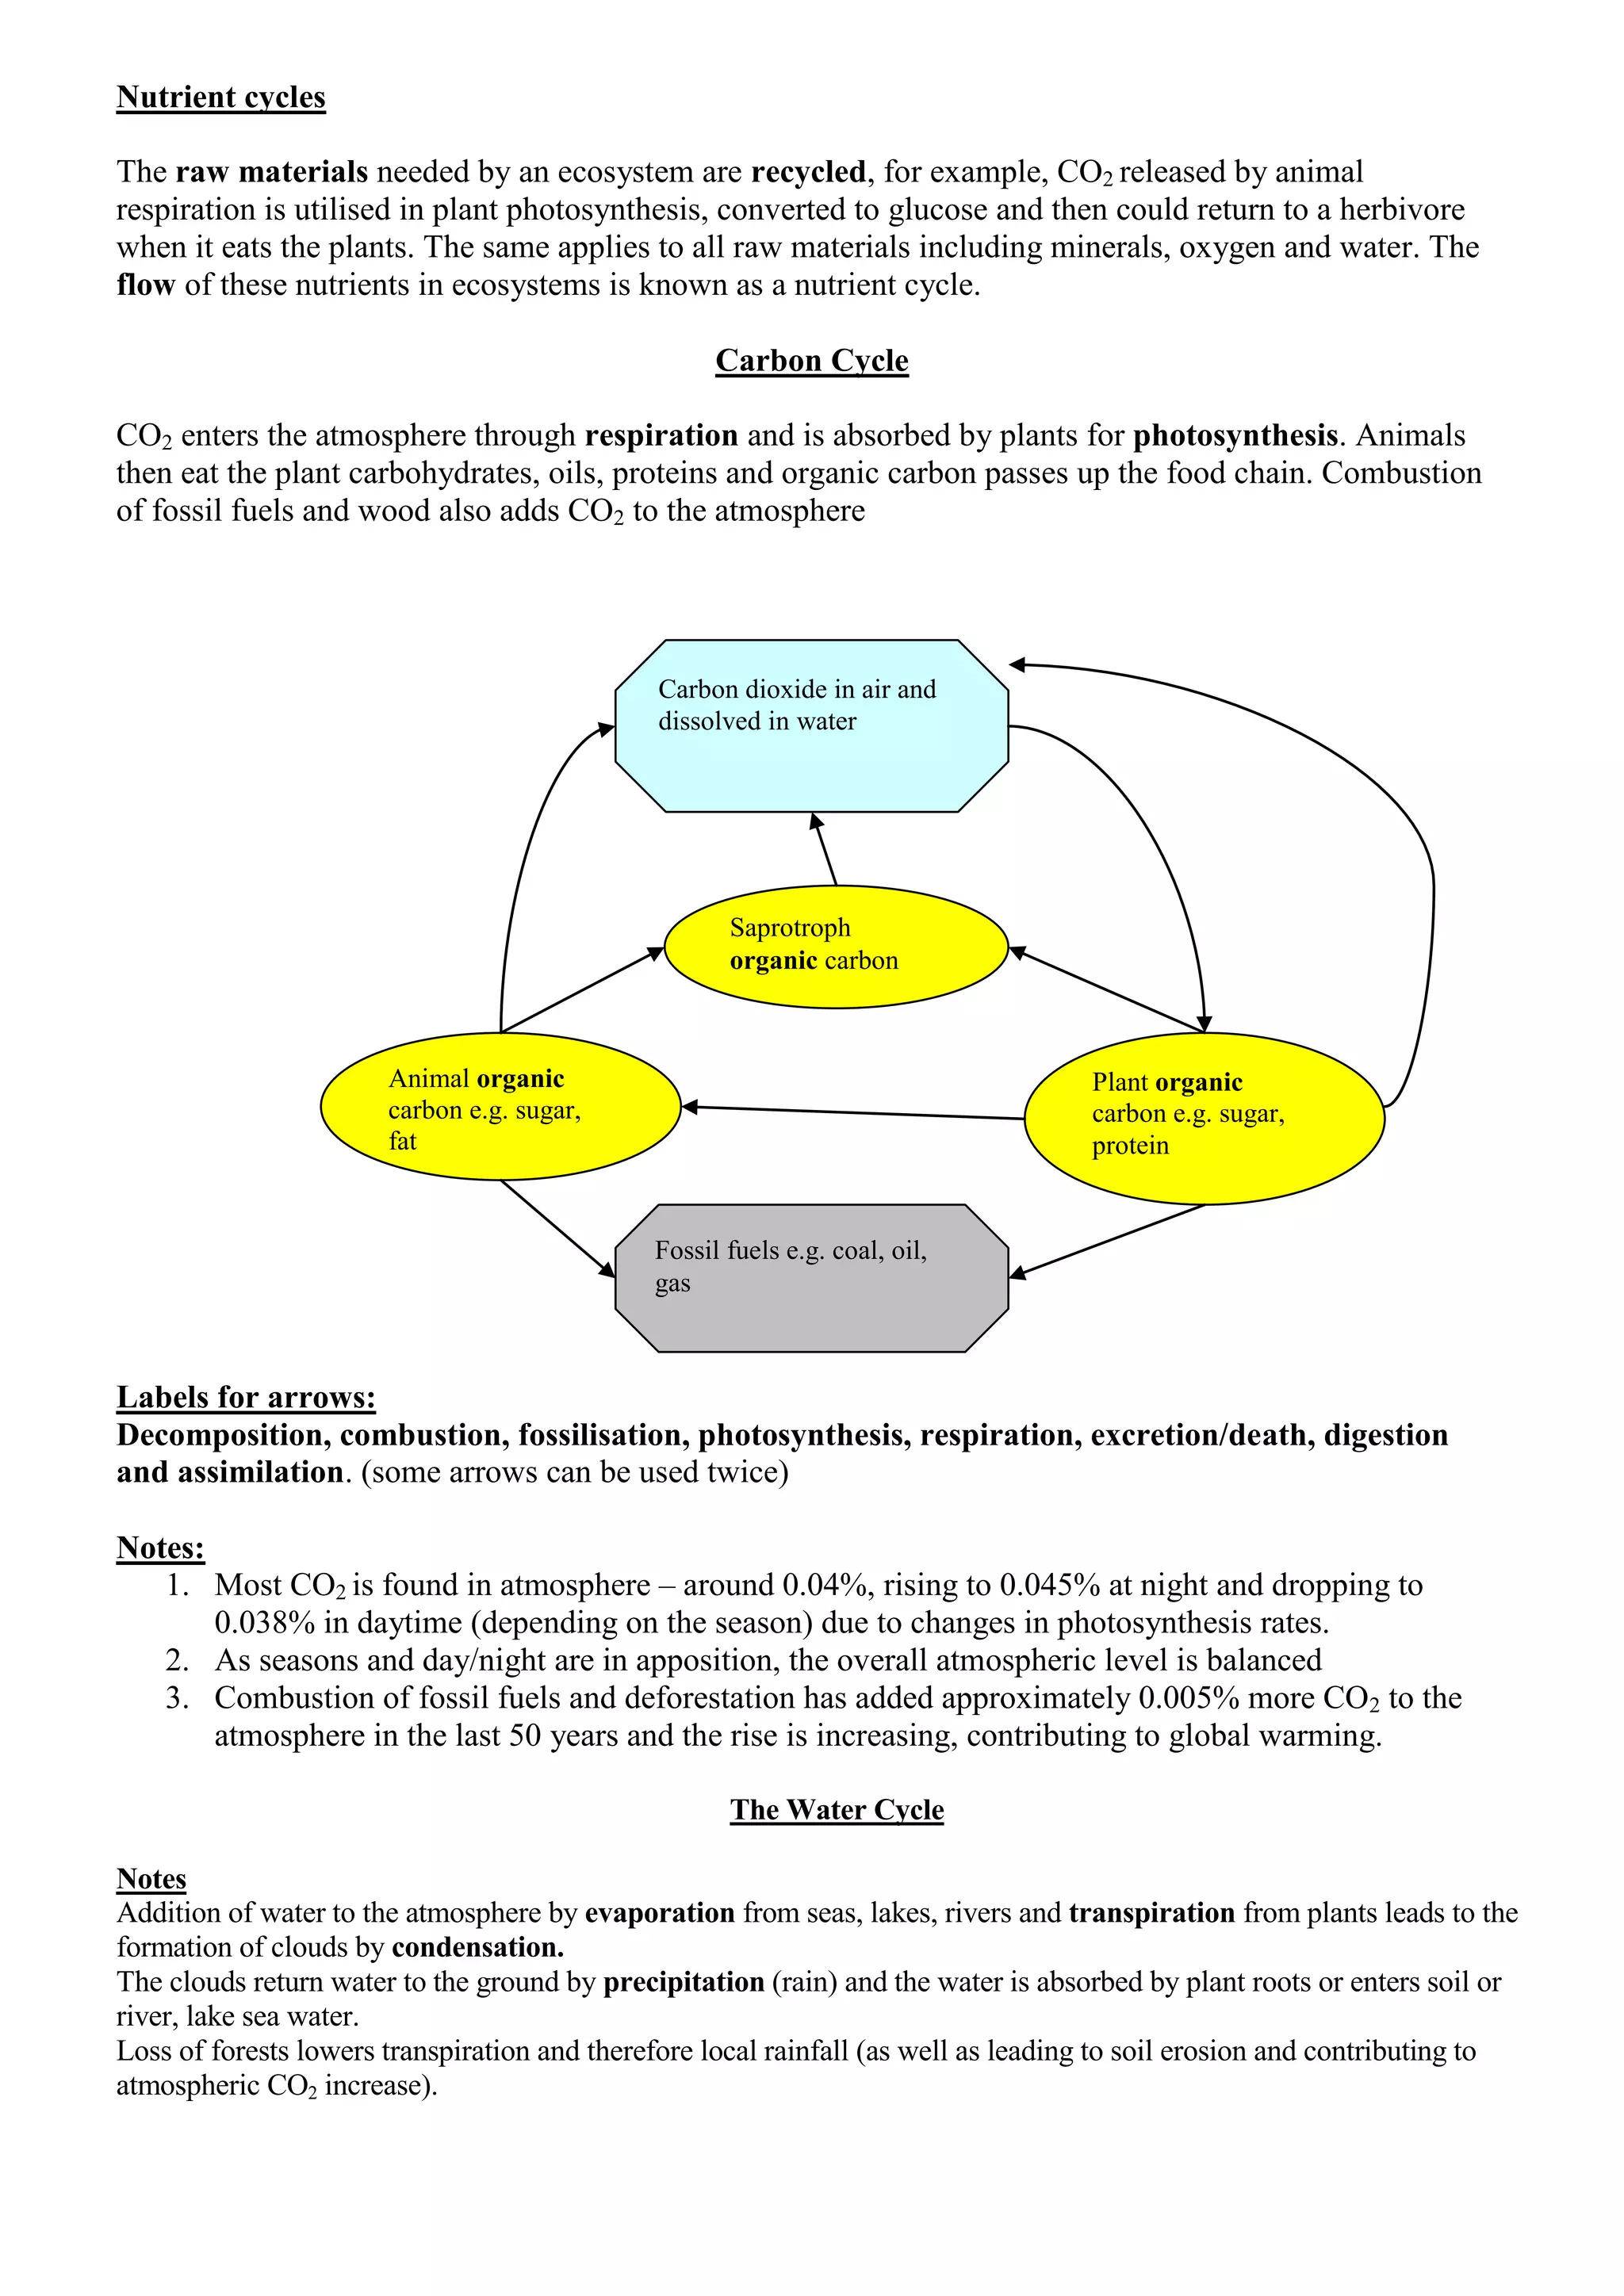
SlideShare a Scribd company logo
Ecology definitions
1. Ecosystem – a group of populations of organisms interacting together in a specific environment
e.g. a lake.
2. Producer - an organism that makes its own organic nutrients from inorganic raw materials using
an energy source, usually the sun.
3. Consumer – an organism that gains energy and organic nutrients from eating other organisms.
4. Herbivore – an organism which gets its energy from eating producers (plants)
5. Carnivore – an organism which gains its energy by eating other animals
6. Decomposer – an organism that gains its energy from dead or waste organic matter.
7. Food chain - a chart showing the flow of energy from one organism to the next, beginning with a
producer and ending with a carnivore
Rose → Aphid Blackbird Sparrow Hawk
8. Food web - a network of interconnecting food chains showing the energy flow through an
ecosystem.
Fox grass snake blackbird
toad
rabbit squirrel grasshopper
vegetation
9. Trophic level – the position of an organism in a food chain, web or pyramid.
vegetation 1st trophic level (producer)
1st order consumer snail 2nd trophic level (herbivores only)
2nd order consumer thrush 3rd trophic level (omnivores, carnivores)
3rd order consumer cat 4th tropic level (usually carnivores)
supercarnivore
10. Population – a group of organisms of one species living in the same area at the same time.
Energy flow through an ecosystem. - Energy cannot be recycled. It enters through the producers as
light energy and they transform it to chemical energy which passes up the food chain. An ecosystem
therefore needs a constant supply of energy.
Only about 10% of the energy available at one trophic level is available to the next. This is because
o Animals and plants use energy for respiration.
o Not all the food that is eaten is digested.
o Some substances are excreted
S This means that food chains rarely exceed 5 links and populations of supercarnivores are small.
S The human population is more easily sustained by eating at the 2nd
trophic level as there is more
energy available. At this level than the amount available from eating meat (about 18kg of grass is
needed to produce 1 kg of meat)
Ecological Pyramids
Pyramid of numbers. A pyramid, drawn to scale, shows the population present in a community or food chain
at each trophic level. Can be inverted if the producers are large e.g. forest (trees)
Pyramid of biomass A pyramid, drawn to scale, shows the mass of the population (population x average mass
of individual) present in a community or food chain at each trophic level. Can be inverted if the producers
reproduce sufficiently quickly.
Aphids
Trees
Blackbirds
Aphids
Trees
Blackbirds
15,476 Aphids x 0.4g
= 6190g = 6.19Kg
biomass
http://www.google.com/imgres?imgurl=http://web1.stmaryssen-h.schools.nsw.edu.au
1. Use the total numbers at each trophic level and draw a pyramid of numbers on graph paper. Use a
scale of 1cm representing 100 organisms in the population.
2. Given the following masses of the organisms present, complete the table and draw to scale a
pyramid of biomass for the same organisms using a suitable scale.
Organism Average mass of
one organism g.
Population Biomass Size to scale on
pyramid
Plants 11.2
Worm 4.5
Snail 6.6
Thrush 125.0
Blackbird 105.5
Sparrow Hawk 248.0
3. What happens to the size of a step in the pyramid at each trophic level?
4. If the pyramids were drawn for a forest ecosystem would they appear different?
Population in
ecosystem
2 sparrow hawks
11 thrushes and 9
blackbirds
620 snails and 560
worms
6450 plants
Nutrient cycles
The raw materials needed by an ecosystem are recycled, for example, CO2 released by animal
respiration is utilised in plant photosynthesis, converted to glucose and then could return to a herbivore
when it eats the plants. The same applies to all raw materials including minerals, oxygen and water. The
flow of these nutrients in ecosystems is known as a nutrient cycle.
Carbon Cycle
CO2 enters the atmosphere through respiration and is absorbed by plants for photosynthesis. Animals
then eat the plant carbohydrates, oils, proteins and organic carbon passes up the food chain. Combustion
of fossil fuels and wood also adds CO2 to the atmosphere
Labels for arrows:
Decomposition, combustion, fossilisation, photosynthesis, respiration, excretion/death, digestion
and assimilation. (some arrows can be used twice)
Notes:
1. Most CO2 is found in atmosphere – around 0.04%, rising to 0.045% at night and dropping to
0.038% in daytime (depending on the season) due to changes in photosynthesis rates.
2. As seasons and day/night are in apposition, the overall atmospheric level is balanced
3. Combustion of fossil fuels and deforestation has added approximately 0.005% more CO2 to the
atmosphere in the last 50 years and the rise is increasing, contributing to global warming.
The Water Cycle
Notes
Addition of water to the atmosphere by evaporation from seas, lakes, rivers and transpiration from plants leads to the
formation of clouds by condensation.
The clouds return water to the ground by precipitation (rain) and the water is absorbed by plant roots or enters soil or
river, lake sea water.
Loss of forests lowers transpiration and therefore local rainfall (as well as leading to soil erosion and contributing to
atmospheric CO2 increase).
Carbon dioxide in air and
dissolved in water
Plant organic
carbon e.g. sugar,
protein
Animal organic
carbon e.g. sugar,
fat
Saprotroph
organic carbon
Fossil fuels e.g. coal, oil,
gas
S The Nitrogen Cycle
Plants absorb soil nitrate and convert it to protein. Their protein can either be ingested by herbivores
and pass up the food chain or, on death, leaf fall, broken down by saprotrophs to decay products in the
soil. Animal excreta, egesta and dead remains are also broken down by saprotrophs to decay products in
the soil. Nitrifying bacteria then convert these decay products back to nitrate to be re-used by the plants.
Denitrifying bacteria use up nitrate to gain oxygen, nitrifying bacteria make nitrate from atmospheric
nitrogen
Additional notes
1. Lightning can cause N2 (air) to react with O2 + H2O to form Ammonia, which dissolves in clouds and comes to soil in rain.
2. Nitrification. Animals excrete urea, ammonia (NH4
+
) is formed by saprotrophs and both are useless to plants. They are
oxidised by nitrifying bacteria to NO3
-
(Nitrate) which can be absorbed by plant roots and converted to protein. The
plants are then eaten by animals which manufacture animal protein.
3. Farmers add nitrate and ammonia fertilisers to soil (the amount of NO3
-
in soil determines how much protein plants can
make and therefore how fast they can grow).
4. Some nitrogen-fixing bacteria can fix atmospheric nitrogen, converting it directly into nitrate. Some live freely in soil,
some live in root nodules of plants of the Pea family (hence growing peas and beans and clover in a crop rotation which
is a natural way to increase soil nitrogen). The pea plant symbioses with the bacteria -- the plant supplies sugars and the
bacteria supplies nitrates, both benefit by the association.
5. Leaching -- both ammonia and nitrates are highly soluble and so can be washed out of the soil by rain, the use of nitrate
fertilisers increases the population of denitrifying bacteria
6. Denitrification - denitrifying bacteria change NO3
-
to N2 which leaves soil for the atmosphere.
Place all the words in bold on the correct arrows in the cycle above.
N as products of
decay in the soil
(urea, ammonia)
N2 in
atmosphere
N as protein in
animals
N as protein in
plants
N as NO3
-
(nitrate)
in soil
Fertilisers
Population Size
The main factors affecting the size of a population are
Food supply – Resources are plentiful in a small population with little competition and/or at a favourable
time of year. They may be scarce in winter.
Predation – as the supply of prey increases, the predator population will increase and probably reduce the
prey population. The predator prevents the prey population from overexploiting the ecosystem.
Disease – can be fatal in both animals and plants. It is more common in crowded conditions (as transfer
from one organism to another is easier) and more fatal in populations weakened by lack of food
When there is a natural balance within a community in terms of the physical and living components, a stable
population is maintained.
For a theoretical population, the Sigmoid growth curve normally applies when there are limited resources and
therefore competition for raw materials. It has three phases as the population reaches maturity:
S The phases of the growth curve are
S Explain the three phases of the curve for the following populations:
Population Explanation of Phase
Lag Exponential Stationary
Bacteria introduced into
sterile milk
Rabbit population over a
Spring and Summer
Replanted forest x
Lag
phase
Sigmoid Growth Curve of a Population
Exponential
phase
Stationary phase
Population
size
Time
Lag – establishment, finding resources, preparation for reproduction before the population grows.
Exponential – resources are abundant, disease and predation low allowing a very fast increase in
population.
Stationary– resources match population and the checks provided by predation, disease,
emigration, immigration give a stable, mature population where birth and death rates are equal.
(Death – if the population overexploits the resources.)
Human population growth
is in the exponential phase and therefore the population requires ever-increasing resources. This leads to:
1. Habitat destruction for building and farming
2. Increased carbon dioxide emissions and
3. Global warming
http://www.prb.org/ is an interesting site on world human population.
http://ecology110armine2011sp.files.wordpress.com/2011/05/population_growth.jpg

More Related Content

What's hot

U05 Biosphere Ecosphere
U05 Biosphere EcosphereU05 Biosphere Ecosphere
U05 Biosphere Ecosphere
Alkor
 

What's hot (20)

General Entomology (Biol.2032) power point
General Entomology (Biol.2032) power pointGeneral Entomology (Biol.2032) power point
General Entomology (Biol.2032) power point
 
Five kingdom classification
Five kingdom classificationFive kingdom classification
Five kingdom classification
 
Microorganisms (3) (2)
Microorganisms (3) (2)Microorganisms (3) (2)
Microorganisms (3) (2)
 
What is biology and Why study biology?
What is biology and Why study biology?What is biology and Why study biology?
What is biology and Why study biology?
 
U05 Biosphere Ecosphere
U05 Biosphere EcosphereU05 Biosphere Ecosphere
U05 Biosphere Ecosphere
 
Important questions of Zoology, wildlife, zoogeography , Biochem, cell biolog...
Important questions of Zoology, wildlife, zoogeography , Biochem, cell biolog...Important questions of Zoology, wildlife, zoogeography , Biochem, cell biolog...
Important questions of Zoology, wildlife, zoogeography , Biochem, cell biolog...
 
MICROBIOMES AND HUMAN HEALTH.pptx
MICROBIOMES AND HUMAN HEALTH.pptxMICROBIOMES AND HUMAN HEALTH.pptx
MICROBIOMES AND HUMAN HEALTH.pptx
 
Kingdom Animalia
Kingdom AnimaliaKingdom Animalia
Kingdom Animalia
 
Biological Classification
Biological ClassificationBiological Classification
Biological Classification
 
Five kingdom Classification
Five kingdom ClassificationFive kingdom Classification
Five kingdom Classification
 
Producers Consumers and Decomposers
Producers Consumers and DecomposersProducers Consumers and Decomposers
Producers Consumers and Decomposers
 
What sparked the cambrian explosion 2016
What sparked the cambrian explosion   2016What sparked the cambrian explosion   2016
What sparked the cambrian explosion 2016
 
Air breathing and respiratory adaptations in diver animals
Air breathing and respiratory adaptations in diver animalsAir breathing and respiratory adaptations in diver animals
Air breathing and respiratory adaptations in diver animals
 
B.Sc. Biotech Biochem II BM Unit-1.1 Introduction to Microbiology
B.Sc. Biotech Biochem II BM Unit-1.1 Introduction to MicrobiologyB.Sc. Biotech Biochem II BM Unit-1.1 Introduction to Microbiology
B.Sc. Biotech Biochem II BM Unit-1.1 Introduction to Microbiology
 
Normal flora (rby)
Normal flora  (rby)Normal flora  (rby)
Normal flora (rby)
 
Energy flow in ecosystems
Energy flow in ecosystems Energy flow in ecosystems
Energy flow in ecosystems
 
Grade 9-U3-L9-Invasive species
Grade 9-U3-L9-Invasive speciesGrade 9-U3-L9-Invasive species
Grade 9-U3-L9-Invasive species
 
Foodchain foodweb and ecological cycle
Foodchain foodweb and ecological cycleFoodchain foodweb and ecological cycle
Foodchain foodweb and ecological cycle
 
Predator Prey Relationships, Lesson PowerPoint
Predator Prey Relationships, Lesson PowerPointPredator Prey Relationships, Lesson PowerPoint
Predator Prey Relationships, Lesson PowerPoint
 
Ecosystems: Food chain
Ecosystems: Food chainEcosystems: Food chain
Ecosystems: Food chain
 

Similar to Ecology Revision Notes

Chapter 21 Ecology Lesson 2 - Pyramid of numbers biomass_carbon cycle
Chapter 21 Ecology Lesson 2 - Pyramid of numbers biomass_carbon cycleChapter 21 Ecology Lesson 2 - Pyramid of numbers biomass_carbon cycle
Chapter 21 Ecology Lesson 2 - Pyramid of numbers biomass_carbon cycle
j3di79
 
ecology ppt ch 18.ppt Uzbekistan evolyutsiya
ecology ppt ch 18.ppt Uzbekistan evolyutsiyaecology ppt ch 18.ppt Uzbekistan evolyutsiya
ecology ppt ch 18.ppt Uzbekistan evolyutsiya
dostoneliboyev03
 
The Biosphere Extended
The Biosphere ExtendedThe Biosphere Extended
The Biosphere Extended
jayerichards
 
BiologyExchange.co.uk Shared Resource
BiologyExchange.co.uk Shared ResourceBiologyExchange.co.uk Shared Resource
BiologyExchange.co.uk Shared Resource
biologyexchange
 
HEE Chapter 5
HEE Chapter 5HEE Chapter 5
HEE Chapter 5
jholl
 
Terrestrial ecology notes1
Terrestrial ecology notes1Terrestrial ecology notes1
Terrestrial ecology notes1
guest78ee45d8
 

Similar to Ecology Revision Notes (20)

Biology Form 4 Chapter 8 :Dynamic Ecosystem Part 1
Biology Form 4 Chapter 8 :Dynamic Ecosystem  Part 1Biology Form 4 Chapter 8 :Dynamic Ecosystem  Part 1
Biology Form 4 Chapter 8 :Dynamic Ecosystem Part 1
 
Chapter 21 Ecology Lesson 2 - Pyramid of numbers biomass_carbon cycle
Chapter 21 Ecology Lesson 2 - Pyramid of numbers biomass_carbon cycleChapter 21 Ecology Lesson 2 - Pyramid of numbers biomass_carbon cycle
Chapter 21 Ecology Lesson 2 - Pyramid of numbers biomass_carbon cycle
 
Ecology
EcologyEcology
Ecology
 
ecology ppt ch 18.ppt Uzbekistan evolyutsiya
ecology ppt ch 18.ppt Uzbekistan evolyutsiyaecology ppt ch 18.ppt Uzbekistan evolyutsiya
ecology ppt ch 18.ppt Uzbekistan evolyutsiya
 
Flow of energy in an ecosystem
Flow of energy in an ecosystemFlow of energy in an ecosystem
Flow of energy in an ecosystem
 
The Biosphere
The BiosphereThe Biosphere
The Biosphere
 
Chapter 4 (done)
Chapter 4 (done)Chapter 4 (done)
Chapter 4 (done)
 
Ecosystems and biomes (ict)(slideshare)2
Ecosystems and biomes (ict)(slideshare)2Ecosystems and biomes (ict)(slideshare)2
Ecosystems and biomes (ict)(slideshare)2
 
How Ecosystems Work APBio
How Ecosystems Work APBioHow Ecosystems Work APBio
How Ecosystems Work APBio
 
Terrestrial Ecology Wesselman.ppt
Terrestrial Ecology Wesselman.pptTerrestrial Ecology Wesselman.ppt
Terrestrial Ecology Wesselman.ppt
 
The Biosphere Extended
The Biosphere ExtendedThe Biosphere Extended
The Biosphere Extended
 
BiologyExchange.co.uk Shared Resource
BiologyExchange.co.uk Shared ResourceBiologyExchange.co.uk Shared Resource
BiologyExchange.co.uk Shared Resource
 
HEE Chapter 5
HEE Chapter 5HEE Chapter 5
HEE Chapter 5
 
Energy flow and nutrient cycles
Energy flow and nutrient cyclesEnergy flow and nutrient cycles
Energy flow and nutrient cycles
 
Chapter ten
Chapter tenChapter ten
Chapter ten
 
Biology ecology
Biology ecology Biology ecology
Biology ecology
 
Terrestrial Ecology Notes1
Terrestrial Ecology Notes1Terrestrial Ecology Notes1
Terrestrial Ecology Notes1
 
Biology Form 4 Chapter 8 :Dynamic Ecosystem Part 2
Biology Form 4 Chapter 8 :Dynamic Ecosystem  Part 2Biology Form 4 Chapter 8 :Dynamic Ecosystem  Part 2
Biology Form 4 Chapter 8 :Dynamic Ecosystem Part 2
 
2 dynamicsofecosystem-121129013419-phpapp01
2 dynamicsofecosystem-121129013419-phpapp012 dynamicsofecosystem-121129013419-phpapp01
2 dynamicsofecosystem-121129013419-phpapp01
 
Terrestrial ecology notes1
Terrestrial ecology notes1Terrestrial ecology notes1
Terrestrial ecology notes1
 

More from Mrs Parker

Fruit battery inquiry
Fruit battery inquiryFruit battery inquiry
Fruit battery inquiry
Mrs Parker
 
Science fair team work plan
Science fair team work plan Science fair team work plan
Science fair team work plan
Mrs Parker
 
Science fair team contract
Science fair team contract Science fair team contract
Science fair team contract
Mrs Parker
 
Science fair 2014 guidance
Science fair 2014 guidanceScience fair 2014 guidance
Science fair 2014 guidance
Mrs Parker
 
Poster presentation
Poster presentationPoster presentation
Poster presentation
Mrs Parker
 
Term 3 Pressure and Moments Learning Objectives and Outcomes
Term 3 Pressure and Moments Learning Objectives and OutcomesTerm 3 Pressure and Moments Learning Objectives and Outcomes
Term 3 Pressure and Moments Learning Objectives and Outcomes
Mrs Parker
 
Term 3 Year 7 Learning Objectives and Outcomes
Term 3 Year 7 Learning Objectives and OutcomesTerm 3 Year 7 Learning Objectives and Outcomes
Term 3 Year 7 Learning Objectives and Outcomes
Mrs Parker
 

More from Mrs Parker (20)

Exercise and Breathing
Exercise and BreathingExercise and Breathing
Exercise and Breathing
 
Smoking and CHD
Smoking and CHDSmoking and CHD
Smoking and CHD
 
Gas Exchange and Emphysema
Gas Exchange and EmphysemaGas Exchange and Emphysema
Gas Exchange and Emphysema
 
Science Expo DBIS 2015
Science Expo DBIS 2015Science Expo DBIS 2015
Science Expo DBIS 2015
 
1 food chains and webs edexcel new mp
1 food chains and webs edexcel new mp1 food chains and webs edexcel new mp
1 food chains and webs edexcel new mp
 
Sampling and Ecosystems
Sampling and EcosystemsSampling and Ecosystems
Sampling and Ecosystems
 
Fruit battery inquiry
Fruit battery inquiryFruit battery inquiry
Fruit battery inquiry
 
1 planning rocket lander mp
1 planning rocket lander mp1 planning rocket lander mp
1 planning rocket lander mp
 
Reproduction practice questions - plant focus
Reproduction practice questions - plant focusReproduction practice questions - plant focus
Reproduction practice questions - plant focus
 
Plant reproduction worksheet
Plant reproduction worksheetPlant reproduction worksheet
Plant reproduction worksheet
 
Plant reproduction
Plant reproductionPlant reproduction
Plant reproduction
 
Diffusion, osmosis, and active transport practice questions
Diffusion, osmosis, and active transport practice questionsDiffusion, osmosis, and active transport practice questions
Diffusion, osmosis, and active transport practice questions
 
Plant nutrition
Plant nutritionPlant nutrition
Plant nutrition
 
IGCSE Science Double Award Specification
IGCSE Science Double Award SpecificationIGCSE Science Double Award Specification
IGCSE Science Double Award Specification
 
Science fair team work plan
Science fair team work plan Science fair team work plan
Science fair team work plan
 
Science fair team contract
Science fair team contract Science fair team contract
Science fair team contract
 
Science fair 2014 guidance
Science fair 2014 guidanceScience fair 2014 guidance
Science fair 2014 guidance
 
Poster presentation
Poster presentationPoster presentation
Poster presentation
 
Term 3 Pressure and Moments Learning Objectives and Outcomes
Term 3 Pressure and Moments Learning Objectives and OutcomesTerm 3 Pressure and Moments Learning Objectives and Outcomes
Term 3 Pressure and Moments Learning Objectives and Outcomes
 
Term 3 Year 7 Learning Objectives and Outcomes
Term 3 Year 7 Learning Objectives and OutcomesTerm 3 Year 7 Learning Objectives and Outcomes
Term 3 Year 7 Learning Objectives and Outcomes
 

Recently uploaded

Adversarial Attention Modeling for Multi-dimensional Emotion Regression.pdf
Adversarial Attention Modeling for Multi-dimensional Emotion Regression.pdfAdversarial Attention Modeling for Multi-dimensional Emotion Regression.pdf
Adversarial Attention Modeling for Multi-dimensional Emotion Regression.pdf
Po-Chuan Chen
 
Industrial Training Report- AKTU Industrial Training Report
Industrial Training Report- AKTU Industrial Training ReportIndustrial Training Report- AKTU Industrial Training Report
Industrial Training Report- AKTU Industrial Training Report
Avinash Rai
 

Recently uploaded (20)

UNIT – IV_PCI Complaints: Complaints and evaluation of complaints, Handling o...
UNIT – IV_PCI Complaints: Complaints and evaluation of complaints, Handling o...UNIT – IV_PCI Complaints: Complaints and evaluation of complaints, Handling o...
UNIT – IV_PCI Complaints: Complaints and evaluation of complaints, Handling o...
 
Adversarial Attention Modeling for Multi-dimensional Emotion Regression.pdf
Adversarial Attention Modeling for Multi-dimensional Emotion Regression.pdfAdversarial Attention Modeling for Multi-dimensional Emotion Regression.pdf
Adversarial Attention Modeling for Multi-dimensional Emotion Regression.pdf
 
Forest and Wildlife Resources Class 10 Free Study Material PDF
Forest and Wildlife Resources Class 10 Free Study Material PDFForest and Wildlife Resources Class 10 Free Study Material PDF
Forest and Wildlife Resources Class 10 Free Study Material PDF
 
slides CapTechTalks Webinar May 2024 Alexander Perry.pptx
slides CapTechTalks Webinar May 2024 Alexander Perry.pptxslides CapTechTalks Webinar May 2024 Alexander Perry.pptx
slides CapTechTalks Webinar May 2024 Alexander Perry.pptx
 
B.ed spl. HI pdusu exam paper-2023-24.pdf
B.ed spl. HI pdusu exam paper-2023-24.pdfB.ed spl. HI pdusu exam paper-2023-24.pdf
B.ed spl. HI pdusu exam paper-2023-24.pdf
 
Basic Civil Engg Notes_Chapter-6_Environment Pollution & Engineering
Basic Civil Engg Notes_Chapter-6_Environment Pollution & EngineeringBasic Civil Engg Notes_Chapter-6_Environment Pollution & Engineering
Basic Civil Engg Notes_Chapter-6_Environment Pollution & Engineering
 
Benefits and Challenges of Using Open Educational Resources
Benefits and Challenges of Using Open Educational ResourcesBenefits and Challenges of Using Open Educational Resources
Benefits and Challenges of Using Open Educational Resources
 
Jose-Rizal-and-Philippine-Nationalism-National-Symbol-2.pptx
Jose-Rizal-and-Philippine-Nationalism-National-Symbol-2.pptxJose-Rizal-and-Philippine-Nationalism-National-Symbol-2.pptx
Jose-Rizal-and-Philippine-Nationalism-National-Symbol-2.pptx
 
Basic Civil Engineering Notes of Chapter-6, Topic- Ecosystem, Biodiversity G...
Basic Civil Engineering Notes of Chapter-6,  Topic- Ecosystem, Biodiversity G...Basic Civil Engineering Notes of Chapter-6,  Topic- Ecosystem, Biodiversity G...
Basic Civil Engineering Notes of Chapter-6, Topic- Ecosystem, Biodiversity G...
 
NCERT Solutions Power Sharing Class 10 Notes pdf
NCERT Solutions Power Sharing Class 10 Notes pdfNCERT Solutions Power Sharing Class 10 Notes pdf
NCERT Solutions Power Sharing Class 10 Notes pdf
 
Ethnobotany and Ethnopharmacology ......
Ethnobotany and Ethnopharmacology ......Ethnobotany and Ethnopharmacology ......
Ethnobotany and Ethnopharmacology ......
 
Operations Management - Book1.p - Dr. Abdulfatah A. Salem
Operations Management - Book1.p  - Dr. Abdulfatah A. SalemOperations Management - Book1.p  - Dr. Abdulfatah A. Salem
Operations Management - Book1.p - Dr. Abdulfatah A. Salem
 
Basic phrases for greeting and assisting costumers
Basic phrases for greeting and assisting costumersBasic phrases for greeting and assisting costumers
Basic phrases for greeting and assisting costumers
 
Fish and Chips - have they had their chips
Fish and Chips - have they had their chipsFish and Chips - have they had their chips
Fish and Chips - have they had their chips
 
Students, digital devices and success - Andreas Schleicher - 27 May 2024..pptx
Students, digital devices and success - Andreas Schleicher - 27 May 2024..pptxStudents, digital devices and success - Andreas Schleicher - 27 May 2024..pptx
Students, digital devices and success - Andreas Schleicher - 27 May 2024..pptx
 
Synthetic Fiber Construction in lab .pptx
Synthetic Fiber Construction in lab .pptxSynthetic Fiber Construction in lab .pptx
Synthetic Fiber Construction in lab .pptx
 
Industrial Training Report- AKTU Industrial Training Report
Industrial Training Report- AKTU Industrial Training ReportIndustrial Training Report- AKTU Industrial Training Report
Industrial Training Report- AKTU Industrial Training Report
 
Home assignment II on Spectroscopy 2024 Answers.pdf
Home assignment II on Spectroscopy 2024 Answers.pdfHome assignment II on Spectroscopy 2024 Answers.pdf
Home assignment II on Spectroscopy 2024 Answers.pdf
 
Phrasal Verbs.XXXXXXXXXXXXXXXXXXXXXXXXXX
Phrasal Verbs.XXXXXXXXXXXXXXXXXXXXXXXXXXPhrasal Verbs.XXXXXXXXXXXXXXXXXXXXXXXXXX
Phrasal Verbs.XXXXXXXXXXXXXXXXXXXXXXXXXX
 
Sha'Carri Richardson Presentation 202345
Sha'Carri Richardson Presentation 202345Sha'Carri Richardson Presentation 202345
Sha'Carri Richardson Presentation 202345
 

Ecology Revision Notes

  • 1. Ecology definitions 1. Ecosystem – a group of populations of organisms interacting together in a specific environment e.g. a lake. 2. Producer - an organism that makes its own organic nutrients from inorganic raw materials using an energy source, usually the sun. 3. Consumer – an organism that gains energy and organic nutrients from eating other organisms. 4. Herbivore – an organism which gets its energy from eating producers (plants) 5. Carnivore – an organism which gains its energy by eating other animals 6. Decomposer – an organism that gains its energy from dead or waste organic matter. 7. Food chain - a chart showing the flow of energy from one organism to the next, beginning with a producer and ending with a carnivore Rose → Aphid Blackbird Sparrow Hawk 8. Food web - a network of interconnecting food chains showing the energy flow through an ecosystem. Fox grass snake blackbird toad rabbit squirrel grasshopper vegetation 9. Trophic level – the position of an organism in a food chain, web or pyramid. vegetation 1st trophic level (producer) 1st order consumer snail 2nd trophic level (herbivores only) 2nd order consumer thrush 3rd trophic level (omnivores, carnivores) 3rd order consumer cat 4th tropic level (usually carnivores) supercarnivore 10. Population – a group of organisms of one species living in the same area at the same time.
  • 2. Energy flow through an ecosystem. - Energy cannot be recycled. It enters through the producers as light energy and they transform it to chemical energy which passes up the food chain. An ecosystem therefore needs a constant supply of energy. Only about 10% of the energy available at one trophic level is available to the next. This is because o Animals and plants use energy for respiration. o Not all the food that is eaten is digested. o Some substances are excreted S This means that food chains rarely exceed 5 links and populations of supercarnivores are small. S The human population is more easily sustained by eating at the 2nd trophic level as there is more energy available. At this level than the amount available from eating meat (about 18kg of grass is needed to produce 1 kg of meat) Ecological Pyramids Pyramid of numbers. A pyramid, drawn to scale, shows the population present in a community or food chain at each trophic level. Can be inverted if the producers are large e.g. forest (trees) Pyramid of biomass A pyramid, drawn to scale, shows the mass of the population (population x average mass of individual) present in a community or food chain at each trophic level. Can be inverted if the producers reproduce sufficiently quickly. Aphids Trees Blackbirds Aphids Trees Blackbirds 15,476 Aphids x 0.4g = 6190g = 6.19Kg biomass
  • 3. http://www.google.com/imgres?imgurl=http://web1.stmaryssen-h.schools.nsw.edu.au 1. Use the total numbers at each trophic level and draw a pyramid of numbers on graph paper. Use a scale of 1cm representing 100 organisms in the population. 2. Given the following masses of the organisms present, complete the table and draw to scale a pyramid of biomass for the same organisms using a suitable scale. Organism Average mass of one organism g. Population Biomass Size to scale on pyramid Plants 11.2 Worm 4.5 Snail 6.6 Thrush 125.0 Blackbird 105.5 Sparrow Hawk 248.0 3. What happens to the size of a step in the pyramid at each trophic level? 4. If the pyramids were drawn for a forest ecosystem would they appear different? Population in ecosystem 2 sparrow hawks 11 thrushes and 9 blackbirds 620 snails and 560 worms 6450 plants
  • 4. Nutrient cycles The raw materials needed by an ecosystem are recycled, for example, CO2 released by animal respiration is utilised in plant photosynthesis, converted to glucose and then could return to a herbivore when it eats the plants. The same applies to all raw materials including minerals, oxygen and water. The flow of these nutrients in ecosystems is known as a nutrient cycle. Carbon Cycle CO2 enters the atmosphere through respiration and is absorbed by plants for photosynthesis. Animals then eat the plant carbohydrates, oils, proteins and organic carbon passes up the food chain. Combustion of fossil fuels and wood also adds CO2 to the atmosphere Labels for arrows: Decomposition, combustion, fossilisation, photosynthesis, respiration, excretion/death, digestion and assimilation. (some arrows can be used twice) Notes: 1. Most CO2 is found in atmosphere – around 0.04%, rising to 0.045% at night and dropping to 0.038% in daytime (depending on the season) due to changes in photosynthesis rates. 2. As seasons and day/night are in apposition, the overall atmospheric level is balanced 3. Combustion of fossil fuels and deforestation has added approximately 0.005% more CO2 to the atmosphere in the last 50 years and the rise is increasing, contributing to global warming. The Water Cycle Notes Addition of water to the atmosphere by evaporation from seas, lakes, rivers and transpiration from plants leads to the formation of clouds by condensation. The clouds return water to the ground by precipitation (rain) and the water is absorbed by plant roots or enters soil or river, lake sea water. Loss of forests lowers transpiration and therefore local rainfall (as well as leading to soil erosion and contributing to atmospheric CO2 increase). Carbon dioxide in air and dissolved in water Plant organic carbon e.g. sugar, protein Animal organic carbon e.g. sugar, fat Saprotroph organic carbon Fossil fuels e.g. coal, oil, gas
  • 5. S The Nitrogen Cycle Plants absorb soil nitrate and convert it to protein. Their protein can either be ingested by herbivores and pass up the food chain or, on death, leaf fall, broken down by saprotrophs to decay products in the soil. Animal excreta, egesta and dead remains are also broken down by saprotrophs to decay products in the soil. Nitrifying bacteria then convert these decay products back to nitrate to be re-used by the plants. Denitrifying bacteria use up nitrate to gain oxygen, nitrifying bacteria make nitrate from atmospheric nitrogen Additional notes 1. Lightning can cause N2 (air) to react with O2 + H2O to form Ammonia, which dissolves in clouds and comes to soil in rain. 2. Nitrification. Animals excrete urea, ammonia (NH4 + ) is formed by saprotrophs and both are useless to plants. They are oxidised by nitrifying bacteria to NO3 - (Nitrate) which can be absorbed by plant roots and converted to protein. The plants are then eaten by animals which manufacture animal protein. 3. Farmers add nitrate and ammonia fertilisers to soil (the amount of NO3 - in soil determines how much protein plants can make and therefore how fast they can grow). 4. Some nitrogen-fixing bacteria can fix atmospheric nitrogen, converting it directly into nitrate. Some live freely in soil, some live in root nodules of plants of the Pea family (hence growing peas and beans and clover in a crop rotation which is a natural way to increase soil nitrogen). The pea plant symbioses with the bacteria -- the plant supplies sugars and the bacteria supplies nitrates, both benefit by the association. 5. Leaching -- both ammonia and nitrates are highly soluble and so can be washed out of the soil by rain, the use of nitrate fertilisers increases the population of denitrifying bacteria 6. Denitrification - denitrifying bacteria change NO3 - to N2 which leaves soil for the atmosphere. Place all the words in bold on the correct arrows in the cycle above. N as products of decay in the soil (urea, ammonia) N2 in atmosphere N as protein in animals N as protein in plants N as NO3 - (nitrate) in soil Fertilisers
  • 6. Population Size The main factors affecting the size of a population are Food supply – Resources are plentiful in a small population with little competition and/or at a favourable time of year. They may be scarce in winter. Predation – as the supply of prey increases, the predator population will increase and probably reduce the prey population. The predator prevents the prey population from overexploiting the ecosystem. Disease – can be fatal in both animals and plants. It is more common in crowded conditions (as transfer from one organism to another is easier) and more fatal in populations weakened by lack of food When there is a natural balance within a community in terms of the physical and living components, a stable population is maintained. For a theoretical population, the Sigmoid growth curve normally applies when there are limited resources and therefore competition for raw materials. It has three phases as the population reaches maturity: S The phases of the growth curve are S Explain the three phases of the curve for the following populations: Population Explanation of Phase Lag Exponential Stationary Bacteria introduced into sterile milk Rabbit population over a Spring and Summer Replanted forest x Lag phase Sigmoid Growth Curve of a Population Exponential phase Stationary phase Population size Time Lag – establishment, finding resources, preparation for reproduction before the population grows. Exponential – resources are abundant, disease and predation low allowing a very fast increase in population. Stationary– resources match population and the checks provided by predation, disease, emigration, immigration give a stable, mature population where birth and death rates are equal. (Death – if the population overexploits the resources.)
  • 7. Human population growth is in the exponential phase and therefore the population requires ever-increasing resources. This leads to: 1. Habitat destruction for building and farming 2. Increased carbon dioxide emissions and 3. Global warming http://www.prb.org/ is an interesting site on world human population. http://ecology110armine2011sp.files.wordpress.com/2011/05/population_growth.jpg