SlideShare a Scribd company logo
Orpilla, Sanchez, Suelo, Tabafunda, Valerio, & Villahermosa / Ecological Sampling I: The TransectLine Method
© College of Education, Don Mariano Marcos Memorial State University-North La Union Campus
1
Ecological Sampling II: Measuring Species Diversity
Lester E. Orpilla1 Mark Harold A. Sanchez2 Jhomarie I. Suelo3
Judy Ann L. Tabafunda4 Jonalyn M.Valerio5
and Orpha Grace A. Villahermosa6
Abstract— The study aimed to measure stability to determine if an environment is degrading, compare tw o or more environment and eliminate
the need for extensive list. The study w as conducted at Don Mariano Marcos Memorial State University-North La Union Campus, Sapilang,
Bacnotan, La Union particularly along the river. A 20 meter transect line w as laid on the ground of the sampling station follow ing the flow of the
river. A sample of all the species touching the ground w ere collected, recorded, and photographed along the w hole length of the line. Shannon-
Weiner Index and Simpson’s Index w ere used to compute the species diversity of the samples. It w as found out that that the samples recorded
have high species diversity.
Index Terms— biodiversity, diversity, diversity indices, Shannon–Wiener Index, Simpson’s Index, species richness, speciesevenness, speciesdiversity.
——————————  ——————————
1 INTRODUCTION
Biodiversityis a measure that combines richness and
evenness across species. It is one of the primary interests of
ecologists, but quantifying the species diversity of ecological
communities is complicated. Itis often measured becausehigh
biodiversity is perceived a synonymous with ecosystem
health. In general diverse communities are believed to have
increased stability, increased productivity, and resistance to
invasion and other disturbances.
In addition toissues ofstatisticalsampling, the rather
arbitrary nature of delineating an ecological community, and
the difficulty of positively identifying all of the species
present,species diversity itself has two separate components:
1.) the number of species present (species richness), and 2.)
their relative abundances (termed dominance or evenness).
The two main factors taken into account when measuring
diversity because it provide important information about
species rarity and commonness in a population.
Diversity indices provide information about the
composition of a community. It provides important
information about species rarity and commonness in a
population.
Determining which community has greater species
diversity is easy when either species richness or evenness is
held constant while the other parameter varies, but often
communities will vary in both richness and evenness.
Scientists havedeveloped a varietyof mathematical equations
(or indices) that incorporate both species richness and
evenness into a single measure of species diversity (e.g., the
Shannon-Wiener Index and Simpson’s Index). Different
diversity indices assign different weightings to species
richness and evenness, so the so most useful index to choose
depends on the circumstances.
Here, we will explore two measures of biodiversity:
The Shannon index (Hʼ, also termed the Shannon-Wiener
index) and the Simpson index (  ).
2 METHODOLOGY
2.1 Description of Study Site
The study was conducted on June 24, 2014 at Don
MarianoMarcosMemorial State University-North La Union
Campus,Sapilang,Bacnotan,La Union as shown in Figure 1.
Figure 1. Study map ofthe Sapilang Creek atDMMMSU-NLUC, Sapilang,
Bacnotan, La Union showing the location of the sampling area.
The sampling area is specifically located in upper
portion of the tributary creek, western part of the bridge
followingtheflow ofwater. Theyellow dot indicatestheplace
where the transect line is conducted.
2.2 The Transect Line Method
A 20 meter rope was laid along the upper portion of
the creek, going down. Sample of all species touching the
transectlinewerecollected and placed in an improvised paper
Orpilla, Sanchez, Suelo, Tabafunda, Valerio, & Villahermosa / Ecological Sampling I: The TransectLine Method
© College of Education, Don Mariano Marcos Memorial State University-North La Union Campus
2
 
 1NN
1nn



 ii

bag specimen and werelabeled species 1, species 2, species 3,
and soon, recorded theirabundance,photographed andwere
identified their scientific names.
2.1 The Shannon-Wiener Index
Species evenness, richness, and diversity indices as
Shannon-Weiner (Shannon and Weaver, 1949) and Simpson
Index (Simpson,1949)wereused to evaluate the bird species
diversity.Shannon-WeinerIndex assumes that individualsare
randomlysampled froman independentlargepopulation and
all the species are represented in the sample. Shannon
diversityis very widely used index for comparing diversity
betweenvarious habitats(Clarkeand Warwick, 2001). It was
calculated in ordertoknow the species diversity in different
habitat (Hutchison, 1970) based on the abundance of the
species by the following formula:
H' = -∑ 𝒑𝒊 (𝒍𝒏 𝒑𝒊)𝒔
𝒊=𝟏
Where,H ́ = Diversity Index ; Pi = is the proportion of
each species in the sample ; lnPi = natural logarithm of this
proportion.Thepresenceof one individual of a species is not
necessarily indicative of the species being present in a large
number.ThevalueofShannon Weiner DiversityIndex usually
falls between 1.5 and 3.5,only rarelyit surpasses 4.5. A value
near 4.6 would indicate that the numbers of individuals are
evenly distributed between all the species.
2.2 The Simpson’s Index
It measures the probability that two individuals
randomly selected from a sample will belong to the same
species.Simpsongavetheprobabilityof any two individuals
drawn from noticeably large community belonging to
different species.It has been measured by the given formula
where ni = thetotal numberof organisms ofeach individual
species
N = the total number of organisms of all species
 = is a measure of dominance and 1-  measures
species diversity
3. RESULTS AND DISCUSSIONS
Typical valuesofShannon-WeinerIndex aregenerally
between1.5 and 3.5 in mostecological studies,and theindex is
rarelygreaterthan 4.TheShannonindex increases as both the
richnessand theevennessofthecommunityincrease.The fact
that theindexincorporates both components of biodiversity
can be seen as both strength and a weakness. It is strength
becauseit provides a simple, synthetic summary, but it is a
weakness because it makes it difficult to compare
communities that differ greatly in richness.
Thecomputed Shannon-Weiner Index of the species
in the transect line method is 2.442629271. Since the index
value is high, this means that species diversity is high which
indicates less competitionbetween species. The Table 1 below
shows thecomputation oftheShannon-Weiner Index. Species
number 3 is the most abundant species.
Table 1.AbundanceofIdentified SamplingSpecies Present in
the Study Site
Species Scientific Name n
1 Arctostaphylos manzanita 3
2 Leucaena lecocephala 10
3 Vernonia cinerea 78
4 Lantana camara 43
5 Samanea saman 1
6 Mimosa pudica 8
7 Phyllanthus niruri 3
8 10
9 Centrosema sp. 8
10 10
11 Cymbopogonwinterianus 2
12 Clitoria ternatea 59
13 8
14 Cyperus esculentus 6
15 Brachiaria platyphylla 40
16 Digitaria sp. 13
17 Dactylis glomerata 17
18 Agrostis sp. 29
19 9
TotalNumbers of Individuals 357
Orpilla, Sanchez, Suelo, Tabafunda, Valerio, & Villahermosa / Ecological Sampling I: The TransectLine Method
© College of Education, Don Mariano Marcos Memorial State University-North La Union Campus
3
Table 1. Shannon-Weiner Index
Table 2. Simpson’s Index
Species ni ni/N ln(ni/n) − ∑(ni/Nxln(ni/n)
1 3 0.0084 -4.77912 -0.040160702
2 10 0.02801 -3.57515 -0.100144277
3 78 0.21849 -1.52103 -0.332325217
4 43 0.12045 -2.11654 -0.254932867
5 1 0.0028 -5.87774 -0.016464246
6 8 0.02241 -3.79829 -0.085115837
7 3 0.0084 -4.77912 -0.040160702
8 10 0.02801 -3.57515 -0.100144277
9 8 0.02241 -3.79829 -0.085115837
10 10 0.02801 -3.57515 -0.100144277
11 2 0.0056 -5.18459 -0.029045314
12 59 0.16527 -1.8002 -0.29751177
13 8 0.02241 -3.79829 -0.085115837
14 6 0.01681 -4.08598 -0.068671871
15 40 0.11204 -2.18886 -0.245250009
16 13 0.03641 -3.31279 -0.120633679
17 17 0.04762 -3.04452 -0.144977259
18 29 0.08123 -2.51044 -0.203929296
19 9 0.02521 -3.68051 -0.092785997
N=357 2.442629271
Species ni ni(ni-
1)
N(N-1) ni(ni-1)/
N(N-1)
1 3 6 127092 4.72099E-05
2 10 90 127092 0.000708148
3 78 6006 127092 0.047257105
4 43 1806 127092 0.014210178
5 1 0 127092 0
6 8 56 127092 0.000440626
7 3 6 127092 4.72099E-05
8 10 90 127092 0.000708148
9 2 2 127092 1.57366E-05
10 10 90 127092 0.000708148
11 2 2 127092 1.57366E-05
12 59 3422 127092 0.026925377
13 8 56 127092 0.000440626
14 6 30 127092 0.000236049
15 40 1560 127092 0.012274573
16 13 156 127092 0.001227457
17 17 272 127092 0.002140182
18 29 812 127092 0.006389072
19 9 72 127092 0.000566519
N=357 0.114358103
Orpilla, Sanchez, Suelo, Tabafunda, Valerio, & Villahermosa / Ecological Sampling I: The TransectLine Method
© College of Education, Don Mariano Marcos Memorial State University-North La Union Campus
4
In the Simpson’s Index, the value of  ranges
between 0 and 1. With this index, 0 represents infinite
diversityand 1,no diversity. That is, the bigger the value of 
, the lower thediversity.This is neitherintuitivenorlogical,so
to get over this problem,  is often subtracted from 1 to give:
Simpson's Index of Diversity 1 -  .
The value of this index also ranges between 0 and 1,
but now, the greater the value, the greater the sample
diversity. This makes more sense. In this case, the index
represents the probability that two individuals randomly
selected from a sample will belong to different species.
The computed Simpson’s Index value of the species
recorded is 0.114358103and theindex diversity is 0.89 which
means that there is greater species diversity.
4. CONCLUSIONS
Based on the salient findings of the study, the
following conclusions can be drawn:
1. Thespecies richnessis high but species are not evenly
distributed;
2. Thereis high species diversityin thesamplingstation,
thus the environment is very stable;
3. Shannon Weiner Index and Simpson’s Index have
different ways of computing the species diversity but
they have the same interpretation;
4. Shannon-WeinerIndex and Simpson’s cannot include
all species from the community in the sample;
5. Thevalueof a biodiversityindex mayvarywith small
changes in thespecies data that it is calculated from,
but also with habitat type and time period; and
6. Diversecommunities areoften a sign of fragmented or
somewhat degraded sites where much of species
richness is contributed by disturbance species.
ACKNOWLEDGMENT
The authors wish to thank the following people for
helpingin the completion of the study: (1) Mr. Jomar L. Aban,
subject professor in BS 116 (Biotecniques) (2) Dr. Rosita P.
Abubo, Dean of the College of Education, DMMMSU-NLUC.
(3) Dr. Criselda G.Sario,SEd Chairman, College of Education,
DMMMSU-NLUC, (4) Mrs. Violita F. Collado, adviser of the
authors (5)theirparents for thefinancial and moral assistance.
REFERENCES
[1] Magurran,A.M. (2004).MeasuringBiological
DiversityBlackwell ScienceLtd,Oxford.
[2] Buckland,S.T., Borchers D. L., Johnston A., Henrys P.
A. & Marques T.A. (2007)LineTransect Methods for
Plant Surveys. . Retrieved July 2, 2014, from:
http://onlinelibrary.wiley.com/doi/10.1111/j.1541-
0420.2007.00798.x/abstract
[3] Cummings, J. & Smith D. (2001) The Line-Intercept
Method: A Tool for Introductory Plant Ecology
Laboratories Retrieved July 2, 2014, from:
http://ableweb.org/volumes/vol-22/13-cummings.pdf
[4] Bibi,F. And Ali, Z. (2013)Measurement of Diversity
Indices of Avian Communities at Taunsa Barrage
WildlifeSanctuary,Pakistan . Retrieved July 2, 2014,
from:http://www.thejaps.org.pk/docs/v-23-
2/23.pdf

More Related Content

What's hot

Simpson index
Simpson indexSimpson index
Simpson index
Priyanka Kujur
 
EDITED Karmacharya Draft Five_SDT FINAL
EDITED Karmacharya Draft Five_SDT FINALEDITED Karmacharya Draft Five_SDT FINAL
EDITED Karmacharya Draft Five_SDT FINALBinab Karmacharya
 
Calculation of Species diversity and related indices
Calculation of Species diversity and related indicesCalculation of Species diversity and related indices
Calculation of Species diversity and related indices
Manideep Raj
 
Research Poster
Research PosterResearch Poster
Research PosterGavin John
 
Host community structure determines pathogen outbreak potential
Host community structure determines pathogen outbreak potentialHost community structure determines pathogen outbreak potential
Host community structure determines pathogen outbreak potential
ILRI
 
An Investigation in to Primate Crop Raiding from Farmland Surrounding Gongoni...
An Investigation in to Primate Crop Raiding from Farmland Surrounding Gongoni...An Investigation in to Primate Crop Raiding from Farmland Surrounding Gongoni...
An Investigation in to Primate Crop Raiding from Farmland Surrounding Gongoni...Dempsey Mai
 
Luce-PosterPresentation-26April2016
Luce-PosterPresentation-26April2016Luce-PosterPresentation-26April2016
Luce-PosterPresentation-26April2016Victoria Mann
 
Ecological sampling
Ecological samplingEcological sampling
Ecological sampling
Tahir Shahzad
 
6626907 83-population-ecology
6626907 83-population-ecology6626907 83-population-ecology
6626907 83-population-ecologyNgaire Taylor
 
Evaluating the impacts of the development of irrigation schemes in arid and s...
Evaluating the impacts of the development of irrigation schemes in arid and s...Evaluating the impacts of the development of irrigation schemes in arid and s...
Evaluating the impacts of the development of irrigation schemes in arid and s...
ILRI
 
Assessing the information content of fossil Glires using 'artificial extinction'
Assessing the information content of fossil Glires using 'artificial extinction'Assessing the information content of fossil Glires using 'artificial extinction'
Assessing the information content of fossil Glires using 'artificial extinction'
AimeRankin
 
Land use change and the risk of selected zoonotic diseases: Observations from...
Land use change and the risk of selected zoonotic diseases: Observations from...Land use change and the risk of selected zoonotic diseases: Observations from...
Land use change and the risk of selected zoonotic diseases: Observations from...
ILRI
 
Geographic and Taxonomic Selectivity Patterns in the Distribution of Rare Sou...
Geographic and Taxonomic Selectivity Patterns in the Distribution of Rare Sou...Geographic and Taxonomic Selectivity Patterns in the Distribution of Rare Sou...
Geographic and Taxonomic Selectivity Patterns in the Distribution of Rare Sou...
Jamie Estill
 
Wool Video Endpoints and Sources
Wool Video Endpoints and SourcesWool Video Endpoints and Sources
Wool Video Endpoints and Sources
sarakuykendall
 

What's hot (15)

Simpson index
Simpson indexSimpson index
Simpson index
 
EDITED Karmacharya Draft Five_SDT FINAL
EDITED Karmacharya Draft Five_SDT FINALEDITED Karmacharya Draft Five_SDT FINAL
EDITED Karmacharya Draft Five_SDT FINAL
 
Calculation of Species diversity and related indices
Calculation of Species diversity and related indicesCalculation of Species diversity and related indices
Calculation of Species diversity and related indices
 
Research Poster
Research PosterResearch Poster
Research Poster
 
Host community structure determines pathogen outbreak potential
Host community structure determines pathogen outbreak potentialHost community structure determines pathogen outbreak potential
Host community structure determines pathogen outbreak potential
 
An Investigation in to Primate Crop Raiding from Farmland Surrounding Gongoni...
An Investigation in to Primate Crop Raiding from Farmland Surrounding Gongoni...An Investigation in to Primate Crop Raiding from Farmland Surrounding Gongoni...
An Investigation in to Primate Crop Raiding from Farmland Surrounding Gongoni...
 
Luce-PosterPresentation-26April2016
Luce-PosterPresentation-26April2016Luce-PosterPresentation-26April2016
Luce-PosterPresentation-26April2016
 
Ecological sampling
Ecological samplingEcological sampling
Ecological sampling
 
Eje eje 201405-0008
Eje eje 201405-0008Eje eje 201405-0008
Eje eje 201405-0008
 
6626907 83-population-ecology
6626907 83-population-ecology6626907 83-population-ecology
6626907 83-population-ecology
 
Evaluating the impacts of the development of irrigation schemes in arid and s...
Evaluating the impacts of the development of irrigation schemes in arid and s...Evaluating the impacts of the development of irrigation schemes in arid and s...
Evaluating the impacts of the development of irrigation schemes in arid and s...
 
Assessing the information content of fossil Glires using 'artificial extinction'
Assessing the information content of fossil Glires using 'artificial extinction'Assessing the information content of fossil Glires using 'artificial extinction'
Assessing the information content of fossil Glires using 'artificial extinction'
 
Land use change and the risk of selected zoonotic diseases: Observations from...
Land use change and the risk of selected zoonotic diseases: Observations from...Land use change and the risk of selected zoonotic diseases: Observations from...
Land use change and the risk of selected zoonotic diseases: Observations from...
 
Geographic and Taxonomic Selectivity Patterns in the Distribution of Rare Sou...
Geographic and Taxonomic Selectivity Patterns in the Distribution of Rare Sou...Geographic and Taxonomic Selectivity Patterns in the Distribution of Rare Sou...
Geographic and Taxonomic Selectivity Patterns in the Distribution of Rare Sou...
 
Wool Video Endpoints and Sources
Wool Video Endpoints and SourcesWool Video Endpoints and Sources
Wool Video Endpoints and Sources
 

Similar to Ecological sampling simple scientific research

Distribution of macrozoobenthos in river narmada near water intake point
Distribution of macrozoobenthos in river narmada near water intake pointDistribution of macrozoobenthos in river narmada near water intake point
Distribution of macrozoobenthos in river narmada near water intake point
Alexander Decker
 
Species diversity ist practical
Species diversity ist practicalSpecies diversity ist practical
Species diversity ist practical
asarfajar
 
Cape biology uni 2 -_ecosystems_population_ecology_and_practical_methods_of_e...
Cape biology uni 2 -_ecosystems_population_ecology_and_practical_methods_of_e...Cape biology uni 2 -_ecosystems_population_ecology_and_practical_methods_of_e...
Cape biology uni 2 -_ecosystems_population_ecology_and_practical_methods_of_e...
Hilton Ritch
 
Malacofaunal distribution, abundance and diversity of the Nakana Lake, Dhule ...
Malacofaunal distribution, abundance and diversity of the Nakana Lake, Dhule ...Malacofaunal distribution, abundance and diversity of the Nakana Lake, Dhule ...
Malacofaunal distribution, abundance and diversity of the Nakana Lake, Dhule ...
Journal of Research in Biology
 
C4 conservation of biodiversity
C4 conservation of biodiversityC4 conservation of biodiversity
C4 conservation of biodiversity
lucascw
 
Biodiversity quantification ppt @ rp sir.
Biodiversity quantification ppt @ rp sir.Biodiversity quantification ppt @ rp sir.
Biodiversity quantification ppt @ rp sir.
EAMANISIVASURYATEJA
 
Silvestre Peru Cuzco Hymenoptera Congress 2014
Silvestre Peru Cuzco Hymenoptera Congress 2014Silvestre Peru Cuzco Hymenoptera Congress 2014
Silvestre Peru Cuzco Hymenoptera Congress 2014
Rogerio Silvestre
 
Courtney Emery
Courtney EmeryCourtney Emery
Courtney EmeryLigScience
 
Measurment of biodiversity surendra patel
Measurment of biodiversity surendra patelMeasurment of biodiversity surendra patel
Measurment of biodiversity surendra patel
SurendraPatel34
 
Chapters 8 11 ecology
Chapters 8 11 ecologyChapters 8 11 ecology
Chapters 8 11 ecology
Leandro Michael Delos Santos Jr.
 
Measuring Biodiversity
Measuring BiodiversityMeasuring Biodiversity
Measuring Biodiversity
Hawkesdale P12 College
 
Macroinvertebrate_Poster_Katie_Senior_Research
Macroinvertebrate_Poster_Katie_Senior_ResearchMacroinvertebrate_Poster_Katie_Senior_Research
Macroinvertebrate_Poster_Katie_Senior_ResearchKatherine Guild
 
biodiversity indices ppt.pptx
biodiversity indices ppt.pptxbiodiversity indices ppt.pptx
biodiversity indices ppt.pptx
PragatiInwati
 
FAITH.WARREN.BIOASSESSMENTPAPER.4.21.14
FAITH.WARREN.BIOASSESSMENTPAPER.4.21.14FAITH.WARREN.BIOASSESSMENTPAPER.4.21.14
FAITH.WARREN.BIOASSESSMENTPAPER.4.21.14Faith Warren
 
Writing up a scientific paper
Writing up a scientific paperWriting up a scientific paper
Writing up a scientific paperCharlotte Barton
 
EEB Group Ecology Report
EEB Group Ecology ReportEEB Group Ecology Report
EEB Group Ecology ReportLisa Tripp
 
Analyses of Community Attributes of Meiofauna Under A Pollution Regime in the...
Analyses of Community Attributes of Meiofauna Under A Pollution Regime in the...Analyses of Community Attributes of Meiofauna Under A Pollution Regime in the...
Analyses of Community Attributes of Meiofauna Under A Pollution Regime in the...
Agriculture Journal IJOEAR
 

Similar to Ecological sampling simple scientific research (20)

Distribution of macrozoobenthos in river narmada near water intake point
Distribution of macrozoobenthos in river narmada near water intake pointDistribution of macrozoobenthos in river narmada near water intake point
Distribution of macrozoobenthos in river narmada near water intake point
 
Species diversity ist practical
Species diversity ist practicalSpecies diversity ist practical
Species diversity ist practical
 
Cape biology uni 2 -_ecosystems_population_ecology_and_practical_methods_of_e...
Cape biology uni 2 -_ecosystems_population_ecology_and_practical_methods_of_e...Cape biology uni 2 -_ecosystems_population_ecology_and_practical_methods_of_e...
Cape biology uni 2 -_ecosystems_population_ecology_and_practical_methods_of_e...
 
Malacofaunal distribution, abundance and diversity of the Nakana Lake, Dhule ...
Malacofaunal distribution, abundance and diversity of the Nakana Lake, Dhule ...Malacofaunal distribution, abundance and diversity of the Nakana Lake, Dhule ...
Malacofaunal distribution, abundance and diversity of the Nakana Lake, Dhule ...
 
C4 conservation of biodiversity
C4 conservation of biodiversityC4 conservation of biodiversity
C4 conservation of biodiversity
 
mastitsky_article
mastitsky_articlemastitsky_article
mastitsky_article
 
Biodiversity quantification ppt @ rp sir.
Biodiversity quantification ppt @ rp sir.Biodiversity quantification ppt @ rp sir.
Biodiversity quantification ppt @ rp sir.
 
Silvestre Peru Cuzco Hymenoptera Congress 2014
Silvestre Peru Cuzco Hymenoptera Congress 2014Silvestre Peru Cuzco Hymenoptera Congress 2014
Silvestre Peru Cuzco Hymenoptera Congress 2014
 
Courtney Emery
Courtney EmeryCourtney Emery
Courtney Emery
 
Measurment of biodiversity surendra patel
Measurment of biodiversity surendra patelMeasurment of biodiversity surendra patel
Measurment of biodiversity surendra patel
 
Chapters 8 11 ecology
Chapters 8 11 ecologyChapters 8 11 ecology
Chapters 8 11 ecology
 
Measuring Biodiversity
Measuring BiodiversityMeasuring Biodiversity
Measuring Biodiversity
 
Macroinvertebrate_Poster_Katie_Senior_Research
Macroinvertebrate_Poster_Katie_Senior_ResearchMacroinvertebrate_Poster_Katie_Senior_Research
Macroinvertebrate_Poster_Katie_Senior_Research
 
biodiversity indices ppt.pptx
biodiversity indices ppt.pptxbiodiversity indices ppt.pptx
biodiversity indices ppt.pptx
 
Magurran estrutura comunidades
Magurran estrutura comunidadesMagurran estrutura comunidades
Magurran estrutura comunidades
 
FAITH.WARREN.BIOASSESSMENTPAPER.4.21.14
FAITH.WARREN.BIOASSESSMENTPAPER.4.21.14FAITH.WARREN.BIOASSESSMENTPAPER.4.21.14
FAITH.WARREN.BIOASSESSMENTPAPER.4.21.14
 
Writing up a scientific paper
Writing up a scientific paperWriting up a scientific paper
Writing up a scientific paper
 
EEB Group Ecology Report
EEB Group Ecology ReportEEB Group Ecology Report
EEB Group Ecology Report
 
Analyses of Community Attributes of Meiofauna Under A Pollution Regime in the...
Analyses of Community Attributes of Meiofauna Under A Pollution Regime in the...Analyses of Community Attributes of Meiofauna Under A Pollution Regime in the...
Analyses of Community Attributes of Meiofauna Under A Pollution Regime in the...
 
Tang_Sedgwick_Paper
Tang_Sedgwick_PaperTang_Sedgwick_Paper
Tang_Sedgwick_Paper
 

Recently uploaded

MARUTI SUZUKI- A Successful Joint Venture in India.pptx
MARUTI SUZUKI- A Successful Joint Venture in India.pptxMARUTI SUZUKI- A Successful Joint Venture in India.pptx
MARUTI SUZUKI- A Successful Joint Venture in India.pptx
bennyroshan06
 
The Roman Empire A Historical Colossus.pdf
The Roman Empire A Historical Colossus.pdfThe Roman Empire A Historical Colossus.pdf
The Roman Empire A Historical Colossus.pdf
kaushalkr1407
 
Sectors of the Indian Economy - Class 10 Study Notes pdf
Sectors of the Indian Economy - Class 10 Study Notes pdfSectors of the Indian Economy - Class 10 Study Notes pdf
Sectors of the Indian Economy - Class 10 Study Notes pdf
Vivekanand Anglo Vedic Academy
 
aaaaaaaaaaaaaaaaaaaaaaaaaaaaaaaaaaaaaaaaaaaaaaaaaaaaaaa
aaaaaaaaaaaaaaaaaaaaaaaaaaaaaaaaaaaaaaaaaaaaaaaaaaaaaaaaaaaaaaaaaaaaaaaaaaaaaaaaaaaaaaaaaaaaaaaaaaaaaaaaaaaaaa
aaaaaaaaaaaaaaaaaaaaaaaaaaaaaaaaaaaaaaaaaaaaaaaaaaaaaaa
siemaillard
 
Polish students' mobility in the Czech Republic
Polish students' mobility in the Czech RepublicPolish students' mobility in the Czech Republic
Polish students' mobility in the Czech Republic
Anna Sz.
 
Fish and Chips - have they had their chips
Fish and Chips - have they had their chipsFish and Chips - have they had their chips
Fish and Chips - have they had their chips
GeoBlogs
 
Digital Tools and AI for Teaching Learning and Research
Digital Tools and AI for Teaching Learning and ResearchDigital Tools and AI for Teaching Learning and Research
Digital Tools and AI for Teaching Learning and Research
Vikramjit Singh
 
The approach at University of Liverpool.pptx
The approach at University of Liverpool.pptxThe approach at University of Liverpool.pptx
The approach at University of Liverpool.pptx
Jisc
 
aaaaaaaaaaaaaaaaaaaaaaaaaaaaaaaaaaaaaaaaa
aaaaaaaaaaaaaaaaaaaaaaaaaaaaaaaaaaaaaaaaaaaaaaaaaaaaaaaaaaaaaaaaaaaaaaaaaaaaaaaaaa
aaaaaaaaaaaaaaaaaaaaaaaaaaaaaaaaaaaaaaaaa
siemaillard
 
Unit 8 - Information and Communication Technology (Paper I).pdf
Unit 8 - Information and Communication Technology (Paper I).pdfUnit 8 - Information and Communication Technology (Paper I).pdf
Unit 8 - Information and Communication Technology (Paper I).pdf
Thiyagu K
 
Model Attribute Check Company Auto Property
Model Attribute  Check Company Auto PropertyModel Attribute  Check Company Auto Property
Model Attribute Check Company Auto Property
Celine George
 
Synthetic Fiber Construction in lab .pptx
Synthetic Fiber Construction in lab .pptxSynthetic Fiber Construction in lab .pptx
Synthetic Fiber Construction in lab .pptx
Pavel ( NSTU)
 
1.4 modern child centered education - mahatma gandhi-2.pptx
1.4 modern child centered education - mahatma gandhi-2.pptx1.4 modern child centered education - mahatma gandhi-2.pptx
1.4 modern child centered education - mahatma gandhi-2.pptx
JosvitaDsouza2
 
The French Revolution Class 9 Study Material pdf free download
The French Revolution Class 9 Study Material pdf free downloadThe French Revolution Class 9 Study Material pdf free download
The French Revolution Class 9 Study Material pdf free download
Vivekanand Anglo Vedic Academy
 
PART A. Introduction to Costumer Service
PART A. Introduction to Costumer ServicePART A. Introduction to Costumer Service
PART A. Introduction to Costumer Service
PedroFerreira53928
 
Students, digital devices and success - Andreas Schleicher - 27 May 2024..pptx
Students, digital devices and success - Andreas Schleicher - 27 May 2024..pptxStudents, digital devices and success - Andreas Schleicher - 27 May 2024..pptx
Students, digital devices and success - Andreas Schleicher - 27 May 2024..pptx
EduSkills OECD
 
GIÁO ÁN DẠY THÊM (KẾ HOẠCH BÀI BUỔI 2) - TIẾNG ANH 8 GLOBAL SUCCESS (2 CỘT) N...
GIÁO ÁN DẠY THÊM (KẾ HOẠCH BÀI BUỔI 2) - TIẾNG ANH 8 GLOBAL SUCCESS (2 CỘT) N...GIÁO ÁN DẠY THÊM (KẾ HOẠCH BÀI BUỔI 2) - TIẾNG ANH 8 GLOBAL SUCCESS (2 CỘT) N...
GIÁO ÁN DẠY THÊM (KẾ HOẠCH BÀI BUỔI 2) - TIẾNG ANH 8 GLOBAL SUCCESS (2 CỘT) N...
Nguyen Thanh Tu Collection
 
The Art Pastor's Guide to Sabbath | Steve Thomason
The Art Pastor's Guide to Sabbath | Steve ThomasonThe Art Pastor's Guide to Sabbath | Steve Thomason
The Art Pastor's Guide to Sabbath | Steve Thomason
Steve Thomason
 
Welcome to TechSoup New Member Orientation and Q&A (May 2024).pdf
Welcome to TechSoup   New Member Orientation and Q&A (May 2024).pdfWelcome to TechSoup   New Member Orientation and Q&A (May 2024).pdf
Welcome to TechSoup New Member Orientation and Q&A (May 2024).pdf
TechSoup
 
Introduction to Quality Improvement Essentials
Introduction to Quality Improvement EssentialsIntroduction to Quality Improvement Essentials
Introduction to Quality Improvement Essentials
Excellence Foundation for South Sudan
 

Recently uploaded (20)

MARUTI SUZUKI- A Successful Joint Venture in India.pptx
MARUTI SUZUKI- A Successful Joint Venture in India.pptxMARUTI SUZUKI- A Successful Joint Venture in India.pptx
MARUTI SUZUKI- A Successful Joint Venture in India.pptx
 
The Roman Empire A Historical Colossus.pdf
The Roman Empire A Historical Colossus.pdfThe Roman Empire A Historical Colossus.pdf
The Roman Empire A Historical Colossus.pdf
 
Sectors of the Indian Economy - Class 10 Study Notes pdf
Sectors of the Indian Economy - Class 10 Study Notes pdfSectors of the Indian Economy - Class 10 Study Notes pdf
Sectors of the Indian Economy - Class 10 Study Notes pdf
 
aaaaaaaaaaaaaaaaaaaaaaaaaaaaaaaaaaaaaaaaaaaaaaaaaaaaaaa
aaaaaaaaaaaaaaaaaaaaaaaaaaaaaaaaaaaaaaaaaaaaaaaaaaaaaaaaaaaaaaaaaaaaaaaaaaaaaaaaaaaaaaaaaaaaaaaaaaaaaaaaaaaaaa
aaaaaaaaaaaaaaaaaaaaaaaaaaaaaaaaaaaaaaaaaaaaaaaaaaaaaaa
 
Polish students' mobility in the Czech Republic
Polish students' mobility in the Czech RepublicPolish students' mobility in the Czech Republic
Polish students' mobility in the Czech Republic
 
Fish and Chips - have they had their chips
Fish and Chips - have they had their chipsFish and Chips - have they had their chips
Fish and Chips - have they had their chips
 
Digital Tools and AI for Teaching Learning and Research
Digital Tools and AI for Teaching Learning and ResearchDigital Tools and AI for Teaching Learning and Research
Digital Tools and AI for Teaching Learning and Research
 
The approach at University of Liverpool.pptx
The approach at University of Liverpool.pptxThe approach at University of Liverpool.pptx
The approach at University of Liverpool.pptx
 
aaaaaaaaaaaaaaaaaaaaaaaaaaaaaaaaaaaaaaaaa
aaaaaaaaaaaaaaaaaaaaaaaaaaaaaaaaaaaaaaaaaaaaaaaaaaaaaaaaaaaaaaaaaaaaaaaaaaaaaaaaaa
aaaaaaaaaaaaaaaaaaaaaaaaaaaaaaaaaaaaaaaaa
 
Unit 8 - Information and Communication Technology (Paper I).pdf
Unit 8 - Information and Communication Technology (Paper I).pdfUnit 8 - Information and Communication Technology (Paper I).pdf
Unit 8 - Information and Communication Technology (Paper I).pdf
 
Model Attribute Check Company Auto Property
Model Attribute  Check Company Auto PropertyModel Attribute  Check Company Auto Property
Model Attribute Check Company Auto Property
 
Synthetic Fiber Construction in lab .pptx
Synthetic Fiber Construction in lab .pptxSynthetic Fiber Construction in lab .pptx
Synthetic Fiber Construction in lab .pptx
 
1.4 modern child centered education - mahatma gandhi-2.pptx
1.4 modern child centered education - mahatma gandhi-2.pptx1.4 modern child centered education - mahatma gandhi-2.pptx
1.4 modern child centered education - mahatma gandhi-2.pptx
 
The French Revolution Class 9 Study Material pdf free download
The French Revolution Class 9 Study Material pdf free downloadThe French Revolution Class 9 Study Material pdf free download
The French Revolution Class 9 Study Material pdf free download
 
PART A. Introduction to Costumer Service
PART A. Introduction to Costumer ServicePART A. Introduction to Costumer Service
PART A. Introduction to Costumer Service
 
Students, digital devices and success - Andreas Schleicher - 27 May 2024..pptx
Students, digital devices and success - Andreas Schleicher - 27 May 2024..pptxStudents, digital devices and success - Andreas Schleicher - 27 May 2024..pptx
Students, digital devices and success - Andreas Schleicher - 27 May 2024..pptx
 
GIÁO ÁN DẠY THÊM (KẾ HOẠCH BÀI BUỔI 2) - TIẾNG ANH 8 GLOBAL SUCCESS (2 CỘT) N...
GIÁO ÁN DẠY THÊM (KẾ HOẠCH BÀI BUỔI 2) - TIẾNG ANH 8 GLOBAL SUCCESS (2 CỘT) N...GIÁO ÁN DẠY THÊM (KẾ HOẠCH BÀI BUỔI 2) - TIẾNG ANH 8 GLOBAL SUCCESS (2 CỘT) N...
GIÁO ÁN DẠY THÊM (KẾ HOẠCH BÀI BUỔI 2) - TIẾNG ANH 8 GLOBAL SUCCESS (2 CỘT) N...
 
The Art Pastor's Guide to Sabbath | Steve Thomason
The Art Pastor's Guide to Sabbath | Steve ThomasonThe Art Pastor's Guide to Sabbath | Steve Thomason
The Art Pastor's Guide to Sabbath | Steve Thomason
 
Welcome to TechSoup New Member Orientation and Q&A (May 2024).pdf
Welcome to TechSoup   New Member Orientation and Q&A (May 2024).pdfWelcome to TechSoup   New Member Orientation and Q&A (May 2024).pdf
Welcome to TechSoup New Member Orientation and Q&A (May 2024).pdf
 
Introduction to Quality Improvement Essentials
Introduction to Quality Improvement EssentialsIntroduction to Quality Improvement Essentials
Introduction to Quality Improvement Essentials
 

Ecological sampling simple scientific research

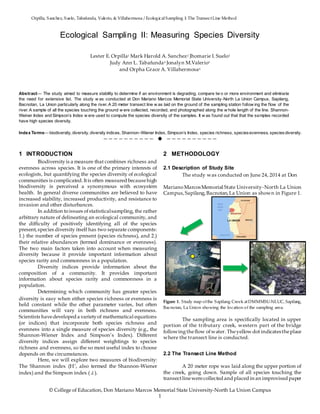
  • 1. Orpilla, Sanchez, Suelo, Tabafunda, Valerio, & Villahermosa / Ecological Sampling I: The TransectLine Method © College of Education, Don Mariano Marcos Memorial State University-North La Union Campus 1 Ecological Sampling II: Measuring Species Diversity Lester E. Orpilla1 Mark Harold A. Sanchez2 Jhomarie I. Suelo3 Judy Ann L. Tabafunda4 Jonalyn M.Valerio5 and Orpha Grace A. Villahermosa6 Abstract— The study aimed to measure stability to determine if an environment is degrading, compare tw o or more environment and eliminate the need for extensive list. The study w as conducted at Don Mariano Marcos Memorial State University-North La Union Campus, Sapilang, Bacnotan, La Union particularly along the river. A 20 meter transect line w as laid on the ground of the sampling station follow ing the flow of the river. A sample of all the species touching the ground w ere collected, recorded, and photographed along the w hole length of the line. Shannon- Weiner Index and Simpson’s Index w ere used to compute the species diversity of the samples. It w as found out that that the samples recorded have high species diversity. Index Terms— biodiversity, diversity, diversity indices, Shannon–Wiener Index, Simpson’s Index, species richness, speciesevenness, speciesdiversity. ——————————  —————————— 1 INTRODUCTION Biodiversityis a measure that combines richness and evenness across species. It is one of the primary interests of ecologists, but quantifying the species diversity of ecological communities is complicated. Itis often measured becausehigh biodiversity is perceived a synonymous with ecosystem health. In general diverse communities are believed to have increased stability, increased productivity, and resistance to invasion and other disturbances. In addition toissues ofstatisticalsampling, the rather arbitrary nature of delineating an ecological community, and the difficulty of positively identifying all of the species present,species diversity itself has two separate components: 1.) the number of species present (species richness), and 2.) their relative abundances (termed dominance or evenness). The two main factors taken into account when measuring diversity because it provide important information about species rarity and commonness in a population. Diversity indices provide information about the composition of a community. It provides important information about species rarity and commonness in a population. Determining which community has greater species diversity is easy when either species richness or evenness is held constant while the other parameter varies, but often communities will vary in both richness and evenness. Scientists havedeveloped a varietyof mathematical equations (or indices) that incorporate both species richness and evenness into a single measure of species diversity (e.g., the Shannon-Wiener Index and Simpson’s Index). Different diversity indices assign different weightings to species richness and evenness, so the so most useful index to choose depends on the circumstances. Here, we will explore two measures of biodiversity: The Shannon index (Hʼ, also termed the Shannon-Wiener index) and the Simpson index (  ). 2 METHODOLOGY 2.1 Description of Study Site The study was conducted on June 24, 2014 at Don MarianoMarcosMemorial State University-North La Union Campus,Sapilang,Bacnotan,La Union as shown in Figure 1. Figure 1. Study map ofthe Sapilang Creek atDMMMSU-NLUC, Sapilang, Bacnotan, La Union showing the location of the sampling area. The sampling area is specifically located in upper portion of the tributary creek, western part of the bridge followingtheflow ofwater. Theyellow dot indicatestheplace where the transect line is conducted. 2.2 The Transect Line Method A 20 meter rope was laid along the upper portion of the creek, going down. Sample of all species touching the transectlinewerecollected and placed in an improvised paper
  • 2. Orpilla, Sanchez, Suelo, Tabafunda, Valerio, & Villahermosa / Ecological Sampling I: The TransectLine Method © College of Education, Don Mariano Marcos Memorial State University-North La Union Campus 2    1NN 1nn     ii  bag specimen and werelabeled species 1, species 2, species 3, and soon, recorded theirabundance,photographed andwere identified their scientific names. 2.1 The Shannon-Wiener Index Species evenness, richness, and diversity indices as Shannon-Weiner (Shannon and Weaver, 1949) and Simpson Index (Simpson,1949)wereused to evaluate the bird species diversity.Shannon-WeinerIndex assumes that individualsare randomlysampled froman independentlargepopulation and all the species are represented in the sample. Shannon diversityis very widely used index for comparing diversity betweenvarious habitats(Clarkeand Warwick, 2001). It was calculated in ordertoknow the species diversity in different habitat (Hutchison, 1970) based on the abundance of the species by the following formula: H' = -∑ 𝒑𝒊 (𝒍𝒏 𝒑𝒊)𝒔 𝒊=𝟏 Where,H ́ = Diversity Index ; Pi = is the proportion of each species in the sample ; lnPi = natural logarithm of this proportion.Thepresenceof one individual of a species is not necessarily indicative of the species being present in a large number.ThevalueofShannon Weiner DiversityIndex usually falls between 1.5 and 3.5,only rarelyit surpasses 4.5. A value near 4.6 would indicate that the numbers of individuals are evenly distributed between all the species. 2.2 The Simpson’s Index It measures the probability that two individuals randomly selected from a sample will belong to the same species.Simpsongavetheprobabilityof any two individuals drawn from noticeably large community belonging to different species.It has been measured by the given formula where ni = thetotal numberof organisms ofeach individual species N = the total number of organisms of all species  = is a measure of dominance and 1-  measures species diversity 3. RESULTS AND DISCUSSIONS Typical valuesofShannon-WeinerIndex aregenerally between1.5 and 3.5 in mostecological studies,and theindex is rarelygreaterthan 4.TheShannonindex increases as both the richnessand theevennessofthecommunityincrease.The fact that theindexincorporates both components of biodiversity can be seen as both strength and a weakness. It is strength becauseit provides a simple, synthetic summary, but it is a weakness because it makes it difficult to compare communities that differ greatly in richness. Thecomputed Shannon-Weiner Index of the species in the transect line method is 2.442629271. Since the index value is high, this means that species diversity is high which indicates less competitionbetween species. The Table 1 below shows thecomputation oftheShannon-Weiner Index. Species number 3 is the most abundant species. Table 1.AbundanceofIdentified SamplingSpecies Present in the Study Site Species Scientific Name n 1 Arctostaphylos manzanita 3 2 Leucaena lecocephala 10 3 Vernonia cinerea 78 4 Lantana camara 43 5 Samanea saman 1 6 Mimosa pudica 8 7 Phyllanthus niruri 3 8 10 9 Centrosema sp. 8 10 10 11 Cymbopogonwinterianus 2 12 Clitoria ternatea 59 13 8 14 Cyperus esculentus 6 15 Brachiaria platyphylla 40 16 Digitaria sp. 13 17 Dactylis glomerata 17 18 Agrostis sp. 29 19 9 TotalNumbers of Individuals 357
  • 3. Orpilla, Sanchez, Suelo, Tabafunda, Valerio, & Villahermosa / Ecological Sampling I: The TransectLine Method © College of Education, Don Mariano Marcos Memorial State University-North La Union Campus 3 Table 1. Shannon-Weiner Index Table 2. Simpson’s Index Species ni ni/N ln(ni/n) − ∑(ni/Nxln(ni/n) 1 3 0.0084 -4.77912 -0.040160702 2 10 0.02801 -3.57515 -0.100144277 3 78 0.21849 -1.52103 -0.332325217 4 43 0.12045 -2.11654 -0.254932867 5 1 0.0028 -5.87774 -0.016464246 6 8 0.02241 -3.79829 -0.085115837 7 3 0.0084 -4.77912 -0.040160702 8 10 0.02801 -3.57515 -0.100144277 9 8 0.02241 -3.79829 -0.085115837 10 10 0.02801 -3.57515 -0.100144277 11 2 0.0056 -5.18459 -0.029045314 12 59 0.16527 -1.8002 -0.29751177 13 8 0.02241 -3.79829 -0.085115837 14 6 0.01681 -4.08598 -0.068671871 15 40 0.11204 -2.18886 -0.245250009 16 13 0.03641 -3.31279 -0.120633679 17 17 0.04762 -3.04452 -0.144977259 18 29 0.08123 -2.51044 -0.203929296 19 9 0.02521 -3.68051 -0.092785997 N=357 2.442629271 Species ni ni(ni- 1) N(N-1) ni(ni-1)/ N(N-1) 1 3 6 127092 4.72099E-05 2 10 90 127092 0.000708148 3 78 6006 127092 0.047257105 4 43 1806 127092 0.014210178 5 1 0 127092 0 6 8 56 127092 0.000440626 7 3 6 127092 4.72099E-05 8 10 90 127092 0.000708148 9 2 2 127092 1.57366E-05 10 10 90 127092 0.000708148 11 2 2 127092 1.57366E-05 12 59 3422 127092 0.026925377 13 8 56 127092 0.000440626 14 6 30 127092 0.000236049 15 40 1560 127092 0.012274573 16 13 156 127092 0.001227457 17 17 272 127092 0.002140182 18 29 812 127092 0.006389072 19 9 72 127092 0.000566519 N=357 0.114358103
  • 4. Orpilla, Sanchez, Suelo, Tabafunda, Valerio, & Villahermosa / Ecological Sampling I: The TransectLine Method © College of Education, Don Mariano Marcos Memorial State University-North La Union Campus 4 In the Simpson’s Index, the value of  ranges between 0 and 1. With this index, 0 represents infinite diversityand 1,no diversity. That is, the bigger the value of  , the lower thediversity.This is neitherintuitivenorlogical,so to get over this problem,  is often subtracted from 1 to give: Simpson's Index of Diversity 1 -  . The value of this index also ranges between 0 and 1, but now, the greater the value, the greater the sample diversity. This makes more sense. In this case, the index represents the probability that two individuals randomly selected from a sample will belong to different species. The computed Simpson’s Index value of the species recorded is 0.114358103and theindex diversity is 0.89 which means that there is greater species diversity. 4. CONCLUSIONS Based on the salient findings of the study, the following conclusions can be drawn: 1. Thespecies richnessis high but species are not evenly distributed; 2. Thereis high species diversityin thesamplingstation, thus the environment is very stable; 3. Shannon Weiner Index and Simpson’s Index have different ways of computing the species diversity but they have the same interpretation; 4. Shannon-WeinerIndex and Simpson’s cannot include all species from the community in the sample; 5. Thevalueof a biodiversityindex mayvarywith small changes in thespecies data that it is calculated from, but also with habitat type and time period; and 6. Diversecommunities areoften a sign of fragmented or somewhat degraded sites where much of species richness is contributed by disturbance species. ACKNOWLEDGMENT The authors wish to thank the following people for helpingin the completion of the study: (1) Mr. Jomar L. Aban, subject professor in BS 116 (Biotecniques) (2) Dr. Rosita P. Abubo, Dean of the College of Education, DMMMSU-NLUC. (3) Dr. Criselda G.Sario,SEd Chairman, College of Education, DMMMSU-NLUC, (4) Mrs. Violita F. Collado, adviser of the authors (5)theirparents for thefinancial and moral assistance. REFERENCES [1] Magurran,A.M. (2004).MeasuringBiological DiversityBlackwell ScienceLtd,Oxford. [2] Buckland,S.T., Borchers D. L., Johnston A., Henrys P. A. & Marques T.A. (2007)LineTransect Methods for Plant Surveys. . Retrieved July 2, 2014, from: http://onlinelibrary.wiley.com/doi/10.1111/j.1541- 0420.2007.00798.x/abstract [3] Cummings, J. & Smith D. (2001) The Line-Intercept Method: A Tool for Introductory Plant Ecology Laboratories Retrieved July 2, 2014, from: http://ableweb.org/volumes/vol-22/13-cummings.pdf [4] Bibi,F. And Ali, Z. (2013)Measurement of Diversity Indices of Avian Communities at Taunsa Barrage WildlifeSanctuary,Pakistan . Retrieved July 2, 2014, from:http://www.thejaps.org.pk/docs/v-23- 2/23.pdf