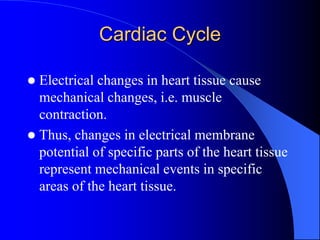
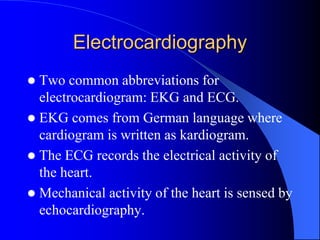
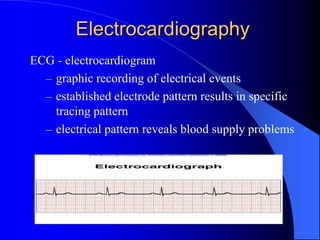
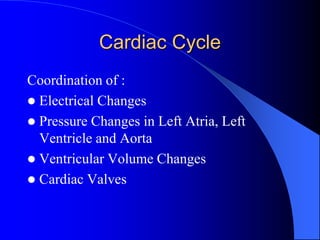
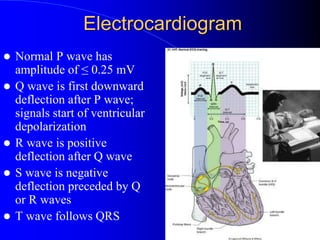
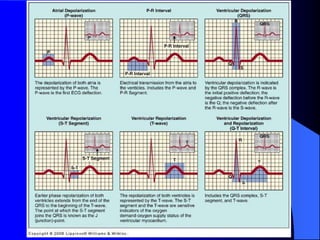
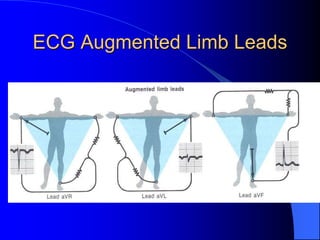
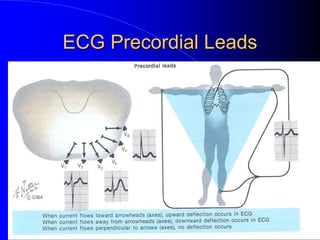
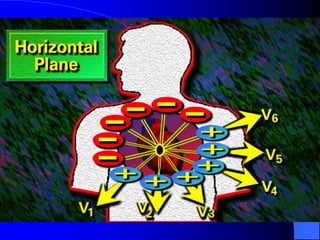
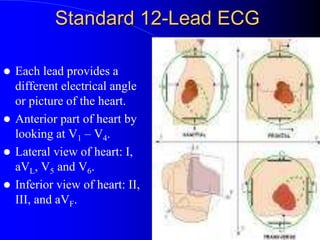
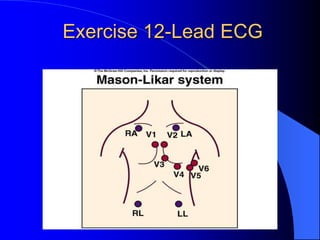
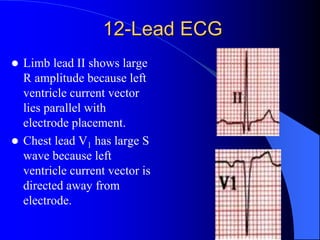
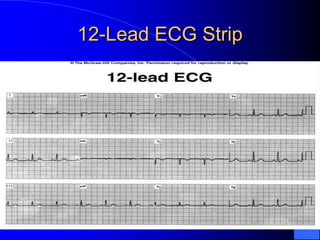
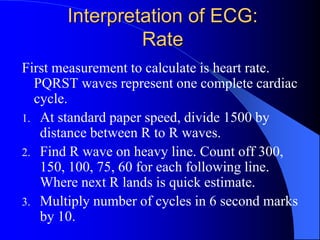
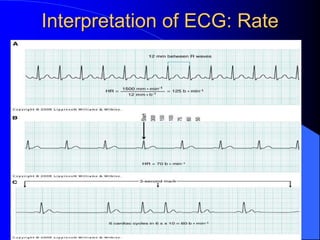
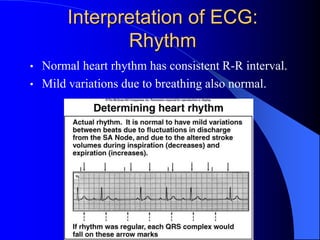
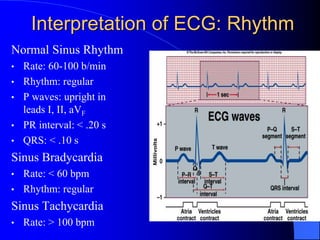
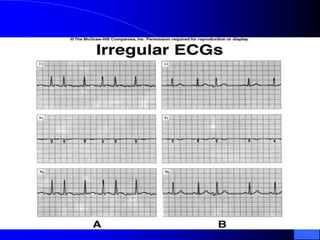
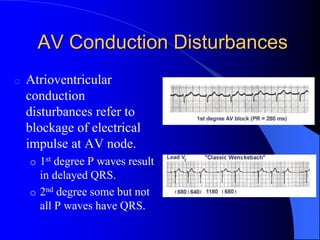
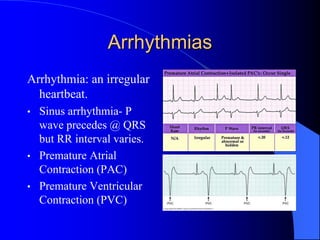
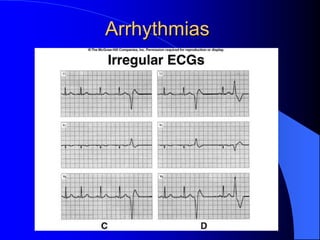
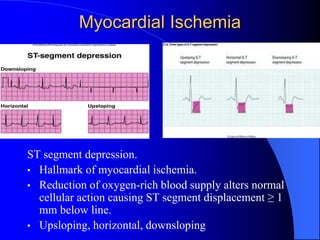
The document outlines the mechanical and electrical events of the cardiac cycle, detailing phases such as diastole and systole, while also explaining the roles of electrocardiography (ECG) in monitoring heart activity. It emphasizes the significance of electrical changes in heart tissue and their correlation with mechanical events, as well as providing insights into ECG interpretation and the detection of arrhythmias and myocardial ischemia. The document includes detailed information about the standard 12-lead ECG setup and normal versus abnormal heart rhythms.
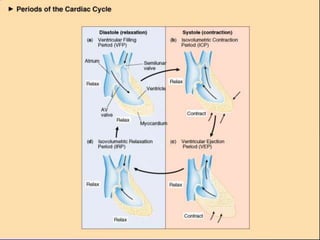
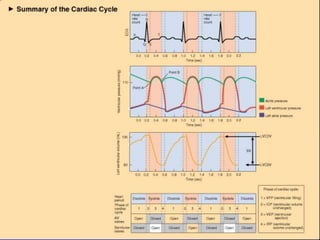
![Mechanical Events of the
Cardiac Cycle
1. Ventricular Filling Period [ventricular
diastole, atrial systole]
2. Isovolumetric Contraction Period [ventricular
systole]
3. Ventricular Ejection Period [ventricular
systole]
4. Isovolumetric Relaxation Period [ventricular
diastole, atrial diastole]](https://image.slidesharecdn.com/ecg-220906134007-8508d7d9/85/ECG-ppt-3-320.jpg)