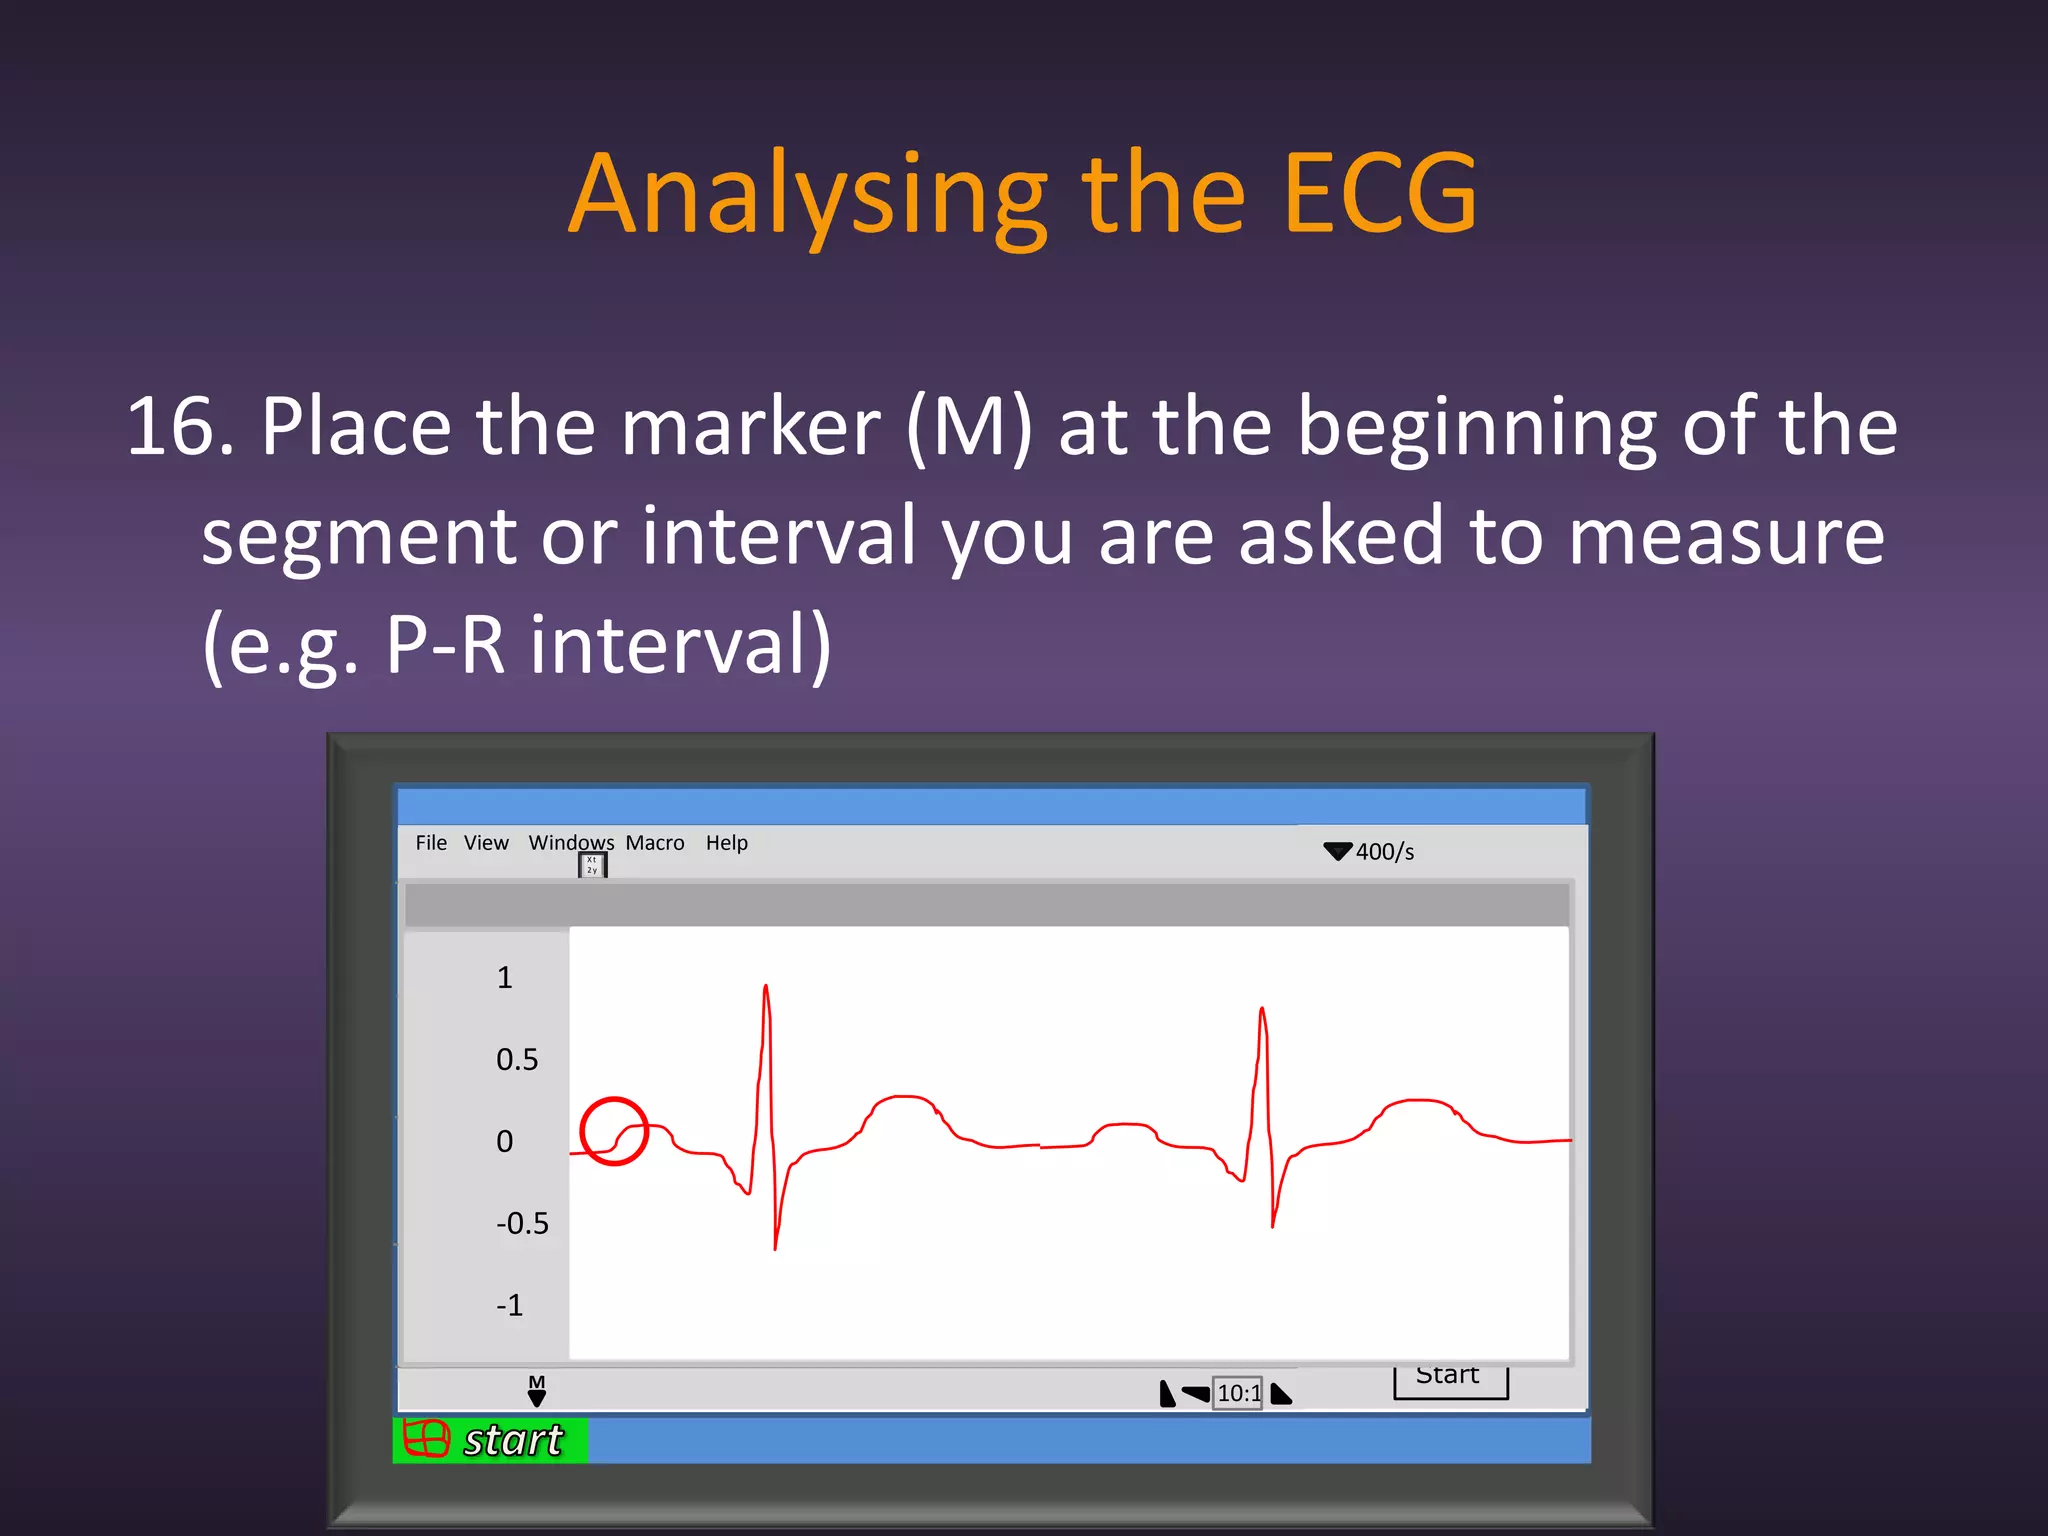
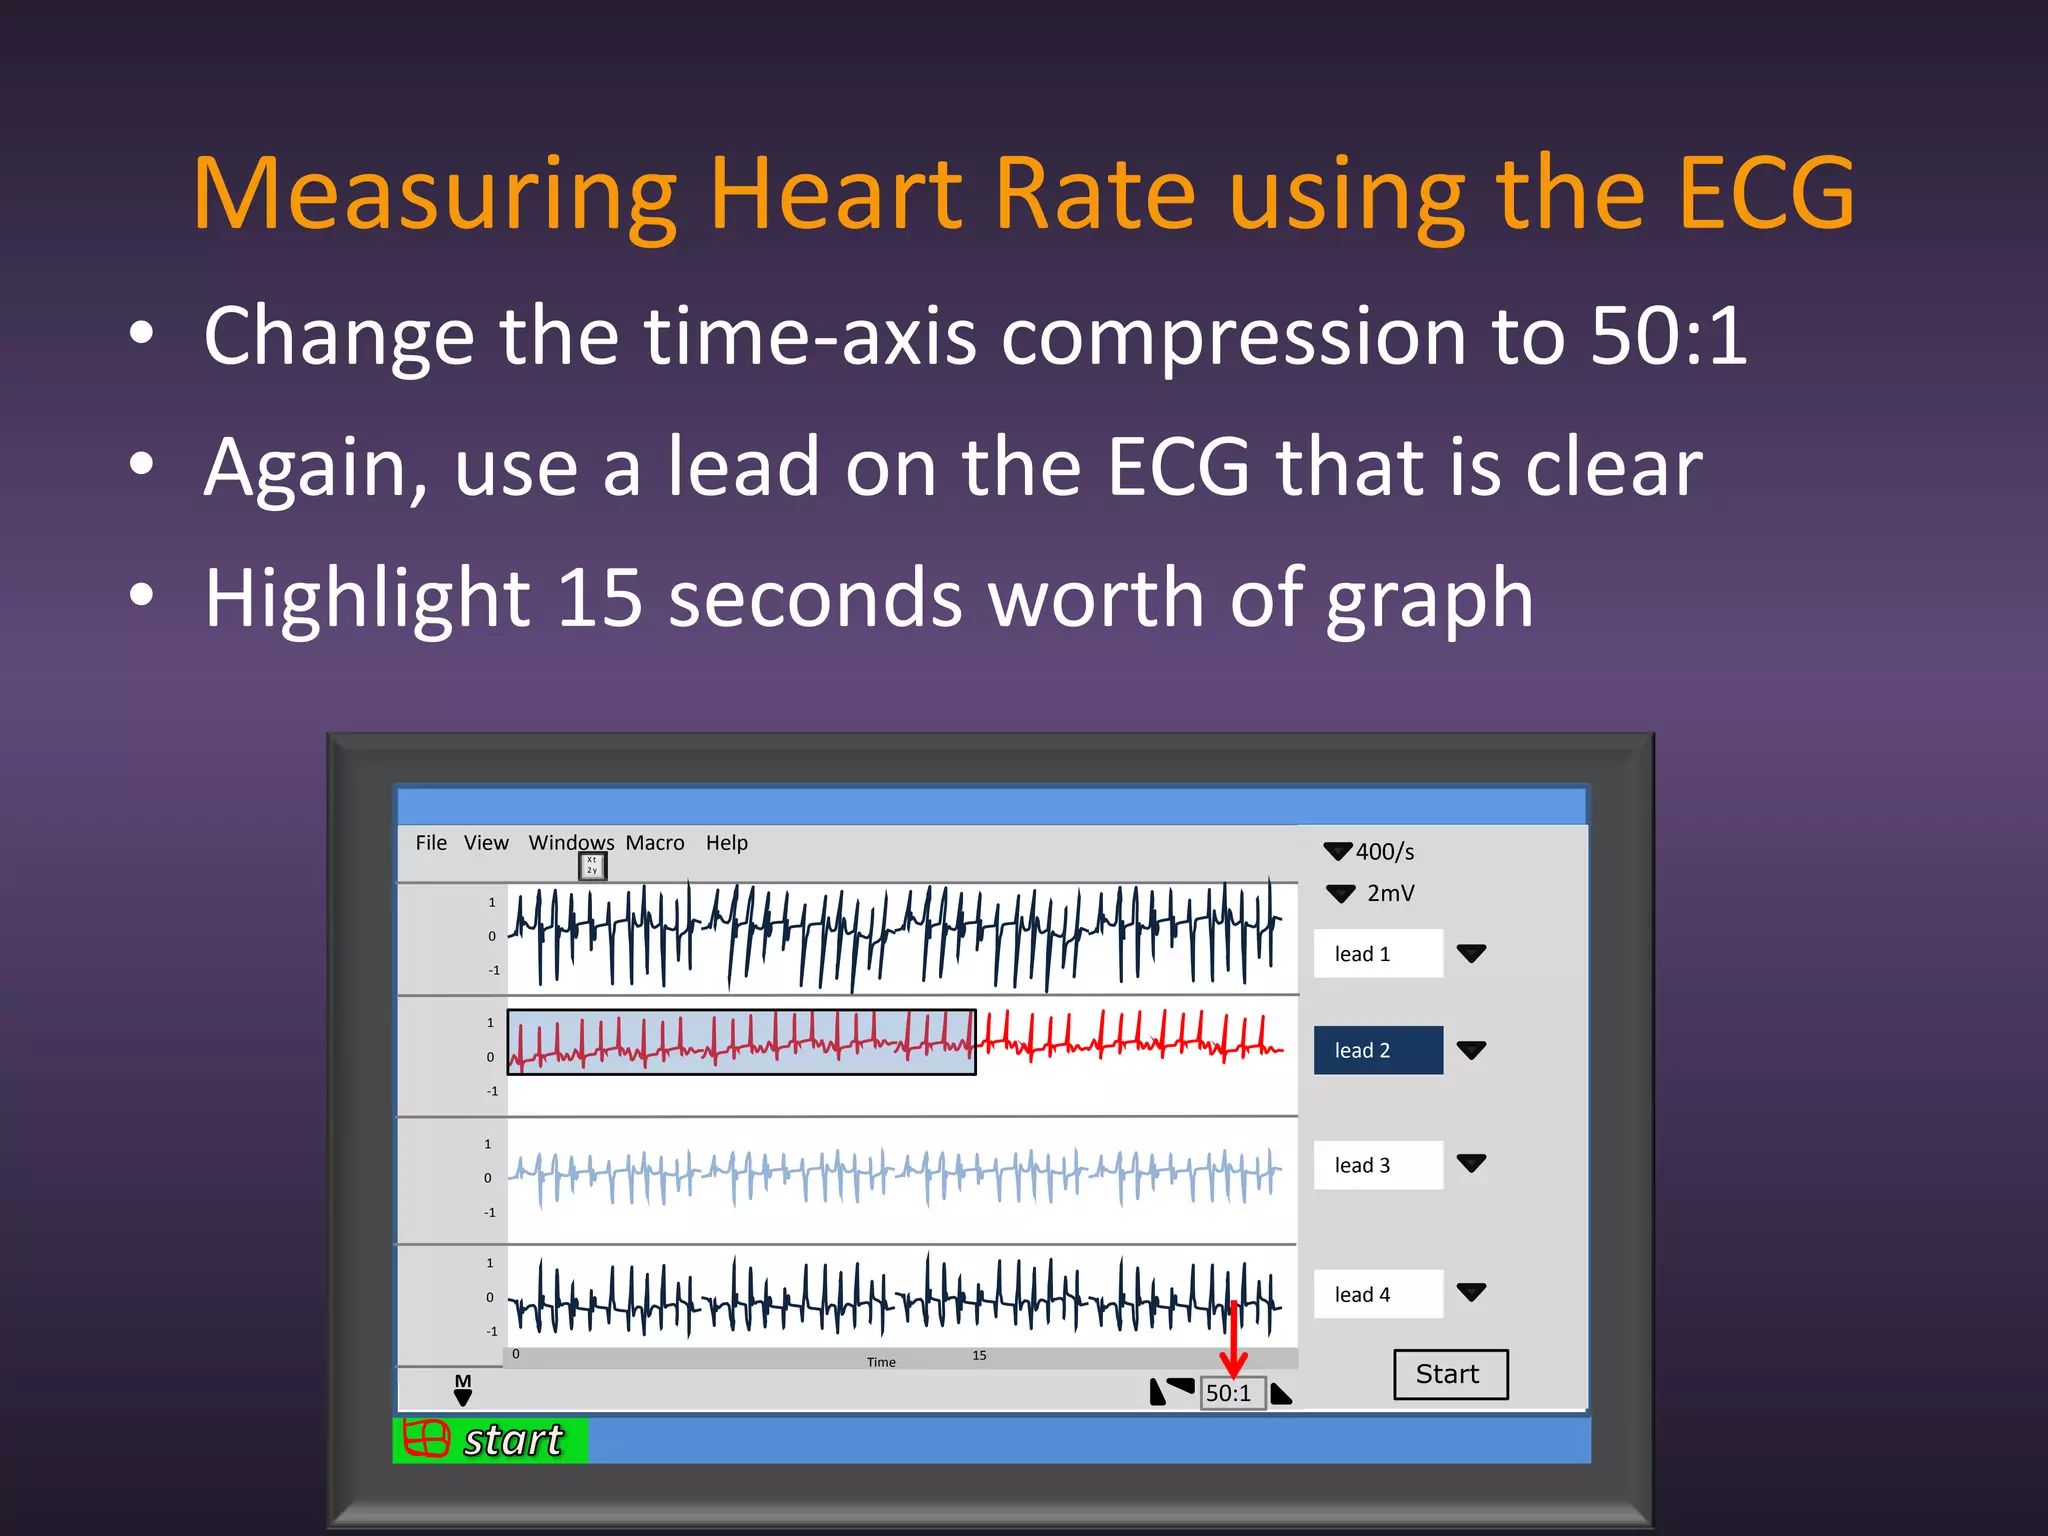
Recording & interpreting the ECG
Contents
•   What is the ECG?
•   How does it work?
•   Procedure for the OSCE
•   Tips for this station
•   Questions
What is the ECG?
• ECG stands for electrocardiogram
• Its a recording of the heart’s electrical activity
• Useful in demonstrating heart pathology
         1


Voltage 0.5
(mV)

         0

      -0.5


                    Time (msec)
How does it work?
How does it work?

                 
          Time
The procedure
1. Relax, but be ready
2. Wash your hands using the gel provided
3. Introduction, explanation, consent

“Good afternoon. My name is Umar Hussain and I’m a 1st year
 medical student. I’m here today to record an ECG exam.
Basically it will involve me attaching these wires on to your
wrists and ankles; the computer will take a recording for
about a minute and then we’d be done. At no point should this
exam be painful, but if it does get to that stage then please let me
 know. Is this ok with you?”
The procedure
4. The patient will already have electrodes
  attached to them but if not:
  – Clean the inside of both wrists and ankles with a
    mediswab
  – Attach 5 electrodes to the patient:
     •   2 for the right wrist
     •   1 for the left wrist
     •   1 for the left ankle
     •   1 for right ankle
The procedure
5. Connect the wires in the following sequence:
  –   Right wrist:    Red and white
  –   Left wrist:
  –   Right ankle:    Green
  –   Left ankle:

  The wires should have labels on them (e.g. RA for right
  arm on the red and white wires) but learn the
  colours just in case
The procedure
6. Set sampling rate on computer to 400/s
7. Set time axis compression to 10:1


       File View Windows Macro Help                   400/s
                     Xt
                     2y


              2                                        2mV
              0
                                                    lead 1
              -2


              2

              0                                     lead 2
              -2


              2

              0
                                                    lead 3
              -2


              2

              0                                     lead 4
              -2
                                      Time
          M                                                   Start
                                             10:1
The procedure
8. Check the patient is comfortable
9. Ask the patient to sit quietly and to remain as still as
   possible for about a minute
10. Click the start button

         File View Windows Macro Help                   400/s
                       Xt
                       2y


                2                                        2mV
                0
                                                      lead 1
                -2


                2

                0                                     lead 2
                -2


                2

                0
                                                      lead 3
                -2


                2

                0                                     lead 4
                -2
                                        Time
            M                                                   Start
                                               10:1
The procedure
11. Once you have at least 10 cycles then stop
  recording
12. Disconnect the leads from the patient
12. Thank the patient for their cooperation
Analysing the ECG
• Now you have your recordings
• BUT you won’t use them!
• There is an ECG trace on a separate computer
  ready for you to analyse, for two reasons
  – Examiners
  – Good for you (in case you made a mess of your
    ECG recording there’s still marks to gain)
Analysing the ECG
• Now it’s time to select an ECG recording from the
  many on the screen
12. Select one of the leads which gives a large and
  clear R wave (lead 2)

        File View Windows Macro Help                   400/s
                      Xt
                      2y


               1                                        2mV
               0
                                                     lead 1
               -1


               1

               0                                     lead 2
               -1


               1

               0
                                                     lead 3
               -1


               1

               0                                     lead 4
               -1

                                       Time
           M                                                   Start
                                              10:1
Analysing the ECG
• If you still find it hard just try to see which lead has a
  recording closest to the “textbook ECG”
13. Click and hold down the mouse and drag a box over
  2 complete cardiac cycles, which you think are best

         File View Windows Macro Help                   400/s
                       Xt
                       2y


                1                                        2mV
                0
                                                      lead 1
                -1


                1

                0                                     lead 2
                -1


                1

                0
                                                      lead 3
                -1


                1

                0                                     lead 4
                -1

                                        Time
            M                                                   Start
                                               10:1
Analysing the ECG
14. Click on the windows menu and select Zoom
  Window from the drop down menu


       File View Windows Macro Help                   400/s
                      Xt
                      2y


              1                                        2mV
              0
                                                    lead 1
              -1   Zoom Window...

              1

              0                                     lead 2
              -1


              1

              0
                                                    lead 3
              -1


              1

              0                                     lead 4
              -1

                                      Time
          M                                                   Start
                                             10:1
Analysing the ECG
15. You now have a zoomed in view of the two
  cycles you need to analyse, but to make use of
  this you need to know the theory...
       File View Windows Macro Help            400/s
                          Xt
                          2y


              1                                 2mV
              0
                                             lead 1
              -1
                   1
              1

                                             lead 2
              0
                   0.5
              -1


              1    0
              0
                                             lead 3
              -1
                   -0.5
              1

                                             lead 4
              0
                   -1
              -1


          M                                            Start
                                      10:1
The ECG recording


                                          Time (msec)

• You will be asked to measure the duration of:
  – Segments
  – Intervals
The ECG recording - Segments

                P


                                                    Time (msec)

• The P-wave (P segment)
  – Formed when the atria are depolarised
  – Contraction of the atria occurs shortly after
The ECG recording - Segments
                          R


                P


                      Q       S

                                               Time (msec)

• The QRS complex (QRS segment)
  – Formed when the ventricles are depolarised
  – Much larger due to larger size of ventricles
The ECG recording - Segments
                         R


               P                     T


                     Q       S

                                              Time (msec)

• The T wave (T segment)
  – Formed when the ventricles repolarise
  – N.B the atria repolarise too but the signal is
    shadowed by the much more powerful signal of
    the QRS complex
The ECG recording - Segments
                        R


               P                    T


                    Q       S

                                             Time (msec)

• The P-Q segment (P-R segment)
  – The portion of the recording between P-wave and
    QRS complex
The ECG recording - Segments
                        R


               P                     T


                    Q       S

                                             Time (msec)

• The S-T segment
  – The portion of the recording between the QRS
    complex and the T-wave
The ECG recording - Intervals
                         R


                P                    T


                     Q       S

                                            Time (msec)

• The P-R interval
  – Misleading
  – From beginning of P to beginning of Q
The ECG recording - Intervals
                         R


               P                    T


                     Q       S

                                                Time (msec)

• The Q-T interval
  – From beginning of QRS complex to end of T
The ECG recording - Intervals
            R                                      R


    P                    T             P


        Q                                   Q          S
                S
                                                Time (msec)

• The T-P interval
  – From end of T to beginning of P on next wave
Analysing the ECG
16. Place the marker (M) at the beginning of the
  segment or interval you are asked to measure
  (e.g. P-R interval)
       File View Windows Macro Help            400/s
                          Xt
                          2y


             1                                  2mV
             0
                                             lead 1
             -1
                 1
            1

                                             lead 2
            0
                 0.5
            -1


            1    0
            0
                                             lead 3
            -1
                 -0.5
            1

                                             lead 4
            0
                 -1
            -1


                      M                                Start
                                      10:1
Analysing the ECG
17. Move the cursor along the trace to the end
  of the segment or interval you are asked to
  measure (e.g. P-R interval)
       File View Windows Macro Help                400/s
                        Xt
                        2y


             1                                      2mV
             0
                             t=∆0.256 s          lead 1
             -1
                 1
            1

                                                 lead 2
            0
                 0.5
            -1

                         M
            1    0
            0
                                                 lead 3
            -1
                 -0.5
            1

                                                 lead 4
            0
                 -1
            -1


                                                           Start
                                          10:1
Analysing the ECG
18. Now record the time from the top of the window
19. Tell the examiner your result and you’re done!!!

          File View Windows Macro Help                400/s
                           Xt
                           2y


                1                                      2mV
                0
                                t=∆0.256 s          lead 1
                -1
                    1
               1

                                                    lead 2
               0
                    0.5
               -1

                            M
               1    0
               0
                                                    lead 3
               -1
                    -0.5
               1

                                                    lead 4
               0
                    -1
               -1


                                                              Start
                                             10:1
Measuring Heart Rate using the ECG
• Change the time-axis compression to 50:1
• Again, use a lead on the ECG that is clear
• Highlight 15 seconds worth of graph

       File View Windows Macro Help                        400/s
                       Xt
                       2y


              1                                             2mV
              0
                                                         lead 1
              -1


              1

              0                                          lead 2
              -1


              1

              0
                                                         lead 3
              -1


              1

              0                                          lead 4
              -1
                   0                         15
                                      Time
          M                                                        Start
                                                  50:1
Measuring Heart Rate using the ECG
• Count the number of QRS complexes within
  the selection
• Multiply this number by 4...and you have your
  answer!
       File View Windows Macro Help                        400/s
                       Xt
                       2y


              1                                             2mV
              0
                                                         lead 1
              -1


              1

              0                                          lead 2
              -1


              1

              0
                                                         lead 3
              -1


              1

              0                                          lead 4
              -1
                   0                         15
                                      Time
          M                                                        Start
                                                  10:1
The ECG station
• Easy marks
• This skill is rarely given alone, so when
  practicing get the quickest time possible
• Make sure you know the theory inside out
• Practice makes perfect
• Act as if you would with a real patient
Any Questions?


GOOD LUCK!!!!!

Ecg

  • 1.
  • 2.
    Contents • What is the ECG? • How does it work? • Procedure for the OSCE • Tips for this station • Questions
  • 3.
    What is theECG? • ECG stands for electrocardiogram • Its a recording of the heart’s electrical activity • Useful in demonstrating heart pathology 1 Voltage 0.5 (mV) 0 -0.5 Time (msec)
  • 4.
  • 5.
    How does itwork?  Time
  • 6.
    The procedure 1. Relax,but be ready 2. Wash your hands using the gel provided 3. Introduction, explanation, consent “Good afternoon. My name is Umar Hussain and I’m a 1st year medical student. I’m here today to record an ECG exam. Basically it will involve me attaching these wires on to your wrists and ankles; the computer will take a recording for about a minute and then we’d be done. At no point should this exam be painful, but if it does get to that stage then please let me know. Is this ok with you?”
  • 7.
    The procedure 4. Thepatient will already have electrodes attached to them but if not: – Clean the inside of both wrists and ankles with a mediswab – Attach 5 electrodes to the patient: • 2 for the right wrist • 1 for the left wrist • 1 for the left ankle • 1 for right ankle
  • 8.
    The procedure 5. Connectthe wires in the following sequence: – Right wrist: Red and white – Left wrist: – Right ankle: Green – Left ankle: The wires should have labels on them (e.g. RA for right arm on the red and white wires) but learn the colours just in case
  • 9.
    The procedure 6. Setsampling rate on computer to 400/s 7. Set time axis compression to 10:1 File View Windows Macro Help 400/s Xt 2y 2 2mV 0 lead 1 -2 2 0 lead 2 -2 2 0 lead 3 -2 2 0 lead 4 -2 Time M Start 10:1
  • 10.
    The procedure 8. Checkthe patient is comfortable 9. Ask the patient to sit quietly and to remain as still as possible for about a minute 10. Click the start button File View Windows Macro Help 400/s Xt 2y 2 2mV 0 lead 1 -2 2 0 lead 2 -2 2 0 lead 3 -2 2 0 lead 4 -2 Time M Start 10:1
  • 11.
    The procedure 11. Onceyou have at least 10 cycles then stop recording 12. Disconnect the leads from the patient 12. Thank the patient for their cooperation
  • 12.
    Analysing the ECG •Now you have your recordings • BUT you won’t use them! • There is an ECG trace on a separate computer ready for you to analyse, for two reasons – Examiners – Good for you (in case you made a mess of your ECG recording there’s still marks to gain)
  • 13.
    Analysing the ECG •Now it’s time to select an ECG recording from the many on the screen 12. Select one of the leads which gives a large and clear R wave (lead 2) File View Windows Macro Help 400/s Xt 2y 1 2mV 0 lead 1 -1 1 0 lead 2 -1 1 0 lead 3 -1 1 0 lead 4 -1 Time M Start 10:1
  • 14.
    Analysing the ECG •If you still find it hard just try to see which lead has a recording closest to the “textbook ECG” 13. Click and hold down the mouse and drag a box over 2 complete cardiac cycles, which you think are best File View Windows Macro Help 400/s Xt 2y 1 2mV 0 lead 1 -1 1 0 lead 2 -1 1 0 lead 3 -1 1 0 lead 4 -1 Time M Start 10:1
  • 15.
    Analysing the ECG 14.Click on the windows menu and select Zoom Window from the drop down menu File View Windows Macro Help 400/s Xt 2y 1 2mV 0 lead 1 -1 Zoom Window... 1 0 lead 2 -1 1 0 lead 3 -1 1 0 lead 4 -1 Time M Start 10:1
  • 16.
    Analysing the ECG 15.You now have a zoomed in view of the two cycles you need to analyse, but to make use of this you need to know the theory... File View Windows Macro Help 400/s Xt 2y 1 2mV 0 lead 1 -1 1 1 lead 2 0 0.5 -1 1 0 0 lead 3 -1 -0.5 1 lead 4 0 -1 -1 M Start 10:1
  • 17.
    The ECG recording Time (msec) • You will be asked to measure the duration of: – Segments – Intervals
  • 18.
    The ECG recording- Segments P Time (msec) • The P-wave (P segment) – Formed when the atria are depolarised – Contraction of the atria occurs shortly after
  • 19.
    The ECG recording- Segments R P Q S Time (msec) • The QRS complex (QRS segment) – Formed when the ventricles are depolarised – Much larger due to larger size of ventricles
  • 20.
    The ECG recording- Segments R P T Q S Time (msec) • The T wave (T segment) – Formed when the ventricles repolarise – N.B the atria repolarise too but the signal is shadowed by the much more powerful signal of the QRS complex
  • 21.
    The ECG recording- Segments R P T Q S Time (msec) • The P-Q segment (P-R segment) – The portion of the recording between P-wave and QRS complex
  • 22.
    The ECG recording- Segments R P T Q S Time (msec) • The S-T segment – The portion of the recording between the QRS complex and the T-wave
  • 23.
    The ECG recording- Intervals R P T Q S Time (msec) • The P-R interval – Misleading – From beginning of P to beginning of Q
  • 24.
    The ECG recording- Intervals R P T Q S Time (msec) • The Q-T interval – From beginning of QRS complex to end of T
  • 25.
    The ECG recording- Intervals R R P T P Q Q S S Time (msec) • The T-P interval – From end of T to beginning of P on next wave
  • 26.
    Analysing the ECG 16.Place the marker (M) at the beginning of the segment or interval you are asked to measure (e.g. P-R interval) File View Windows Macro Help 400/s Xt 2y 1 2mV 0 lead 1 -1 1 1 lead 2 0 0.5 -1 1 0 0 lead 3 -1 -0.5 1 lead 4 0 -1 -1 M Start 10:1
  • 27.
    Analysing the ECG 17.Move the cursor along the trace to the end of the segment or interval you are asked to measure (e.g. P-R interval) File View Windows Macro Help 400/s Xt 2y 1 2mV 0 t=∆0.256 s lead 1 -1 1 1 lead 2 0 0.5 -1 M 1 0 0 lead 3 -1 -0.5 1 lead 4 0 -1 -1 Start 10:1
  • 28.
    Analysing the ECG 18.Now record the time from the top of the window 19. Tell the examiner your result and you’re done!!! File View Windows Macro Help 400/s Xt 2y 1 2mV 0 t=∆0.256 s lead 1 -1 1 1 lead 2 0 0.5 -1 M 1 0 0 lead 3 -1 -0.5 1 lead 4 0 -1 -1 Start 10:1
  • 29.
    Measuring Heart Rateusing the ECG • Change the time-axis compression to 50:1 • Again, use a lead on the ECG that is clear • Highlight 15 seconds worth of graph File View Windows Macro Help 400/s Xt 2y 1 2mV 0 lead 1 -1 1 0 lead 2 -1 1 0 lead 3 -1 1 0 lead 4 -1 0 15 Time M Start 50:1
  • 30.
    Measuring Heart Rateusing the ECG • Count the number of QRS complexes within the selection • Multiply this number by 4...and you have your answer! File View Windows Macro Help 400/s Xt 2y 1 2mV 0 lead 1 -1 1 0 lead 2 -1 1 0 lead 3 -1 1 0 lead 4 -1 0 15 Time M Start 10:1
  • 31.
    The ECG station •Easy marks • This skill is rarely given alone, so when practicing get the quickest time possible • Make sure you know the theory inside out • Practice makes perfect • Act as if you would with a real patient
  • 32.