This document provides an overview of a course on earthquakes and tectonics. The course will integrate complementary techniques to study lithospheric deformation, including seismology, geodesy, geology, and modeling. It will cover topics like earthquake focal mechanisms, moment tensors, plate tectonics, plate motions, fault zones, and the seismic cycle. Studying earthquakes and tectonics requires considering aspects of seismology, geology, geophysics, and their interrelationships.
Describing earthquakes more in detail about what, how, why, when and from whom are these caused, affected and what makes it so important to study this in current spatial and geographical scenario taking in mind the historical events.
Describing earthquakes more in detail about what, how, why, when and from whom are these caused, affected and what makes it so important to study this in current spatial and geographical scenario taking in mind the historical events.
This report contains the brief introduction to earthquake,its effect,causes etc..
And case study of kuchha(bhuj),Gujarat Earthquake on 26th january,2001
This report contains the brief introduction to earthquake,its effect,causes etc..
And case study of kuchha(bhuj),Gujarat Earthquake on 26th january,2001
Page | 331
Introductory GeoloGy earthquakes
13.10 sTudenT resPonses
1. For Carrier, Oklahoma, what is the approximate time of the arrival of the first
P-wave?
a. 10 seconds b. 15 seconds c. 21 seconds d. 30 seconds
2. For Marlow, Oklahoma, what is the approximate time of the arrival of the first
S-wave?
a. 19 seconds b. 22 seconds c. 35 seconds d. 42 seconds
3. For Bolivar, Missouri, what is the difference between the P and S wave arrival
times?
a. 10 seconds b. 20 seconds c. 40 seconds d. 55 seconds
4. What is the approximate distance to the epicenter from Carrier, Oklahoma?
a. 70 km b. 130 km c. 240 km d. 390 km
5. What is the approximate distance to the epicenter from Marlow, Oklahoma?
a. 70 km b. 130 km c. 240 km d. 390 km
6. What is the approximate distance to the epicenter from Bolivar, Missouri?
a. 70 km b. 130 km c. 240 km d. 390 km
7. Look at the location that you determined was the earthquake epicenter.
Compare its location to Oklahoma City. Which direction is the epicenter located
from Oklahoma City?
a. southeast b. northwest c. northeast d. southwest
8. Examine the before and after image of the National Cathedral. Based on the
changes seen within the structure, decide where this earthquake would most
likely fall on the Modified Mercalli Intensity Scale. Based off this image, the
most likely intensity of this earthquake would be:
a. <IV b. V-VI c. VII d. VIII or greater
Page | 332
Introductory GeoloGy earthquakes
9. Residents in Port-au-Prince complained of extreme shaking during the
earthquake, while residents of Santo Domingo, the capital of the Dominican
Republic that sits 150 miles east of Port-au-Prince, assumed the shaking was
caused by the passing of a large truck. Based on the Modified Mercalli Intensity
Scale, the residents of Port-au-Prince mostly like experienced an intensity of
___, while the residents of Santo Domingo experienced an intensity of ___.
a. VII, II b. VIII, III c. X, III d. X, IV
10. A significant earthquake hits San Mateo, California while you are there. During
the shaking you are caught indoors. Would you rather be at the US Social
Security Administration Building (located at South Claremont Street, San
Mateo) or with the San Mateo Park Rangers (located at J Hart Clinton Drive,
San Mateo)?
a. the US Social Security Administration Building b. the San Mateo Park Rangers
11. While visiting California, you become violently ill and must visit a hospital.
Based off of your fears of a possible earthquake occurring, would you rather go
to Highland Hospital in Oakland or Alameda Hospital in Alameda?
a. Highland Hospital, Oakland, CA b. Alameda Hospital, Alameda, CA
12. After what year does the number of magnitude 3 or greater earthquakes begin
to rise significantly?
a. 2007 b. 2009 c. 2011 d. 2015
13. After what year does the number of fracking wells begin to rise significantly?
a. 2007 b. 2009 c. 2011 d. 2015
14. Based on the graph that you constructed, do .
An earthquake (also known as a quake, tremor or temblor) is is the shaking of the surface of the Earth, resulting from the sudden release of energy in the Earth's lithosphere that creates seismic waves. Earthquakes can range in size from those that are so weak that they cannot be felt to those violent enough to the people around and destroy whole cities.
Earliest Galaxies in the JADES Origins Field: Luminosity Function and Cosmic ...Sérgio Sacani
We characterize the earliest galaxy population in the JADES Origins Field (JOF), the deepest
imaging field observed with JWST. We make use of the ancillary Hubble optical images (5 filters
spanning 0.4−0.9µm) and novel JWST images with 14 filters spanning 0.8−5µm, including 7 mediumband filters, and reaching total exposure times of up to 46 hours per filter. We combine all our data
at > 2.3µm to construct an ultradeep image, reaching as deep as ≈ 31.4 AB mag in the stack and
30.3-31.0 AB mag (5σ, r = 0.1” circular aperture) in individual filters. We measure photometric
redshifts and use robust selection criteria to identify a sample of eight galaxy candidates at redshifts
z = 11.5 − 15. These objects show compact half-light radii of R1/2 ∼ 50 − 200pc, stellar masses of
M⋆ ∼ 107−108M⊙, and star-formation rates of SFR ∼ 0.1−1 M⊙ yr−1
. Our search finds no candidates
at 15 < z < 20, placing upper limits at these redshifts. We develop a forward modeling approach to
infer the properties of the evolving luminosity function without binning in redshift or luminosity that
marginalizes over the photometric redshift uncertainty of our candidate galaxies and incorporates the
impact of non-detections. We find a z = 12 luminosity function in good agreement with prior results,
and that the luminosity function normalization and UV luminosity density decline by a factor of ∼ 2.5
from z = 12 to z = 14. We discuss the possible implications of our results in the context of theoretical
models for evolution of the dark matter halo mass function.
Seminar of U.V. Spectroscopy by SAMIR PANDASAMIR PANDA
Spectroscopy is a branch of science dealing the study of interaction of electromagnetic radiation with matter.
Ultraviolet-visible spectroscopy refers to absorption spectroscopy or reflect spectroscopy in the UV-VIS spectral region.
Ultraviolet-visible spectroscopy is an analytical method that can measure the amount of light received by the analyte.
Cancer cell metabolism: special Reference to Lactate PathwayAADYARAJPANDEY1
Normal Cell Metabolism:
Cellular respiration describes the series of steps that cells use to break down sugar and other chemicals to get the energy we need to function.
Energy is stored in the bonds of glucose and when glucose is broken down, much of that energy is released.
Cell utilize energy in the form of ATP.
The first step of respiration is called glycolysis. In a series of steps, glycolysis breaks glucose into two smaller molecules - a chemical called pyruvate. A small amount of ATP is formed during this process.
Most healthy cells continue the breakdown in a second process, called the Kreb's cycle. The Kreb's cycle allows cells to “burn” the pyruvates made in glycolysis to get more ATP.
The last step in the breakdown of glucose is called oxidative phosphorylation (Ox-Phos).
It takes place in specialized cell structures called mitochondria. This process produces a large amount of ATP. Importantly, cells need oxygen to complete oxidative phosphorylation.
If a cell completes only glycolysis, only 2 molecules of ATP are made per glucose. However, if the cell completes the entire respiration process (glycolysis - Kreb's - oxidative phosphorylation), about 36 molecules of ATP are created, giving it much more energy to use.
IN CANCER CELL:
Unlike healthy cells that "burn" the entire molecule of sugar to capture a large amount of energy as ATP, cancer cells are wasteful.
Cancer cells only partially break down sugar molecules. They overuse the first step of respiration, glycolysis. They frequently do not complete the second step, oxidative phosphorylation.
This results in only 2 molecules of ATP per each glucose molecule instead of the 36 or so ATPs healthy cells gain. As a result, cancer cells need to use a lot more sugar molecules to get enough energy to survive.
introduction to WARBERG PHENOMENA:
WARBURG EFFECT Usually, cancer cells are highly glycolytic (glucose addiction) and take up more glucose than do normal cells from outside.
Otto Heinrich Warburg (; 8 October 1883 – 1 August 1970) In 1931 was awarded the Nobel Prize in Physiology for his "discovery of the nature and mode of action of the respiratory enzyme.
WARNBURG EFFECT : cancer cells under aerobic (well-oxygenated) conditions to metabolize glucose to lactate (aerobic glycolysis) is known as the Warburg effect. Warburg made the observation that tumor slices consume glucose and secrete lactate at a higher rate than normal tissues.
This pdf is about the Schizophrenia.
For more details visit on YouTube; @SELF-EXPLANATORY;
https://www.youtube.com/channel/UCAiarMZDNhe1A3Rnpr_WkzA/videos
Thanks...!
THE IMPORTANCE OF MARTIAN ATMOSPHERE SAMPLE RETURN.Sérgio Sacani
The return of a sample of near-surface atmosphere from Mars would facilitate answers to several first-order science questions surrounding the formation and evolution of the planet. One of the important aspects of terrestrial planet formation in general is the role that primary atmospheres played in influencing the chemistry and structure of the planets and their antecedents. Studies of the martian atmosphere can be used to investigate the role of a primary atmosphere in its history. Atmosphere samples would also inform our understanding of the near-surface chemistry of the planet, and ultimately the prospects for life. High-precision isotopic analyses of constituent gases are needed to address these questions, requiring that the analyses are made on returned samples rather than in situ.
Observation of Io’s Resurfacing via Plume Deposition Using Ground-based Adapt...Sérgio Sacani
Since volcanic activity was first discovered on Io from Voyager images in 1979, changes
on Io’s surface have been monitored from both spacecraft and ground-based telescopes.
Here, we present the highest spatial resolution images of Io ever obtained from a groundbased telescope. These images, acquired by the SHARK-VIS instrument on the Large
Binocular Telescope, show evidence of a major resurfacing event on Io’s trailing hemisphere. When compared to the most recent spacecraft images, the SHARK-VIS images
show that a plume deposit from a powerful eruption at Pillan Patera has covered part
of the long-lived Pele plume deposit. Although this type of resurfacing event may be common on Io, few have been detected due to the rarity of spacecraft visits and the previously low spatial resolution available from Earth-based telescopes. The SHARK-VIS instrument ushers in a new era of high resolution imaging of Io’s surface using adaptive
optics at visible wavelengths.
5. Studying the lithosphere involves integrating plate tectonics,
seismology, geodesy, geology, rock mechanics, thermal studies,
modeling and much more
No clear dividing lines between subfields
“When we try to pick out anything by itself, we find it hitched to
everything else in the universe.”
John Muir
“Half of what we will teach you in the next few years is wrong. The
problem is we don’t know which half”
Medical school dean to incoming students
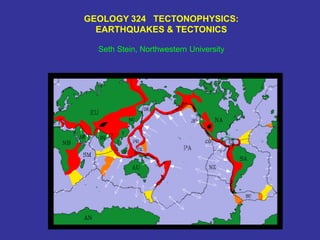
6. EARTHQUAKES & TECTONICS
Locations map
plate boundary
zones & regions
of intraplate
deformation even
in underwater or
remote areas
Focal
mechanisms
show strain field
Slip & seismic
history show
deformation rate
Depths constrain
thermo-
mechanical
structure of
lithosphere
PACIFIC
NORTH
AMERICA
San Andreas Fault, Carrizo Plain
36 mm/yr
7. PLATE KINEMATICS, directions and
rates of plate motions
Can observe directly
Primary constraint on lithospheric
processes
PLATE DYNAMICS, forces
causing plate motions
Harder to observe directly
Observe indirect effects (seismic
velocity, gravity, etc)
Studied via models
Closely tied to mantle dynamics
Kinematics primary constraint on
models
8. In general, the most destructive earthquakes occur
where large populations live near plate
boundaries. The highest property losses occur in
developed nations where more property is at risk,
whereas fatalities are highest in developing
nations.
Estimates are that the 1990 Northern Iran shock
killed 40,000 people, and that the 1988 Spitak
(Armenia) earthquake killed 25,000. Even in
Japan, where modern construction practices
reduce earthquake damage, the 1995 Kobe
earthquake caused more than 5,000 deaths and
$100 billion of damage. On average during the
past century earthquakes have caused about
11,500 deaths per year.
The earthquake risk in the United States is much
less than in many other countries because large
earthquakes are relatively rare in most of the U.S.
and because of earthquake-resistant construction
EARTHQUAKES & SOCIETY
9. Hazard is the intrinsic natural occurrence of
earthquakes and the resulting ground motion and
other effects.
Risk is the danger the hazard poses to life and
property.
Although the hazard is an unavoidable geological
fact, risk is affected by human actions.
Areas of high hazard can have low risk because
few people live there, and areas of modest hazard
can have high risk due to large populations and
poor construction.
Earthquake risks can be reduced by human
actions, whereas hazards cannot
Bam, Iran earthquake: M 6.5 30,000 deaths
San Simeon, Ca earthquake: M6.5 2 deaths
Earthquakes don’t kill people (generally, tsunami
exception), buildings kill people
NATURAL DISASTERS:
HAZARDS
AND RISKS
10. Earthquake locations map narrow plate boundaries, broad plate
boundary zones & regions of intraplate deformation even in
underwater or remote areas
INTRAPLATE
NARROW
BOUNDARIES
DIFFUSE BOUNDARY
ZONES
Stein & Wysession, 2003 5.1-4
11. BASIC
CONCEPTS:
KINEMATICS
CONTROL
BOUNDARY
NATURE
Direction of relative motion between plates at a point on their boundary determines
the nature of the boundary.
At spreading centers both plates move
away from boundary
At subduction zones subducting plate
moves toward boundary
At transforms, relative plate motion
parallel to boundary
Real boundaries often combine
aspects (transpression, transtension)
Transtension - Dead Sea transform
Arabia
Sinai
4 mm/yr
S&W
5.1-4
12. Boundaries are described either as
- midocean-ridges and trenches, emphasizing morphology
- or as divergent (spreading centers) and convergent (subduction zones),
emphasizing kinematics
NOMENCLATURE:
Latter nomenclature is more precise
because there are
- elevated features in ocean basins
that are not spreading ridges
- spreading centers like the
East African rift within continents
-continental convergent zones like
the Himalaya may not have active
subduction
- etc
13. At a point r along the boundary
between two plates, with latitude
and longitude , the linear
velocity of plate j with respect to
plate i , v ji , is given by the
vector cross product
v ji = j i x r
r is the position vector to the
point on the boundary
j i is the angular velocity vector
or Euler vector described by its
magnitude (rotation rate) |j i |
and pole (surface position) (, )
EULER VECTOR
Relative motion between two rigid plates on the spherical earth can be
described as a rotation about an Euler pole
Linear velocity
r
Stein & Wysession, 2003
14. Direction of relative motion is a small circle
about the Euler pole
First plate ( j) moves counterclockwise ( right
handed sense) about pole with respect to
second plate (i).
Boundary segments with relative motion
parallel to the boundary are transforms, small
circles about the pole
Segments with relative motion away from the
boundary are spreading centers
Segments with relative motion toward
boundary are subduction zones
Magnitude (rate) of relative motion increases
with distance from pole because
|v ji | = |j i | | r | sin , where is the angle
between pole and site
All points on a boundary have the same
angular velocity, but the magnitude of linear
velocity varies from zero at the pole to a
maximum 90º away.
21
2 wrt 1
12
1 wrt 2
Stein & Wysession, 2003
15. BOUNDARY TYPE
CHANGES WITH
ORIENTATION
PACIFIC -
NORTH AMERICA
PACIFIC wrt
NORTH
AMERICA
pole
CONVERGENCE -
ALEUTIAN TRENCH
54 mm/yr
EXTENSION -
GULF OF CALIFORNIA
STRIKE SLIP -
SAN ANDREAS
Stein & Wysession, 2003 5.2-3
16. SAN ANDREAS FAULT NEAR SAN
FRANCISCO
Type example of transform on land
17. 1989 LOMA PRIETA, CALIFORNIA EARTHQUAKE
MAGNITUDE 7.1 ON THE SAN ANDREAS
Davidson et al
18. 1989 LOMA PRIETA,
CALIFORNIA
EARTHQUAKE
The two level Nimitz
freeway collapsed
along
a 1.5 km section in
Oakland, crushing cars
Freeway had been
scheduled for retrofit to
improve earthquake
resistance
19. 1989 LOMA PRIETA,
CALIFORNIA EARTHQUAKE
Houses collapsed in the
Marina district of San
Francisco
Shaking amplified by low
velocity landfill
Stein & Wysession 2003 2.4-10 (USGS)
20. 1964 ALASKA
EARTHQUAKE
Ms 8.4 Mw 9.1
Pacific subduction
beneath North America
~ 7 m of slip on 500x300 km2
of Aleutian Trench
Second or third largest
earthquake recorded to date
~ 130 deaths
Catalyzed idea that great
thrust fault earthquakes
result from slip on
subduction zone plate
interface
TRENCH-NORMAL
CONVERGENCE -
ALEUTIAN TRENCH
54 mm/yr
PACIFIC NORTH AMERICA
21. 1971 Ms 6.6 SAN
FERNANDO
EARTHQUAKE
1.4 m slip on 20x14
km2 fault
Thrust faulting from
compression across
Los Angeles Basin
Fault had not been
previously recognized
65 deaths, in part due
to structural failure
Prompted
improvements in
building code &
hazard mapping
22. Caused some of the highest ground accelerations
ever recorded. It illustrates that even a moderate
magnitude earthquake can do considerable
damage in a populated area. Although the loss of
life (58 deaths) was small due to earthquake-
resistant construction the $20B damage makes it
the most costly earthquake to date in the U.S.
Los Angeles Basin
Thrust earthquakes
indicate shortening
1994 Northridge
Ms 6.7
AFTTERSHOCKS
S&W 4.5-9
23. Materials at distance on
opposite sides of the
fault move relative to
each other, but friction
on the fault "locks" it
and prevents slip
Eventually strain
accumulated is more
than the rocks on the
fault can withstand, and
the fault slips in
earthquake
Earthquake reflects
regional deformation
ELASTIC REBOUND OR SEISMIC CYCLE MODEL
S&W 4.1-3
24. Earthquakes are most dramatic part of a seismic cycle occuring on segments of
the plate boundary over 100s to 1000s of years.
During interseismic stage, most of the cycle, steady motion occurs away from
fault but fault is "locked", though some aseismic creep can occur on it.
Immediately prior to rupture is a preseismic stage, that can be associated with
small earthquakes (foreshocks) or other possible precursory effects.
Earthquake itself is coseismic phase, during which rapid motion on fault
generates seismic waves. During these few seconds, meters of slip on fault
"catch up" with the few mm/yr of motion that occurred over 100s of years away
from fault.
Finally, postseismic phase occurs after earthquake, and aftershocks and
transient afterslip occur for a period of years before fault settles into its steady
interseismic behavior again.
ELASTIC REBOUND OR SEISMIC CYCLE MODEL
25. 1906 SAN FRANCISCO
EARTHQUAKE (magnitude 7.8)
~ 4 m of slip on 450 km of San Andreas
~2500 deaths, ~28,000 buildings
destroyed (most by fire)
Catalyzed ideas about relation of
earthquakes & surface faults
Boore, 1977
S&W 4.1-2
26. Over time, slip in earthquakes adds up
and reflects the plate motion
Offset fence showing 3.5 m of left-
lateral strike-slip motion along San
Andreas fault in 1906 San Francisco
earthquake
~ 35 mm/yr motion between Pacific and
North American plates along San
Andreas shown by offset streams &
GPS
Expect earthquakes on average every
~ (3.5 m )/ (35 mm/yr) =100 years
Turns out more like 200 yrs because
not all motion is on the San Andreas
Moreover, it’s irregular rather than
periodic
SEISMIC CYCLE AND PLATE MOTION
27. EARTHQUAKE RECURRENCE IS HIGHLY VARIABLE
Reasons are unclear: randomness, stress effects of other earthquakes on
nearby faults…
M>7 mean 132 yr s 105 yr
Sieh et al., 1989
Extend earthquake history
with paleoseismology
S&W 1.2-15
28. CHALLENGES OF STUDYING EARTHQUAKE CYCLE
Cycle lasts hundreds of years, so don’t have observations of it in any one place
Combine observations from different places in hope of gaining complete view
Unclear how good that view is and how well models represent its complexity.
Research integrates various techniques:
Most faults are identified from earthquakes on them: seismology is primary tool
to study the motion during earthquakes and infer long term motion
Also
- Historical records of earthquakes
- Field studies of location, geometry, and history of faults
- Geodetic measurements of deformation before, during, and after earthquakes
- Laboratory results on rock fracture
29. SAR image of Hayward fault
(red line), part of San Andreas
fault system, in the Berkeley
(east San Francisco Bay) area.
Color changes from orange
to blue show about 2 cm of
gradual movement.
This movement is called
aseismic creep because the
fault moved slowly without
generating an earthquake
GEODETIC DATA GIVE INSIGHT INTO DEFORMATION BEYOND THAT
SHOWN SEISMOLOGICALLY
Study aseismic processes
Study seismic cycle before, after, and in between earthquakes, whereas we
can only study the seismic waves once an earthquake occurs
30. ELASTIC
REBOUND
MODEL OF
STRIKE-SLIP
FAULT AT A
PLATE
BOUNDARY
Large
earthquakes
release all strain
accumulated on
locked fault
between
earthquakes
Coseismic and
interseismic
motion sum to
plate motion
Interseismic
strain
accumulates near
fault
Stein & Wysession, 2003 4.5-12
31. ELASTIC
REBOUND
MODEL OF
STRIKE-SLIP
FAULT AT A
PLATE
BOUNDARY
Fault parallel interseismic motion on fault with far field slip rate D,
locked to depth W, as function of cross-fault distance y
s(y) = D/2 + (D / π) tan -1 (y/W)
Width of strain accumulation zone comparable to locking depth
33. PACIFIC-NORTH AMERICA PLATE BOUNDARY
ZONE: PLATE MOTION & ELASTIC STRAIN
~ 50 mm/yr
plate motion
spread over
~ 1000 km
~ 35 mm/yr
elastic strain
accumulation
from locked San
Andreas in
region
~ 100 km wide
Locked strain
will be released
in earthquakes
Since last
earthquake in
1857 ~ 5 m slip
accumulated
Elastic
strain
Broad
PBZ
Stein & Sella 2002
34. EARTHQUAKE CYCLE
INTERSEISMIC:
India subducts beneath
Burma at about 20 mm/yr
Fault interface is locked
EARTHQUAKE
(COSEISMIC):
Fault interface slips,
overriding plate
rebounds, releasing
accumulated motion and
generating tsunami HOW OFTEN:
Fault slipped ~ 10 m --> 10000 mm / 20 mm/yr = 500 yr
Longer if some slip is aseismic
Faults aren’t exactly periodic, likely because chaotic nature of
rupture controls when large earthquakes occur
Stein & Wysession, 2003 4.5-14
INDIA BURMA
Tsunami generated
SUMATRA TRENCH
35. TSUNAMI GENERATED ALONG FAULT, WHERE SEA
FLOOR DISPLACED, AND SPREADS OUTWARD
http://staff.aist.go.jp/kenji.satake/animation.gif
Red - up motion, blue down
Hyndeman and Wang, 1993
36. SEISMIC WAVES
COMPRESSIONAL
(P)
AND SHEAR (S)
WAVES
P waves
longitudinal waves
S waves transverse
waves
P waves travel
faster
S waves from
earthquake
generally larger
Stein & Wysession, 2003
37. EARTHQUAKE LOCATION
Least squares fit to travel times
Accuracy (truth) depends primarily on
velocity model
Precision (formal uncertainty) depends
primarily on network geometry (close
stations & eq within network help)
Locations can be accurate but
imprecise or precise but inaccurate
(line up nicely but displaced from fault)
Epicenters (surface positions) better
determined than depths or hypocenters
(3D positions) because seismometers
only on surface
38. IMPROVE EARTHQUAKE LOCATION
Precision can be improved by relative
location methods like Joint Epicenter
Determination (JED) or master event
Or via better velocity
model, including methods
that simultaneously
improve velocity model
(double-difference
tomography)
Dewey, 1987
39. IMPROVE EARTHQUAKE LOCATION
Precision can be improved by relative
location methods like Joint Epicenter
Determination (JED) or master event
Or via better velocity
model, including methods
that simultaneously
improve velocity model
(double-difference
tomography)
Dewey, 1987